www.orientjchem.org
An International Open Free Access, Peer Reviewed Research Journal
2016, Vol. 32, No. (6): Pg. 3235-3241
Evaluation of the Organic Carbon Content in the
Low-Permeability Shale Formations (As in the Case of the
Khadum Suite in the Ciscaucasia Region)
V.YU. KERIMOV, R.N. MUSTAEV and A.V. BONdAREV
Gubkin Russian State University of Oil and Gas (National Research University), Building 1, 65 Leninsky Prospekt, Moscow, 119991, Russia.
http://dx.doi.org/10.13005/ojc/320648
(Received: October 18, 2016; Accepted: November 24, 2016)
ABSTRACT
The objective of the study is to evaluate the initial content of organic carbon, which is lost in the hydrocarbon generation and catagenesis. It is required for the reliable evaluation of source rock generation potential. The greater the differences between the contemporary and initial values of organic carbon, the greater the maturity of the source rock. Due to the catagenetic consumption of organic substance for the formation of hydrocarbons and non-hydrocarbon products, there is a reduction in the mass of organic substance during the catagenesis, and at every stage of transformation we deal with the residual concentrations. To restore the original values of organic carbon by the beginning of catagenesis, i.e. by the beginning of HC generation, we recommend using the conversion factors that take into account both the type and concentration of substance, as well as the catagenesis gradations, reached by the oil source deposits. As a result of calculations, it was determined that the original concentrations of organic carbon in Bajocian-Bathian clays is 2.7-3.12%, in the Aptian-Albian deposits – 3.9 to 4.4%, in the deposits of the Khadum suite – 3-5.5%. Due to that, the average hydrocarbon potential was increased 1.5-2 times. Based on the results of initial source rock state recovery, we have made a map of initial organic carbon content that allows us to give a reliable estimate of generation potential for the source rocks of the Khadum suite, and to determine the perspectives of hydrocarbon accumulations exploration in the low-permeability shale formations of Ciscaucasia.
Keywords: Organic carbon, Catagenesis, Generation, Hydrocarbon,
Generation potential, source rock, Khadum suite, shale formations.
INTROdUCTION
The nonconventional HC resources in the low-permeability shale formations are associated with the regions of immature potentially “rich” and “very rich” oil source rocks development that are
interest for prospecting and exploration of oil and gas accumulations in the low-permeability shale clay formations may present the enriched OMs. The number of TOC usually reaches values of 2% < TOC < 10%. The higher is TOC, the greater the productive potential of shale low-permeability clay formations. However, as evidenced by the geochemical surveys, the organic matters contained in the shale low-permeability reservoirs often are relatively immature and are at the stage of early oil generation. The hydrocarbon generation also occurs in such formations, which have not reached a sufficient depth of immersion and temperature peak1. Thus, TOC is the most important parameter
in the evaluation of HCs resources of shale reservoir. The hydrocarbons recoverable from the oil and gas bearing shale will be contained in the formation with such concentration, which has arisen as a result of their generation in situ. The subject of forecasting and searching should be the oil and gas bearing plays.
As the oil and gas bearing shales, the authors of the article consider a number of solid, multilayered pelitic rocks (clay, marl, clayey limestone, mudstone, siltstone and shale itself), which enclose all possible forms of OM, reflecting the stages of its maturity6. Differing from the other pelitic
rocks by textural characteristics, the shales can be cleaved into plates. An important distinctive feature8
of accumulations in the shale and tight reservoirs is that the HCs have the dispersed state in the rocks with low permeability matrix10. In such rocks, the oil
and gas have mainly the diffusely dispersed state in the microcracks.
In addition to the above features, these formations are characterized by: increasing clay content of cuts in the direction of folding immersion – from the sides to the central parts of depressions and deflections, decreasing reservoir properties, increasing dispersion degree of the terrigenous material, growing content of silt and pelitic fractions in the particle size composition, decreasing porosity and increasing pore tortuosity; reduction in the capacity and consistent wedging out of cut components from the central portions of basin to their peripheral framing, and, due to that, the formation of deadlock hydrodynamic sections (lenses, “pockets”); development of predominantly clay fraction in the central portions of basin; and decreasing fracturing
of carbonate intervals along the immersion, i.e. lenticular substantially shape of reservoirs, where the probability of any significant fluids motion along the Elysion model is rather limited.
The objective of the studies is to evaluate the initial content of organic carbon that is lost during the hydrocarbon generation and catagenesis, which is required for a reliable evaluation of source rock generation potential.
Research methods
One of the main parameters, characterizing the petroleum bearing rocks (PBRs), is the total organic carbon content (TOC). According to various researchers, different values of the PBRs concentration limits are allocated13-15. Most
researchers consider the contribution of deposits, containing TOC < 1%, as negligible in the formation of oil and gas bearing potential of subsoils and do not consider them as the HCs sources. In the Russian practice, they use the values of TOC > 0.1% in the carbonate rocks and TOC > 0.2% in clayey rocks, as sufficient to classify deposits as the PBRs because at those TOC contents the desorption of bitumenoids occurs, and they are able to emigrate.
Within the Terek-Caspian trough, the PBRs are highlighted in the following deposit complexes: Middle Jurassic, terrigenous (Bajocian- Bathian); Aptian-Albian, terrigenous, Paleocene-Eocene (Kuma horizon); Oligocene (Khadum suite). For the platform part of the studied area the PBRs are highlighted in the following deposit complexes: Middle Jurassic, terrigenous (Bajocian- Bathian); Aptian-Albian, terrigenous; Oligocene (Khadum and Batalpashinsk suites).
The conducted studies indicate the high oil source properties and allow to highly consider the prospects of searches of both conventional and unconventional (shale) HCs resources of the Khadum deposits in the Central and East Caucasus region. According to the results of chemical-bitumenological studies by various authors2, 7-8, 12, etc, the TOC content
method using Rock-Eval analyzer (226 samples), is 2.11%. The average TOC content value for Khadum rocks is 2.26%. With increasing degree of the carbonation of rocks, the TOC content is reduced. Minimum values are marked for limestone (0.25%). The highest average TOC values are characteristic of clay and marl of the Ostracoda horizon– 4.46%. The regularities of the change in TOC concentrations along the area of the studied region are shown in Fig. 1. The scheme in Fig. 1 shows that the area of maximum TOC values (3-4%) extends diagonally from the northwest centroclinal of the Terek-Caspian trough (Soviet, Kursk area) in the north-east towards the East Manych trough through the central part of the shaft Prikumsk (Achikulak, Yemelyanovsky, and Novomolodezhnaya areas). Some local maxima of TOC concentrations (about 2-3%) are observed in the eastern parts of the Terek-Sunzha folded zone (Oktyabrskaya and Khankalskaya areas) and foothills of Dagestan (Dimitrov area).
Khadum deposits of the Eastern and Central Ciscaucasia can be characterized primarily as “rich” (TOC e” 1-3%) and “very rich” (TOC > 3%) source rocks. The zone of “very rich” oil source Khadum deposits crosses the study area by a narrow diagonal stripe in the direction from south-west to north-east. There, TOC reach up to 4% and more. Some local areas of “very rich” Khadum PBRs are also fixed within the Terek-Sunzha region. In the predominant part of the study area, studied deposits can be classified as “rich” PBRs. Only in some local areas (north-west of the Stavropol arch framing, framing the western Caspian Sea, the western part of Sulak cavity) studied deposits are classified as “average” by the TOC content (less than 1%) of source rocks.
For a reliable evaluation of source rock generation potential, it should be considered that during the HCs generation and catagenesis those rocks lose a part of their initial TOC content. And the more differences between the contemporary and initial TOC values, the greater the maturity of the source rock. The total organic carbon can be conditionally divided into two parts – capable to conversion into the HCs and the part that does not generate the HCs.
Initial values of the following geochemical parameters are used to characterize the oil source formations: Corg – percentage content of organic carbon in sedimentary rocks; HI (hydrogen index) – ratio of the number of generated HCs (peak S2 on the chart of Rock-Eval pyrolysis) to TOC; Type of the OM – the type of kerogen is mainly determined by chemical and coal petrology characteristics of kerogen.
Due to the catagenetic consumption of OMs for the formation of hydrocarbons (liquid and gas) and non-hydrocarbon products (water, gases – CO2, H2S, N, etc.), a reduction in the mass of OMs in catagenesis occurs, and at each stage of OM transformation we are dealing with the residual concentrations. To restore the initial values of TOC by the beginning of catagenesis, i.e. by the beginning of HCs generation, we recommend using the conversion factors that take into account the type and concentration of the substance, as well as catagenesis gradations, reached by the oil source rock deposits.
They are based on the material balance calculations, the concept of which is described in the writings of S.G. Neruchev et al.9-10. The concentration
of TOCinit. is calculated by the following formula: TOCinit. = TOCred. · C
init.g/Cred.g · Wred.,
where TOCinit. – the initial TOC content in the rock before the catagenesis, TOCred. – analytically
determined TOC content in the rock, Cinit.g – carbon
content in the initial OM (kerogen), Cred.g – carbon
content in the residual OM (kerogen), Wred. – residual weight.
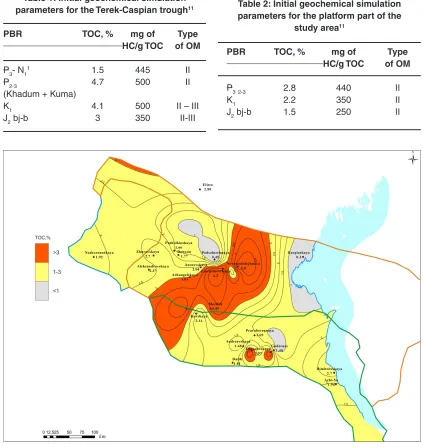
Taking into account the type of OM and catagenesis to recalculate TOC of the Jurassic PBRs, the conversion factors 2.66 and 3.16 have been used within the Terek-Sunzha zone and the platform part of section, respectively; for the Cretaceous PBRs, Khadum-Batalpashinsk PBRs within the platform part – 1.43-2.32; within the Terek-Caspian trough – 2.6611.
The results of the studies
Table 1: Initial geochemical simulation
parameters for the Terek-Caspian trough11
PBR TOC, % mg of Type
HC/g TOC of OM
P3- N11 1.5 445 II
P2-3 4.7 500 II
(Khadum + Kuma)
K1 4.1 500 II – III
J2 bj-b 3 350 II-III
Table 2: Initial geochemical simulation parameters for the platform part of the
study area11
PBR TOC, % mg of Type
HC/g TOC of OM
P32-3 2.8 440 II
K1 2.2 350 II
J2 bj-b 1.5 250 II
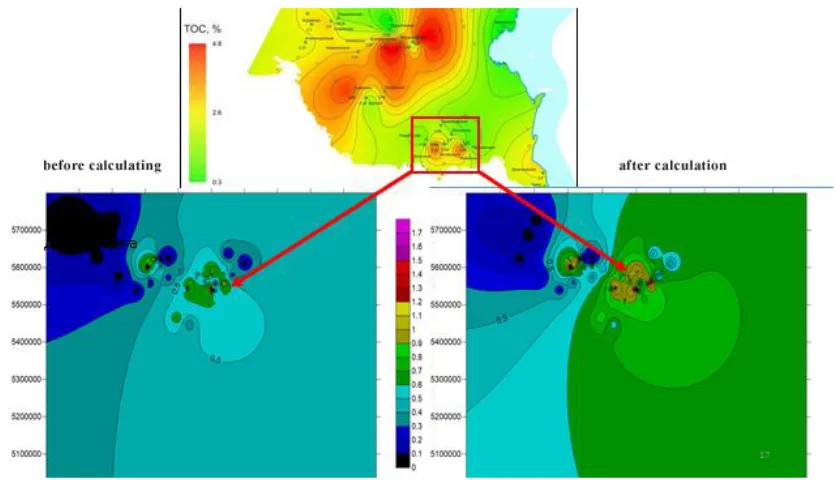
Fig. 1: Classification plan according to the TOC content in Khadum deposits, Central and East Ciscaucasia region
concentration of OM in Bathian-Bajocian clays is 2.7-3.12% (the mean value is 2.9%), in the Aptian-Albian deposits – 3.9 to 4.4% (the mean value is 4.15%), in the deposits of the Khadum suite – 3-5.5% (the mean value is 4.7%). To restore the initial values of HI, we have used the charts of kerogen evolution during the catagenesis (with HI-Tmax parameters) depending on the type of the organofacies of OM.
Fig. 2: Recalculation of geochemical parameters of the Khadum suite: A) hydrogen index values; B) TOC values.
Fig. 3: Maps of TOC content before and after the recalculation of initial TOC values in the Khadum deposits
PBRs were 250-350 mg of HC/g TOC, Aptian-Albian – 300 to 500 mg HC/g TOC, Maikop formations – up to 450 mg of HC/g TOC.
The initial values of geochemical parameters for the main oil source formations are shown in Tables 1 and 2.
geochemical properties, depending on the relative maturity of specimen. The line, corresponding to the immature specimens (0%), TOC and HI values have remained unchanged. The line corresponds to the maximum mature samples (100%), where the effect of recalculation is the highest.
Based on the results of source rock initial state recovery, we have made a map of the initial content of TOC % (Fig. 3). Due to that, the average hydrocarbon potential has increased 1.5-2 times. The similar calculations were made for the wells of the Terek-Caspian trough, as there is a complete set of essential geochemical information about them.
dISCUSSION
Typically, the different types of kerogen have different generation ability. The first type is able to be almost completely recycled into HC in the catagenesis process, while the third type of kerogen, on the contrary, for the most part consists of not generating parts and gives a little HC. If we compare the source rocks, represented by different types of kerogen but with the same initial TOC content at the time of the maximum maturity, we can see that the kerogen which generated the largest number of HC is most weakly expressed in the TOC value, because of what its significance might be underestimated. As a result of transformation, the kerogen, capable of generating the heaviest hydrocarbons, has the lowest current TOC value. And vice versa, the kerogen which formed the least amount of hydrocarbons is presented in the modern composition by the highest values of TOC. By identifying the type of kerogen, it is possible to assume how many TOC will be converted into HCs: type I – up to 80%, type II – up to 50% and type III – up to 20.
The conversion factor, taking into account the type of kerogen, thermal maturity of OMs in the oil/gas source rock and chemical elements presented in the kerogen. The conversion factor was introduced in the work [16]. Usually, the adopted mean statistical value of the conversion factor equal to 1.2-1.4 is used.
The hydrogen index (HI) received as a result of pyrolytic analysis by the Rock-Eval method, allows to evaluate the generating features of kerogen,
expressed in mg HC/g TOC. Thus, the analysis of HI° for the unconventional reservoirs of shale gas in the USA, on average are estimated at 533 mg HC/g TOC17. In the shales of marine origin, the HI° values
are varied: in 90% of the studied shale – over 340 mg HC/g TOC, in 50% – more than 475 mg HC/g TOC, and only 10% have exceeded 645 mg HC/g TOC.
Assuming that the source rocks generate hydrocarbons, which constitute about 85% of the carbon, the maximum HI can be estimated by the inverse relation 1/0.085, or 1177 mg HC/g TOC. Using 1177 mg HC/g TOC as the maximum HI, it is possible to calculate the percentage of generating organic carbon from the initial hydrogen index: HI0/1177. For example, if HI of the shale formation Barnett is estimated as 434 mg HC/g TOC17, then by
means of division by 1177 mg HC/g TOC we obtain organic carbon value in immature shales, that is, 37% of the TOC may be converted into oil. Thus, for a simplified calculation of percentage content of the
generating organic carbon (GOC), depending on the
values of initial hydrogen index, taking the maximum possible hydrogen index equal to 1177, Jarvie17.
The content of generated organic carbon and TOC provides the key to understanding the HC generation and OM changes development. If the HI is known, the percentage of generating organic carbon can be easily determined by dividing HI by 1177. The generation factor is inversely related to the hydrogen index, it decreases with the growth of the latter. There is no doubt that the ratio of HI and the generation factor depends on the purity of experiment, conditions laid down in the experiments carried out, and the use of different types of pyrolysis tests: Rock-Eval or Hydrous pyrolysis18.
CONCLUSION
the source rock, hydrogen index, degree of OM transformation and value S1, one can calculate the initial values of TOC and HI. The total organic carbon can be conditionally divided into two parts – capable to convert into the HCs and the part that does not generate the HCs. For a simplified calculation of percentage content of the generating organic carbon
(GOC), depending on the values of initial hydrogen
index, one should take into account the conversion factor, type of kerogen, thermal maturity of OMs in the oil/gas source rock and chemical elements presented in the kerogen. According to the result of the calculations made, it was determined that the
original concentration of OM in Bathian-Bajocian clays is 2.7-3.12% (the mean value is 2.9%), in the Aptian-Albian deposits – 3.9 to 4.4% (the mean value is 4.15%), in the deposits of the Khadum suite – 3-5.5% (the mean value is 4.7%). Due to that, the average hydrocarbon potential was increased 1.5-2 times. Based on the results of initial source rock state recovery, we have made a map of initial organic carbon content that allows to give a reliable estimate of generation potential for the source rocks of the Khadum suite, and to determine the perspectives of hydrocarbon accumulations exploration in the low-permeability shale formations of Ciscaucasia.
REFERENCES
1. Anan’ev, V.V.; Smelkov, V.M.; Pronin, N.V. Oil
and gas geology, 2007, 1, 32-38.
2. Bazhenov, O. K.; Fadeev, N.P. GEOS, 2005,
54-58.
3. Kerimov, V.Yu.; Mustaev, R.N.; Dmitrievskiy, S.S.; Yandarbieva, N.Sh.; Kozlova, E.V.
Neftyanoe khozyaystvo, 2015, 10, 50-53.
4. Kerimov, V.Yu.; Shilov, G.Ya.; Mustaev, R.N.; Dmitrievskiy, S.S. Neftyanoe khozyaystvo,
2016, 2, 8-11.
5. Kerimov, V.Yu.; Mustaev, R.N.; Senin, B.V.; Lavrenova, E.A. Neftyanoe khozyaystvo,
2015, 4, 26-29.
6. Kerimov, V. Yu.; Mustaev, R. N.; Serikova, U. S.; Lavrenova, E.A.; Kruglyakova, M. V.
Neftyanoe khozyaystvo, 2015, 3, 56-60.
7. Kerimov, V.Yu.; Lavrenova, E.A.; Mustaev, R.N.; Serikova, U. S. Neftyanoe khozyaystvo,
2015, 1, 5-17.
8. Morariu, D.; Aver’yanova, O.Yu. Neftegazovaya
geologiya. Teoriya i praktika, 2013, 8(1), 22.
9. Prishchepa, O.M.; Averyanov, O.Yu.; Ilyinskiy, A.A.; Morariu, D. FSUE “VNIGRI”, 2014.
10. Abrams, M.A.; Apanel, A.M.; Timoshenko, O.M.; Kosenkova, N.N. AAPG Bulletin, 1999,
83(4), 553-577.
11. Pelet, R. Rev. d’Institut Francais du Pétrole,
1985, 40(5), 551-56.
12. Yandarbiyev, N.S.; Kozlova, E.V.; Mustaev, R.; Odintsova, K.Y. In Geomodel 2015 –
17th Scientific-Practical Conference on Oil and Gas Geological Exploration and Development, 2015.
13. Kerimov, V.Y.; Osipov, A.V.; Mustaev, R.N.; Monakova, A.S. 16th Science and Applied
Research Conference on Oil and Gas Geological Exploration and Development, GEOMODEL, 2014.
14. Kerimov, V.Yu.; Serikova, U.S.; Mustayev, R.N.; Guliyev, I.S. Neftyanoe Khozyaystvo -
Oil Industry, 2014, 5, 50-54.
15. Guliev, I.S.; Kerimov, V.Yu.; Mustaev, R.N.
Doklady Earth Sciences, 2016, 471(1),
168–171.
16. Tissot, B.P.; Welte, D.H. Springer, 1984.
17. Jarvie, M.D. AAPG Memoir, 2012a, 97,
69–87.
18. Lewan, M.D. Comparison of oil generation