www.nat-hazards-earth-syst-sci.net/15/2313/2015/ doi:10.5194/nhess-15-2313-2015
© Author(s) 2015. CC Attribution 3.0 License.
Changes in the occurrence of rainfall-induced landslides in
Calabria, southern Italy, in the 20th century
S. L. Gariano1,2, O. Petrucci3, and F. Guzzetti1
1CNR IRPI, via della Madonna Alta 126, 06128, Perugia, Italy
2University of Perugia, Department of Physics and Geology, via A. Pascoli, 06123, Perugia, Italy 3CNR IRPI, via Cavour 6, 87036, Rende (CS), Italy
Correspondence to: S. L. Gariano (gariano@irpi.cnr.it)
Received: 5 May 2015 – Published in Nat. Hazards Earth Syst. Sci. Discuss.: 4 June 2015 Accepted: 5 October 2015 – Published: 13 October 2015
Abstract. Only a few studies have investigated the geograph-ical and temporal variations in the frequency and distribution of rainfall-induced landslides, and the consequences of the variations on landslide risk. Lack of information limits the possibility to evaluate the impact of environmental and cli-mate changes on landslide frequency and risk. Here, we ex-ploit detailed historical information on landslides and rainfall in Calabria, southern Italy, between 1921 and 2010 to study the temporal and the geographical variation in the occurrence of rainfall-induced landslides and in their impact on the pop-ulation. We exploit a catalogue with information on histori-cal landslides from June 1920 to December 2010, and daily rainfall records obtained by a network of 318 rain gauges in the same period, to reconstruct 448 493 rainfall events (RE). Combining the rainfall and the landslide information, we obtain a catalogue of 1466 rainfall events with landslides (REL), where an REL is the occurrence of one or more land-slide during or immediately after a rainfall event. We find that (i) the geographical and the temporal distributions of the rainfall-induced landslides have changed in the observation period, (ii) the monthly distribution of the REL has changed in the observation period, and (iii) the average and maximum cumulated event rainfall that have resulted in landslides in the recent 30-year period 1981–2010 are lower than the rainfall necessary to trigger landslides in previous periods, whereas the duration of the RE that triggered landslides has remained the same. We attribute the changes to variations in the rainfall conditions and to an increased vulnerability of the territory. To investigate the variations in the impact of REL on the pop-ulation, we compared the number of REL in each of the 409 municipalities in Calabria with the size of the population in
the municipalities measured by national Censuses conducted in 1951, 1981, and 2011. We adopted two strategies; the first strategy considered impact asIREL=#REL/ P, and the sec-ond strategy measured impact asRREL=#REL×P, where #REL is the total number of REL in a period, andP is the size of the population in the same period and geographical area. The analysis has revealed a complex pattern of changes in the impact of rainfall-induced landslides in Calabria in the recent past, with areas whereIRELandRRELhave increased, and other areas where they have decreased. Municipalities whereIREL has increased are mainly in the mountains, and municipalities whereRREL has increased are mainly along the coasts. The complexity of the changes in the frequency and impact of rainfall-induced landslides observed in Cal-abria suggests that it remains difficult and uncertain to pre-dict the possible variations in the frequency and impact of landslide in response to future climatic and environmental changes.
1 Introduction
in-creases to 1531 (19 %) if evacuees and homeless people are considered. In Calabria, 46 of the 409 municipalities (11 %) have experienced landslides with casualties in the period 1950–2013. Considering evacuees and homeless, the figure increases to 150 municipalities (37 %).
Rainfall is the primary trigger of landslides in Italy (Guzzetti et al., 1994; Trigila et al., 2010). To model the rela-tionship between rainfall and landslide occurrence, a stan-dard approach consists in the joint analysis of landslides and rainfall records to determine empirical rainfall thresholds for possible landslide occurrence (Reichenbach et al., 1998; Guzzetti et al., 2007, 2008). The approach assumes a sta-tionary (in time) relationship to link landslide occurrence to rainfall measurements (Reichenbach et al., 1998; Guzzetti et al., 2007). However, rainfall conditions that have resulted in landslides in the past may change over long periods, or may vary in the future due to environmental and climatic changes, including changes in rainfall intensity and frequency, and in the pattern of the meteorological triggering events. Variations in the frequency and intensity of the rainfall events will affect the frequency of rainfall-induced landslides (Crozier, 2010). An increase in the frequency and the intensity of extreme rainfall events was observed in several geographical regions in the world (IPCC, 2013), including Italy (Brunetti et al., 2002). Temporal variations in the rainfall conditions that re-sult in landslides can jeopardise the definition and the appli-cation of empirical rainfall thresholds for the prediction of landslide occurrence (Guzzetti et al., 2007, 2008).
Only a few studies have investigated the geographical and temporal variations in the frequency and distribution of rainfall-induced landslides (e.g., Reichenbach et al., 1998; Mathie et al., 2007; Polemio and Petrucci, 2010; Chiang and Chang, 2011; Lollino et al., 2014; Stoffel et al., 2014), and the consequences of the variations on landslide risk (Guzzetti et al., 2005b; Salvati et al., 2010). Lack of information limits the possibility to evaluate the impact of the expected environ-mental and climate changes on landslide frequency, and the related risk. In an effort to fill this gap, we exploit detailed historical information on landslides and rainfall in Calabria, southern Italy, in the 90-year period 1921–2010 to study the temporal and the geographical variations in the occurrence of rainfall-induced landslides and in their impact on the pop-ulation, and we investigate some of the natural (i.e., rainfall) and human (i.e., population density) causes of the changes.
2 Background
In the literature, the analysis of the effects of climatic and environmental changes on landslide activity is performed using modelling or empirical approaches (Crozier, 2010). The modelling approach investigates variations in the sta-bility/instability conditions of single landslides driven by records of rainfall and/or pore pressure measurements, and attempts to predict variations in the stability/instability
con-ditions of slopes using synthetic, future rainfall records ob-tained from downscaled global climate models (Buma and Dehn, 1998, 2000; Dehn and Buma, 1999; Dehn et al., 2000; Comegna et al. 2013; Rianna et al., 2014). The empirical ap-proach exploits records of landslide occurrences to determine variations in the activity or the frequency of the landslides, and can be separated in two groups depending on the pe-riod covered and the tools used to construct the records of the landslide occurrences. An approach exploits palaeoen-vironmental evidences to construct landslide records and to analyse periods of increased/decreased landslide activ-ity. Adopting this approach and exploiting14C dating tech-niques, Bertolini (2007) obtained a catalogue of 20 land-slide events in the Emilia-Romagna region, northern Italy, in the last 10 000. Similarly, Borgatti and Soldati (2010) (using stratigraphic methods and14C dating techniques) dated land-slides of different types in the Italian Dolomites in the late-glacial–Holocene transition period, and attributed the cluster of the landslides to increased permafrost melting.
Another approach consists in the comparison of catalogues of historical landslide occurrences to records of river dis-charge or rainfall measurements. Reichenbach et al. (1998) used a catalogue of historical landslide and flood events in the Tiber River basin, Italy, and records of mean daily dis-charge at different gauging stations in the same catchment between 1918 and 1990, to determine regional hydrologi-cal thresholds for landslide and flood occurrence. Stoffel et al. (2014) analysed changes in the frequency and seasonal distribution of shallow landslides in Piedmont, NW Italy, from 1960 to 2011, and identified two periods of increased landslide frequency that they attributed to an increase in the mean annual temperature. Polemio and Petrucci (2010) stud-ied monthly rainfall (and temperature) records in Calabria from 1921 to 2006, and determined that landslide occurrence did not decrease in the region in their observation period, de-spite a decrease in the monthly total rainfall.
A difficulty in the application of the empirical historical approach lays in the availability of accurate records of his-torical landslide events. In many areas, accurate and suffi-ciently complete records of rainfall measurements are avail-able for long (multi-decadal) periods. However, landslide records are not commonly available for comparatively long periods (Guzzetti, 2000; Guzzetti et al., 2005b). Further, the completeness and quality of the landslide records varies with time (Petrucci and Pasqua, 2008; Petrucci and Gullà, 2010), depending on the abundance and type of the historical and recent sources, and the skill of the investigators (Lang et al., 1999; Guzzetti et al., 1994, 2005a).
A limited number of global catalogues lists informa-tion on landslides and floods, including (i) the Emergency
Events Database (EM-DAT) maintained by the Centre for
Research on the Epidemiology of Disasters of the Université Catholique de Louvain, (ii) the Natural Hazards Assessment
Network (NATHAN) prepared by Munich Re, and (iii) the
Na-tional Aeronautic and Space Administration (NASA), which lists information on rainfall-triggered landslides since 2007 (Kirschbaum, 2014). These catalogues focus on major catas-trophic events, and the number of the listed landslides is known to be underestimated, largely (Llasat et al., 2013a, b). In Italy, abundant information exists on historical land-slides. An inventory of historical landslides was first pre-pared in the framework of the AVI – Aree Vulnerate Italiane (an acronym for Areas Affected by Landslides or Floods) national project to cover the period 1917–1990 (Guzzetti et al., 1994), and was next updated to cover the period 1900– 2002 (Guzzetti and Tonelli, 2004). Guzzetti (2000) prepared a catalogue of historical landslides with direct human conse-quences from 1279 to 1999. The catalogue was revised and extended by Salvati et al. (2003, 2010) and by Guzzetti et al. (2005a, b). Recently, Brunetti et al. (2015) compiled a catalogue of 1981 rainfall events that have resulted in at least 2408 shallow landslides in Italy in the period 1996–2012. In addition, a number of regional and local catalogues of landslide events exists in Italy, including catalogues for e.g., the Emilia-Romagna (Emilia-Romagna SGSS, 2015), Um-bria (Salvati et al., 2006), and CalaUm-bria (Petrucci and Ver-sace, 2005, 2007; Petrucci et al., 2009; Palmieri et al., 2011) regions.
3 Method
We base our analysis of the possible variations in the rainfall-induced landslides in Calabria on two sources of informa-tion collected in the region, including: (i) a database of daily rainfall measurements, and (ii) a record of occurrences of rainfall-induced landslides. Both sources cover the 90-year period 1921–2010. Our approach relies on the construction and analysis of three catalogues: (i) a catalogue of landslide events, (ii) a catalogue of rainfall events, and (iii) a catalogue of rainfall events with landslides.
We first define a landslide event (LE) as the occurrence of one or more landslides in a given municipality and in a given date (day, month, year). In the literature, no clear definition exists for a rainfall event (RE), and no common criteria exist to single out RE from rainfall records (Melillo et al., 2015). In this work, we define a rainfall event (RE) as a continu-ous sequence of rainy days (i.e., days with cumulated daily rainfall > 0 mm) preceded and followed by at least 1 dry day (i.e., a day with no measured rainfall, Gullà et al., 2012). We further define a rainfall event with landslides (REL) as the occurrence of a LE during or immediately after an RE. To single out the individual REL, we use two criteria. First, the geographical distance between the LE and the location of the rain gauge where the event is determined shall be < 5 km. Where two or more rain gauges meet this criterion, we select the rain gauge closest to the landslide. Second, the date of the LE must be between the start and the end dates of the RE, or no more than 1 day after the end of the RE. The starting
date of the REL corresponds to the start date of the RE. The end date of REL is (i) the day when the rainfall-induced land-slide occurred (if the landland-slide occurred between the start and the end dates of the RE) or (ii) the end date of the RE (if the landslide occurred in the day following the end day of the RE).
Our analysis also relays on the definition of empirical rain-fall thresholds for possible landslide occurrence in Calabria. To define the rainfall thresholds we adopt the method pro-posed by Brunetti et al. (2010) and modified by Peruccacci et al. (2012), where the threshold curve is a power law relation-ship linking the rainfall durationD to the cumulated event rainfallE=(α±1α)·D(γ±1γ ),αis a scale parameter that defines the intercept of the power law threshold model,γ is the shape parameter that defines the slope of the power law model, and1αand1γ represent the uncertainties ofαand γ, respectively. The method allows defining thresholds for different exceedance probabilities. For our analysis, we de-fine 5 % thresholds (T5)i.e., threshold lines that leave 5 % of the (D,E)empirical points below the threshold.
4 Study area
Our study area is Calabria, a region in southern Italy that extends for 15 080 km2 (Fig. 1a) and comprises 409 mu-nicipalities ranging in size from 2.4 to 292.0 km2 (average 38.4 km2). Elevation in the region ranges from sea level to 2260 m a.s.l., and morphology is shaped by a tectonic up-lift initiated in the Quaternary and that remains active. Al-lochthonous crystalline rocks, Palaeozoic to Jurassic in age, stacked over carbonate units in the middle Miocene, repre-sent the backbone of the region, with Neogene flysch fill-ing tectonic depressions (Tortorici, 1982; Monaco and Tor-torici, 2000). Mean annual rainfall averages 1150 mm in the region, with the Ionian (E) side of the region less rainy than the Tyrrhenian (W) side (Terranova, 2004) (Fig. 1b). An-nual rainfall depends strictly on elevation, with the moun-tains significantly wetter (> 1400 mm) than the coastal plains (< 1000 mm). About 70 % of the annual rain falls from Octo-ber to March, and 10 % in the summer. Rainfall events with large cumulated rainfall occur mainly between November and January, whereas high intensity events are most common in September and October (Terranova and Gariano, 2014).
the region, and attributed the decrease to a negative trend in the monthly rainfall in the autumn–winter period, whereas in the summer the tendency is toward an increase of the cumu-lated rainfall.
5 Description of the catalogues 5.1 Catalogue of landslide events
To compile the catalogue of landslide events (LE) we used different sources of information, including local and na-tional newspapers, web sites, reports from nana-tional and re-gional agencies and public offices, and post-event field sur-veys (Petrucci and Versace, 2005, 2007; Petrucci et al., 2009; Palmieri et al., 2011). Each record in the LE catalogue lists: (a) a LE identification number, (b) the date (and time when available) of occurrence of the landslide(s), (c) the geograph-ical location of the landslide(s), (d) a short description of the landslide(s), (e) an indication of whether a “single” or “mul-tiple” (two or more) landslides were reported, and (f) qual-itative information on the size (“small” or “large) of the re-ported landslide(s).
Overall, the catalogue lists information on 7600 LE from June 1920 to December 2010 (on average 84 LE per year, 7 LE per month). Not all the records in the catalogue contain all the information. Information on the geographical location of the landslide(s) consists in the geographical coordinates of the site(s) where the landslide(s) has (have) occurred (avail-able for 23 % of the LE), or in the geographical coordinates of the centroid of the municipality where the landslide(s) was (were) reported (available for 77 % of the LE).
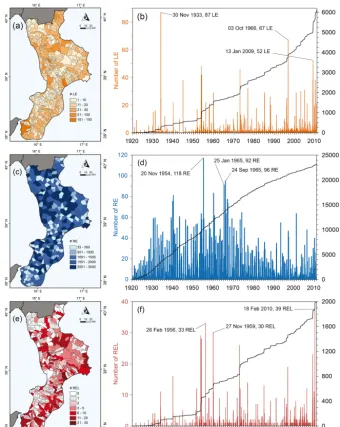
Figure 2a shows the number of LE in each of the 409 municipalities in Calabria. The average number of LE per municipality is 17, with 146 municipalities with less than 10 LE, and three municipalities (Torre di Ruggiero, Sim-bario, Spadola) with only one LE. Four municipalities ex-perienced more than 100 LE, including Catanzaro (142 LE), Cosenza (120), Reggio Calabria (117), and Scilla (104). We note that the municipalities of Reggio Calabria, Catanzaro and Cosenza (Fig. 1a) host the three largest and most pop-ulated cities in the region. The two adjoining municipalities of Scilla and Bagnara Calabra, along the SW coast of the region, together were affected by 190 LE, most of which oc-curred along the SS18 national road and the national railway connecting southern Calabria to Central Italy (Diodato et al., 2011; Petrucci and Pasqua, 2013; Iovine et al., 2014).
Figure 2b portrays the temporal distribution of the LE. The average number of LE per year is 67. For 15 years in the catalogue, less than 10 LE were recorded. We consider these years as characterised by low landslide impact. For 17 years in the catalogue, 100 or more LE were recorded. We consider these years as years with a high landslide impact, includ-ing 2009 (492 LE) and 2010 (499). The 3 sinclud-ingle days with the largest number of reported LE were 30 November 1933
Figure 2. (a) Number of landslide events (LE) in each municipality in Calabria in the 90-year period 1921–2010. (b) Temporal distribution of LE (orange bars), and cumulated number of LE (black line) in the period 1921–2010. The 3 single days with the largest number of LE are shown. (c) Number of rainfall events (RE) reconstructed for each rain gauge in the period 1921–2010. Reference area for each rain gauge is shown using Thiessen polygons. (d) Temporal distribution of reconstructed RE (blue bars), and cumulated number of RE (black line) in the period 1921–2010. The 3 single days with the largest number of RE are shown. (e) Number of rainfall events (REL) in each municipality in the period 1921–2010. (f) Temporal distribution of REL (red bars), and cumulated number of REL (black line). The 3 single days with the largest number of REL are shown.
(87 LE), 3 October 1996 (67), and 13 January 2009 (52). The cumulated number of LE (black line in Fig. 2b) measures the completeness of the historical catalogue (Guzzetti, 2000; Wood et al., 2015). In the early period 1910–1950, the cu-mulated curve exhibits a slope lower than in the later period 1950–2010. We interpret this as an indication that the cata-logue is more complete in the recent part (after 1950) and less complete in the older part of the series.
5.2 Catalogue of rainfall events
mid-1920s to 2010, at least 150 rain gauges were operational ev-ery year. The largest number of rain gauges (> 200) was avail-able in the 1930s, and between 1950 and 1975, whereas a minimum number of gauges was available in the early 1940s, during the Second World War. A decrease in the number of the available rain gauges was observed in the most recent years (from 2000), and is due to the replacement of old rain gauges with new, automatic gauges, many of which were lo-cated in places different from the old gauges.
We adopted strategies to consider and mitigate the ef-fects of the heterogeneity inherent to the rainfall measure-ments. We obtained the database of rainfall measurements used in the study from the “Centro Funzionale Multirischi” of the Environmental Protection Agency of Calabria (http: //www.cfd.calabria.it/) that distributes the data after valida-tion. This contributes to reduce heterogeneity. In a study of climate variation in Calabria between 1916 and 2006, Brunetti et al. (2012) analysed 173 rain gauges from the same rainfall database, and found that the rainfall records were homogeneous for 87 rain gauges (50 %) and required ho-mogenization for 42 rain gauges (24 %). The other 44 rain gauges (26 %) were discarded for the climatic research. Our work is based on daily measurements or short sequences of daily measurements. We therefore expect that the number of rain gauges characterised by homogeneous records is larger. Also, the “gap filling” procedures used to homogenise the rainfall records for climatic research (Brunetti et al., 2012) may not work effectively for short-duration, intense and lo-calised rainfall events. Different rain gauge stations may have different measurement accuracies, affecting the mini-mum measured rainfall, a possible cause of heterogeneity. We note that all the rain gauges used in our study have the same nominal accuracy (0.2 mm). This contributes to reduce heterogeneity. To mitigate further the effects of heterogene-ity caused by the use of different measuring instruments at the same location, we excluded from the analyses the mea-surements obtained by the new automatic gauges. Where new gauges replaced old gauges the historical rainfall record was interrupted, and we used only the part of the record obtained by the old gauges.
Exploiting the rainfall information available to us, and adopting the approach proposed by Gullà et al. (2012), we reconstructed 448 493 rainfall events (RE) in the 90-year ob-servation period. This is an average of about 4893 RE per year, with a maximum of 7760 (1.7 %) RE in 1964. For each RE we determined (a) the start and the end date of the event, (b) the rain gauge where the RE was detected (with an event referred to a single rain gauge), (c) the event duration (D, in days), and (d) the cumulated event rainfall (E, in mm). Of all the reconstructed events, 231 200 (47.5 %) have cumulated event rainfallE≥10 mm, and 23 146 (5.2 %)E≥100 mm. For the latter events, the average rainfall duration D is 7 days (mode 5 days, median 6 days), with a minimum of 1 day and a maximum of 131 days (4.4 months). The
aver-age cumulated event rainfallEis 169 mm, with a maximum E=1650 mm, for a rainfall durationD=61 days.
Figure 2c shows the number of RE per rain gauge. A refer-ence area based on Thiessen polygons was assigned to each rain gauge. The average number of RE per rain gauge is 1240, with a maximum of 2822 RE for the Catanzaro rain gauge. For 84 rain gauges, located mainly in the N part of the region, more than 2000 RE were reconstructed. Figure 2d shows the number of severe RE (E≥100 mm) per year. On average, 254 severe RE were reconstructed every year, with a maximum of 604 severe RE in 1954, and a minimum of 67 severe RE in 1991. Inspection of the cumulated number of RE (black curve in Fig. 2d) reveals a constant rate from the beginning of the record (1920) the end of the 1990s. We attribute the gentle decrease in the frequency of the RE in the last decade to the reduction in the number of the rain gauges (Fig. 1c). However, lack of significant changes in the rate of the RE, measured by the local slope of the cumulative curve, suggests a uniform reconstruction of the RE, in the consid-ered period.
Figure 3a shows the number of severe RE per year in the 90-year observation period. The average value per year is 28, and was exceeded 43 times, of which 15 times in the 1921– 1950 period, 18 times in the 1951–1980 period, and 10 times in the 1981–2010 period. The 1951–1980 period was char-acterised by the largest average number of severe RE per year (318). The maximum number of severe RE (609) was recorded in 1954, and the minimum (79) in 1922. In six years (1930, 1933, 1940, 1954, 1973, 1996) the number of recon-structed severe RE was larger than 500.
5.3 Catalogue of rainfall events with landslides
Table 1. Summary statistics for rainfall events with landslides (REL) in Calabria for the entire catalogue, and for different periods and landslide subsets. Legend: #REL, number of rainfall events with landslides;D, duration of a rainfall event (in days);E, cumulated event rainfall (in mm).
Data set #REL D(days) E(mm)
min mean max min mean max
Entire catalogue 1466 1 7 32 10.0 202.3 1504.7
Single landslides 534 1 7 32 10.0 182.6 977.1
Multiple landslides 932 1 7 24 10.0 213.6 1504.7
Small landslides 610 1 7 28 10.0 185.2 977.1
Large landslides 314 1 8 32 10.9 200.0 1216.2
Winter 728 1 8 32 10.0 178.5 914.5
Spring 84 1 5 19 10.0 127.1 483.2
Summer 32 1 3 5 10.6 171.5 443
Autumn 622 1 6 28 11.0 241.9 1504.7
Wet period 1159 1 7 32 10.0 187.0 1216.2
Dry period 307 1 5 19 10.0 259.9 1504.7
1921–1950 143 1 7 28 11.1 232.1 1216.2
1951–1980 720 1 7 24 10.0 225.7 1504.7
1981–2010 603 1 7 32 10.0 167.2 914.5
Figure 3. (a) Number of rainfall events (RE) and (b) number of rainfall events with landslides (REL) per year in Calabria in the year period 1921–2010. Solid lines show average values for the 90-year period. Dashed lines show average values for the three 30-90-year periods 1921–1950, 1951–1980, and 1981–2010.
the analysis less significant events. The remaining 1466 RE with landslides have durations in the range 1 <D< 32 days (average 7 days), and cumulated event rainfall in the range 10.0 <E< 1504.7 mm (average 202.3 mm) (Table 1).
Figure 2e shows the number of REL per municipality. The average number of REL in a municipality is four, the min-imum is zero (95 municipalities, located chiefly in the N part of the region and along the SW coast), and the max-imum is 47, in the Catanzaro municipality (Fig. 2e). More than 30 municipalities experienced 10 or more REL in the investigated period. Figure 2f portrays the number of REL per year. On average, 16 REL occurred every year with a maximum of 139 REL in 1973. The 3 days with the largest number of REL were 18 February 2010 (39 REL), 29 Febru-ary 1956 (33), and 27 November 1959 (30). The month with the largest number of REL was January (337), followed by November (255), and February (254). The decades with the largest number of REL were those between 1950 and 1959, between 1970 and 1979, and between 2000 and 2009. In-spection of the cumulated number of REL (black curve in Fig. 2f) reveals that in the early period 1910–1950, the rate of the REL is lower than in the later period 1950–2010. This is a result of the different completeness of the information of the LE (Fig. 2b).
Figure 4. Maps show the number of rainfall events with land-slides (#REL) per municipality in Calabria in the (a) Autumn (22 September–20 December), (b) Winter (21 December–20 March), (c) Spring (21 March–20 June), and (d) Summer (21 June–21 September). Pie charts show number and percentage of municipali-ties in each seasonal class.
6 Analysis of rainfall events with landslides
Our catalogue lists 1466 severe REL in Calabria from Octo-ber 1921 to DecemOcto-ber 2010, of which 534 (36.4 %) have trig-gered “single” landslides and 932 (63.6 %) “multiple” land-slides. We acknowledge uncertainty in the classification of an REL as having triggered a “single” landslide. Indeed, a “single” landslide REL may have triggered multiple land-slides and the information may not be available to us. Con-versely, REL with “multiple” landslides are certain, because they have triggered two or more landslides. We note that REL with “single” landslides have average and maximum cumulated event rainfallElower than REL with “multiple” landslides (Table 1). Even considering the uncertainty in the classification of REL associated to “single” landslides, the finding was expected because some of the REL with “multi-ple” landslides have triggered several or many landslides, as a result of severe rainfall conditions. For 924 REL (63.0 %), qualitative information exists on the size of the landslides,
Figure 5. Top: Maps show the number of rainfall events with land-slides (#REL) per municipality in Calabria in (a) the dry period (April to October) and (b) in the wet period (November to March). Pie charts show number and percentage of municipalities in each class. Bottom: Bar charts show temporal distribution of REL in the (c) dry and in the (d) wet periods.
with 610 REL (41.6 %) that have resulted in “small” slides, and 314 REL (21.4 %) that have caused “large” slides. As expected, REL that have resulted in “small” land-slides have (on average)DandEvalues lower than REL that have caused “large” landslides (Table 1).
We investigated the spatial and temporal distributions of the REL listed in our catalogue, and their temporal variations. For the purpose, we segmented the catalogue considering (i) the four seasons, (ii) two seasonal periods (i.e., “dry” and “wet” period proposed by Vennari et al., 2014), and (iii) three consecutive, non-overlapping 30-year periods (1921–1950, 1951–1980, 1981–2010).
Figure 5 shows the geographical distribution of the to-tal number of REL in each municipality for the “dry” pe-riod from April to October (Fig. 5b) and the “wet” pepe-riod from November to March (Fig. 5a) adopted by Vennari et al. (2014) to determine seasonal rainfall thresholds for pos-sible landslide occurrence in Calabria. REL in the “dry” pe-riod (307, 20.9 %, Table 1) occurred mostly along the E (Io-nian) side of the region, whereas REL in the “wet” period (1159, 79.1 %) were distributed throughout the region, with longer rainfall duration Dand lower cumulated event rain-fallE. Figure 5c and d portray the temporal distribution of the REL in the “dry” and the “wet” periods. The temporal distribution of REL in the “wet” period is similar to the dis-tribution of all the REL (Fig. 2e), whereas in the “dry” period REL were most frequent in the 1950’s, and have decreased constantly since then.
Figure 6a, b and c show the number of REL per munici-pality in three periods: 1921–1950 (old period), 1951–1980 (intermediate period), and 1981–2010 (recent period). Of the 1466 REL in the catalogue, 143 REL (9.8 %) occurred in the old period, 720 (49.1 %) in the intermediate period, and 603 (41.1 %) in the recent period (Table 1). The spatial distribu-tions of the REL in the intermediate and the recent periods are similar, with a larger number of REL affecting the SE part of the region in the recent period. Figure 6d, e and f portray the monthly distributions of the REL in the three periods. In the old period (Fig. 6d) REL occurred between October and March, with the majority of the REL (51, 35.7 %) in Novem-ber. In the intermediate and the recent periods, the REL were also most abundant between October and March. In particu-lar, in the intermediate period 1951–1980, REL were equally distributed in the autumn (322, 44.7 %) and the winter (329, 45.7 %), with peaks in October (145, 20.1 %) and Novem-ber (170, 11.6 %, Fig. 6e). In the recent period, the majority of the REL (369, 61 %) occurred in winter, with a distinct peak in January (162 REL, 26.9 %) (Fig. 6f) and only 86 REL (14.3 %) in October and November. In the three considered periods, the REL exhibited similar ranges of rainfall dura-tion D, and different ranges of cumulated event rainfallE (Table 1), with the REL in the recent period exhibiting larger maximumD, and lower average and maximumE than the corresponding values for the REL in the previous periods.
7 Discussion
Using the three catalogues of landslide events (LE), of rain-fall events (RE), and of rainrain-fall events with landslides (REL) in Calabria in the 90-year period 1921–2010, we first in-vestigate the changes in the yearly distribution of rainfall events with landslides. This is followed by an analysis of the changes in the rainfall conditions that have resulted in land-slides in Calabria, measured by empirical rainfall thresholds for landslide occurrence. Lastly, we compare the variations in the number and distribution in time of landslide events with
the variations in the density of the population in each mu-nicipality in Calabria, to analyse variations in the landslide impact and risk to the population.
Three key aspects of our analyses need to be addressed. First, our catalogues consider only rainfall-induced land-slides that were noticed (and recorded) because they have caused damage to public or private properties, or to the pop-ulation. Thus, the catalogues, and particularly the landslide catalogue, are not complete. Second, an underestimation in the number of landslides in the old period of the series (1921–1950) is expected, due to the reduced availability of the sources of information. For this reason, we conduct our most relevant analyses comparing the intermediate (1951– 1980) and the recent (1981–2010) periods, which we con-sider equally complete for statistical purposes (Fig. 6). Third, the daily time scale of the rainfall series used for our analy-sis is not sufficient to determine rainfall thresholds for short duration (< 24 h) events. Thus, the thresholds defined in this work are not adequate for rainfall durations < 24 h, and can-not be used in landslide warning systems. However, we main-tain that the thresholds are adequate to analyse variations in the landslide rainfall triggering conditions in Calabria.
7.1 Changes in the yearly distribution of REL
Table 2. Average (mean) and maximum (max) values of cumulated event rainfallE(in mm) for rainfall events in the 90-year period 1921– 2010, and in three 30-year periods. The largest monthly values in each period are shown in bold.
Month 1921–2010 1921–1950 1951–1980 1981–2010
mean max mean max mean max mean max
January 170.7 999.9 169.3 985.8 168.1 758.9 174.7 999.9
February 160.8 959.5 155.5 753.9 163.2 959.5 163.6 771.8
March 164.5 1118.3 181.6 1118.3 149.3 806.1 162.7 656.2
April 145.2 1124.4 137.8 298.7 149.0 1124.4 148.9 355.7
May 148.6 811.8 138.5 351.2 142.6 452.6 164.6 811.8
June 163.9 813.0 136.5 331.0 143.2 741.2 212.1 813.0
July 163.7 403.4 134.2 314.8 133.8 266.7 223.0 403.4
August 130.3 257.4 133.6 255.9 121.8 239.7 135.4 257.4
September 165.4 748.4 159.8 470.5 143.0 425.0 193.3 748.4
October 170.2 1504.7 158.3 533.5 198.6 1504.7 153.7 528.6
November 174.6 872.0 169.8 734.0 194.2 872.0 159.7 477.4
December 175.0 1250.7 181.6 1216.2 174.8 1250.7 168.6 696.0
through the year changed significantly, outlining a variation in the distribution of REL in the three 30-year periods.
7.2 Changes in the rainfall thresholds
To ascertain whether the rainfall conditions for possible land-slide occurrence have changed in Calabria in the 90-year observation period, we defined cumulated event rainfall– rainfall duration (ED) thresholds for all the REL in the cat-alogue, and for different subsets. Table 3 lists the equations and the ranges of validity of the established 5 % ED thresh-olds. Except for the validity range, only minor differences exists in the parameters controlling the thresholds defined for the entire catalogue (T5,CAL), for rainfall conditions that have resulted in “single” (T5,SG)or “multiple” (T5,ML)landslides, and for rainfall conditions that have caused “small” (T5,SL) or “large” (T5,LG)landslides.
Inspection of Table 3 reveals that the T5,CAL,T5,SGand T5,MLthresholds have the same or very similar exponent (γ ) and intercept (α)of the power law models. Although the av-erage and the maximum cumulated event rainfallE respon-sible for “single” landslides are smaller than theEthat have resulted in “multiple” landslides, the rainfall amount required to trigger “single” or “multiple” landslides has remained the same in Calabria in the 90-year observation period. The same is true for the rainfall conditions that have resulted in “small” or “large” landslides (Table 3). However, rainfall events that have resulted in “small” landslides have maximum and aver-age rainfall durationDand cumulated event rainfallElower than the rainfall events that have resulted in large landslides (Table 1).
Considering the seasonal periods, the threshold defined for autumn (T5,AT,γ=0.82±0.04) is steeper than the threshold defined for winter (T5,WT,γ=0.74±0.04), and the threshold for the “wet” period (T5,WET,γ=0.75±0.03) is flatter than the threshold for the “dry” period(T5,DRY,γ=0.99±0.04). For the latter two thresholds the intercepts (α)are also differ-ent (Table 3). The number of the empirical data for the spring and the summer periods was not sufficient to determine reli-able thresholds (Vennari et al., 2014), and a comparison for the two seasons is not possible.
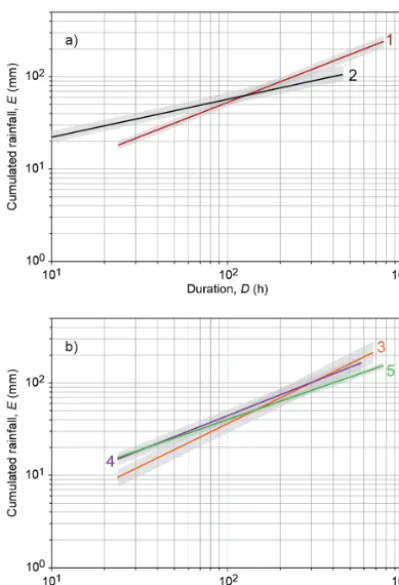
Figure 7a compares the ED threshold defined in this work for Calabria (T5,CAL)to the threshold defined by Vennari et al. (2014) (T5,VEN)for shallow landslides using rainfall and landslide information in the period 1996–2011. TheT5,CAL threshold is significantly steeper than the T5,VEN threshold (γ =0.74±0.03 vs. γ=0.41±0.03), and can be applied only for D> 24 h (24≤D≤768 h), whereas theT5,VEN is applicable for 1≤D≤451 h. We maintain that the observed difference depends largely on the different resolution of the rainfall records i.e., daily measurements for our catalogue and hourly measurements for Vennari et al. (2014).
Figure 7b shows that the ED thresholds for landslide oc-currence in Calabria are different for the three 30-year con-sidered periods (T5,21−50,T5,51−80,T5,81−10). Inspection of
Table 1 confirms that the three thresholds are different, both for their intercepts (α)and the slopes (γ ). However, consid-ering the uncertainty associated to the thresholds (Brunetti et al., 2010; Peruccacci et al., 2012), we observe that the thresholds overlap for 40 <D< 400 h. We further observe thatT5,21−50 is the steepest threshold (γ=0.93±0.05) and T5,81−10is the less steep threshold (γ=0.66±0.04). We in-fer that for rainfall events havingD≤72 h (3 days), less rain was required to trigger landslides in the old (1921–1950) pe-riod than in the intermediate and in the recent pepe-riods.
7.3 Changes in the landslide impact to the population
To investigate the variations in the impact of landslides on the population of Calabria, we compared the number of REL with the size of the population in each of the 409 munici-palities in the region. For the purpose, we used population data available from national Censuses conducted by the Ital-ian National Institute of Statistics (ISTAT – www.istat.it) in 1951 (1 995 084 people in Calabria), 1981 (2 061 182), and 2011 (1 958 923). For simplicity, we attributed the popula-tion in 1951, 1981 and 2011 to the entire old, intermediate, and recent periods, without performing any interpolation or demographic modelling.
Figure 8a, b, c portray the changes in the density of the population in the 409 municipalities, for the three considered periods. The number of municipalities with a low (≤100 inhabitants per km2) or medium (101–200 inhabitants per km2)population density decreased in the 90-year observa-tion period. This was matched by an increase in the num-ber of urbanised municipalities (> 500 inhabitants per km2), which have increased from 11 (2.7 %) in the old period, to 12 (2.9 %) in the intermediate period, to 18 (4.4 %) in the recent period. The number of municipalities with a very low pop-ulation density (< 50 inhabitant per km2), located primarily in mountain areas (Fig. 1a), increased significantly, from 45 (11 %) in the old period, to 75 (18 %) in the intermediate pe-riod, to 118 (29 %) in the recent period (Fig. 8a, b, c). This is evidence of an uneven redistribution of the population in Calabria in the observation period. The number of munici-palities with a population density in the range 200–500 in-habitants per km2has remained about constant, throughout the investigated period.
equiv-Table 3. Cumulated event rainfall-rainfall duration (ED) thresholds, at 5 % exceedance probability, for rainfall-induced landslides in Calabria, for the entire catalogue and for different subsets. #REL is the number of rainfall events used to define the threshold.
Data set #REL Validity range (h) Threshold equation
Entire catalogue 1466 24≤D≤768 T5CAL:E=(1.6±0.2)·D(0.74±0.03)
Single landslides 534 24≤D≤768 T5,SG:E=(1.3±0.3)·D(0.75±0.04)
Multiple landslides 932 24≤D≤576 T5,ML:E=(1.4±0.2)·D(0.74±0.03)
Small landslides 610 24≤D≤672 T5,SL:E=(1.8±0.4)·D(0.69±0.04)
Large landslides 314 24≤D≤768 T5,LG:E=(1.5±0.4)·D(0.72±0.04)
Winter 728 24≤D≤768 T5,WT:E=(1.4±0.3)·D(0.74±0.04)
Spring 84a 24≤D≤456 n.a.
Summer 32a 24≤D≤120 n.a.
Autumn 622 24≤D≤672 T5,AT:E=(1.1±0.3)·D(0.82±0.04)
Wet period (Nov–Mar) 1159 24≤D≤768 T5,WET:E=(1.4±0.2)·D(0.75±0.03)
Dry period (Apr–Oct) 307 24≤D≤456 T5,DRY:E=(0.5±0.2)·D(0.99±0.04)
1921–1950 143 24≤D≤672 T5,21−50:E=(0.6±0.2)·D(0.93±0.05)
1951–1980 720 24≤D≤576 T5,51−80:E=(1.4±0.3)·D(0.75±0.04)
1981–2010 603 24≤D≤768 T5,81−10:E=(2.0±0.4)·D(0.66±0.04)
Vennari et al. (2014) 186 1≤D≤451 T5,VEN:E=(8.6±1.1)·D(0.41±0.03) ∗Number of REL insufficient to determine a reliable threshold. See Vennari et al. (2014).
alent to determining landslide risk using a simplified version of the well-known equation R=H×V×E (Varnes et al., 1984; Carrara et al., 1991), where R is landslide risk, H is landslide hazard, V is vulnerability to landslides, andE represents the exposed elements. For our simplified assess-ment we takeH=#REL, vulnerabilityV=1, and exposure E=P.
Adopting the first strategy, we calculated IRELin Calabria for the three considered periods. We found that IREL was 7.2×10⁻⁵ in the old period 1921–1950, it increased sig-nificantly to 3.5×10⁻⁴ (+79 %) in the intermediate period 1951–1980, and decreased slightly to 3.1×10⁻⁴ (−13 %) in the recent period 1981–2011. We conclude that, overall, IREL has increased in Calabria in the entire observation pe-riod. This is because the number of the rainfall events with landslides has changed more significantly than the size of the population.
Population did not change (increased/decreased) evenly in Calabria in the investigation period (Fig. 8a, b, c). For this reason, we computed the ratio between the number of REL and the number of people in each municipality, for the three considered 30-year periods (Fig. 8d, e, f). In the old period (1921–1950), 75 % of the municipalities (305 out of 409, Fig. 8d) did not experience REL (IREL=0), based on the in-formation listed in our catalogue. The percentage decreased significantly to 38 % (156 municipalities) in the interme-diate period (1951–1980, Fig. 8e), and increased again to 50 % (205 municipalities) in the recent period (1981–2010, Fig. 8f). The percentage of the municipalities with more than 1 REL per 1000 inhabitants went from 1 % (three munici-palities) in the old period, to 25 % (100) in the intermediate period, to 19 % (80) in the recent period. In the
intermedi-ate period, large values ofIREL were distributed throughout the region, whereas in the recent period they have been more abundant in the S part of the region (Fig. 8e and f). In the re-cent period, five out of six municipalities with more than five REL per 1000 inhabitants were located in the southernmost tip of the region, outlining an area with a high concentration of events and few inhabitants. In the 1921–1950 period, the maximum value ofIRELwas 1.5 (orange in Fig. 8d). Then it exceeded 5.0 in the intermediate and the recent periods (red in Fig. 8e and f). In the last two periods,IRELwas highest in the municipality of Plataci, in the northern part of the region, reaching 9.7 in the intermediate period (1951–1980) and de-creasing to 7.2 in the recent period (1981–2010).
Figure 7. (a) Cumulated event rainfall–rainfall duration (ED) 5 % thresholds for rainfall-induced landslides in Calabria defined in this study (T5,Cal, 1), compared to the 5 % threshold for shallow
land-slides in Calabria defined in Vennari et al. (2014) (T5,Ven, 2). (b)
Cumulated event rainfall–rainfall duration (ED) 5 % thresholds de-fined for the three 30-year periods 1921–1950 (T5,21−50, 3), 1951–
1980 (T5,51−80, 4), and 1951–2010 (T5,81−10, 5). Grey areas show
uncertainties associated to the thresholds. Data shown in log-log coordinates.
municipalities with medium and high risk were located in the E and in the S parts of the region.
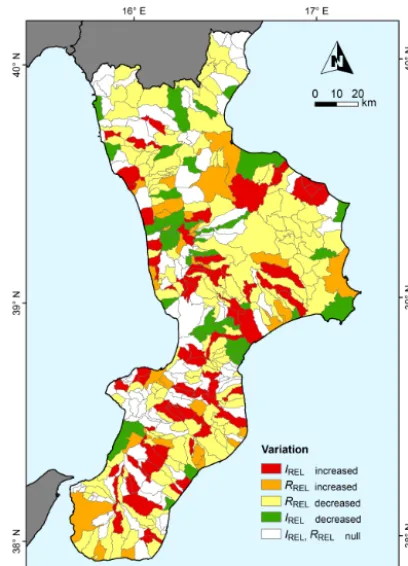
IREL andRREL provide different and complementary in-formation of the impact of landslides to the population of Calabria, and its temporal and geographical variations. We have attempted to combine this information in a single map, shown in Fig. 9. Considering the changes in the number of REL and the number of inhabitants in each municipality be-tween the intermediate (1951–1980) and the recent (1981– 2010) period (i.e., the periods for which our catalogues are considered complete for statistical purposes), four cases ex-ist. The first case consists of 73 (18 %) municipalities (red areas in Fig. 9, covering 2336 km2, 15.5 % of the region) where the number of REL has increased (from 102 to 288, +65 %) and the size of the population has decreased (from a total of 455 054 to 362 470 inhabitants,−26 %) in the re-cent period, compared to the previous (intermediate) period. In these municipalities a reduced (smaller) number of peo-ple has suffered a larger number of rainfall events with
land-slides. We conclude thatIREL has increased in these 73 mu-nicipalities, of which 33 municipalities increased the impact fromIREL=0 (no REL recorded in the catalogue) in the in-termediate period toIREL> 0 in the recent period. In 69 of the 73 municipalities (95 %)RRELhas also increased.
The second case consists of 30 (7 %) municipalities (or-ange areas in Fig. 9, covering 1008 km2, 6.7 %) where the number of REL (from 38 to 113,+78 %) and the size of the population (from 432 302 to 470 636 inhabitants,+8 %) have increased in the recent period compared to the previous pe-riod. In these 30 municipalities, a larger number of people experienced a larger number of REL i.e., a larger hazard. We conclude thatRRELhas increased in these 30 municipalities, of which 11 went fromRREL=0 (no REL in the catalogue) toRREL> 0. In 29 out of these municipalities (97 %),IREL has also increased.
The third case consists of 147 (36 %) municipalities (yel-low areas in Fig. 9, 5886 km2, 39.0 %) where the number of REL (from 423 to 138,−207 %) and the size of the pop-ulation (from 455 822 to 373 889,−22 %) have decreased. In these municipalities a reduced population has suffered a smaller number of REL. We conclude that RREL has de-creased in these 147 municipalities, becoming null (no REL in the catalogue) in 75 municipalities (51 %). In 117 of the 147 municipalities (80 %), IREL has also decreased. The fourth case consists of 47 (12 %) municipalities (green ar-eas in Fig. 9, covering 1608 km2, 10.7 %) where the size of the population has increased (from 325 117 to 407 863, +20 %) and the number of REL has decreased (from 143 to 49,−192 %) in the recent period, compared to the previous period. In these municipalities a larger population has suf-fered a smaller number of REL. We conclude thatIREL has decreased in these 47 municipalities, becoming null (no REL in the catalogue) in 18 municipalities (38 %). In 36 munici-palities (77 %)RRELhas also decreased.
For 87 % of the municipalities whereIRELincreased (de-creased), RREL also increased (decreased). This was ex-pected, asIREL andRREL depends on the same parameters. However, the fact that local differences exist in the temporal patterns ofIREL andRRELreveals that the two indexes mea-sure different properties of the impact of REL to the popu-lation, in Calabria. In 112 municipalities (27.4 %) (white ar-eas in Fig. 9, covering 4242 km2of the region, 28.1 %), no variation inRRELandIRELbetween the intermediate and the recent period was observed (no REL in the catalogue in both periods).
Figure 8. Top: Maps show density of population in the 409 municipalities in Calabria for three 30-year periods, (a) 1921–1950, (b) 1951– 1980, and (c) 1981–2010. Middle: Maps show landslide impactIREL given by the number of rainfall events with landslides (#REL) per
1000 people in each municipality in Calabria, for the (d) 1921–1950, (e) 1951–1980, and (f) 1981–2010 periods. Bottom: Maps show risk of rainfall events with landslidesRREL, given by the product of the number of rainfall events with landslides (#REL) and of inhabitants in each
Figure 9. Map showing variations inIREL andRREL in the mu-nicipalities of Calabria, between the intermediate (1951–1980) and the recent (1981–2010) periods. Legend: Red, municipalities with an increasedIREL(increased number of REL and a smaller
popu-lation). Orange, municipalities with an increasedRREL (increased number of REL and a larger population). Yellow, municipalities with a decreasedRREL (decreased number of REL and a smaller
population). Green, municipalities with a decreased IREL
(de-creased number of REL and a larger population). White, munici-palities withIRELandRRELnull (no REL listed in the catalogue in the intermediate and in the recent periods).
population. Overall, 93 municipalities went fromRREL > 0 and IREL > 0 in the intermediate period, to RREL=0 and IREL=0 in the recent period. In these municipalities the risk of REL to the population has decreased. Conversely, 44 mu-nicipalities changed from RREL=0 andIREL=0 in the in-termediate period, to RREL > 0 andIREL > 0 in the recent period. In total, 42.5 % of the regional population suffered an increased impact, both in terms of IREL andRREL. Mu-nicipalities whereIRELhas increased between the intermedi-ate and the recent period are locintermedi-ated mainly in the inner and mountainous areas of the region, and municipalities where IRELhas decreased between the two periods are mostly along the coasts and in the N part of the region. Municipalities whereRRELhas increased in the recent period, compared to the intermediate period, are located mainly along the coasts, and the municipalities whereRREL are unevenly distributed in the entire regional.
We recognise that multiple factors have conditioned the results of our analyses and the discussion. These include (i) the completeness of the landslide catalogue, (ii) the reliabil-ity and homogenereliabil-ity of the rainfall records, (iii) the length (90 years) of the catalogue, (iv) the number (3) and length (30 years) of the segmentation periods of the catalogue, (v) the modelling tools and parameters used to single out the RE and the REL, and (vi) to determine the rainfall thresholds. More sophisticated statistical techniques may also be used to analyse the catalogues of landslide events, of rainfall events, and of rainfall events with landslides (Rossi et al., 2010; Witt et al., 2010). For these reasons, we acknowledge that our re-sults are preliminary.
8 Conclusions
We have investigated geographical and temporal changes in the occurrence of 1466 rainfall-induced landslide events in Calabria, in the 90-year period 1921–2010.
Our work revealed that the rainfall conditions that have resulted in rainfall-induced landslides in Calabria have changed in the observation period. We found that less cu-mulated event rainfall (E) was necessary to trigger land-slides in the recent period (1981–2010) than in the preced-ing period (1951–1980). We consider this evidence of the increased propensity of the landscape to generate landslides in the recent period, and of the larger number of vulnera-ble elements exposed to landslides, in Calabria. We found that the monthly distribution of rainfall events with land-slides (REL) has changed. In the earlier period (1951–1980) landslides were more frequent in autumn and winter, whereas in the recent period (1981–2010) landslides concentrated in the winter. We further observed significant variations in the geographical distribution of the REL. In the recent period (1981–2010) REL struck mainly the SE part of the region. We attribute the observed variations in the temporal and the geographical distributions of rainfall events with landslides in Calabria to variations in the frequency of the triggering rainfall events, and to an increased susceptibility to landslide of the territory.
We note that the observed changes in the impact of rainfall-induced landslides on the population of Calabria in the investigated 90-year period are due to changes in the number of the events (a largely natural component) and to changes in the number of the exposed elements (a largely societal component). Several of the municipalities with an increased landslide risk between the intermediate and the re-cent periods have experienced a similar number of REL (haz-ard has remained about the same) in the two periods, but a large increase in the size of the population (exposure has in-creased) in the recent period.
Overall, our research revealed a complex picture of the changes in the impact of rainfall-induced landslides in Cal-abria in the recent past, with areas where the impact and risk to the population have increased, and other areas where the impact and risk have decreased. The geographical pattern of the variations is diversified (Fig. 9), revealing the complexity of the interactions between the natural (climate) and the hu-man induced (population, land cover) factors that control the frequency of the rainfall-induced landslides, and the intensity of the consequences. We argue that there was nothing special or peculiar in the natural and societal landscapes in Calabria. We therefore hypothesise that the same complexity and vari-ability exists in similar surrounding regions, in Italy and in the Mediterranean region. The hypothesis can be tested us-ing the same methodology experimented in this paper for the joint analysis of historical landslide, rainfall and population information, anywhere adequate information is available.
Finally, we stress that the complexity of the temporal and geographical pattern of the variations in the frequency and impact of rainfall-induced landslides observed for the recent past in Calabria suggests that it will be difficult and uncertain to predict the possible variations in the frequency and impact in response to future climatic and environmental changes.
The Supplement related to this article is available online at doi:10.5194/nhess-15-2313-2015-supplement.
Acknowledgements. The “Centro Funzionale Multirischi” of the Agenzia Regionale per l’Ambiente della Calabria (ARPACAL, http://www.cfd.calabria.it) made available the rainfall data. Paola Salvati and Cinzia Bianchi (CNR IRPI) provided updated information on landslides with human consequences in Italy and in Calabria. Massimo Melillo (CNR IRPI) calculated the rainfall thresholds. We thank two anonymous reviewers for their comments.
Edited by: K.-T. Chang
Reviewed by: two anonymous referees
References
Bertolini, G.: Radiocarbon dating on landslides in the Northern Apennines (Italy), in: Landslides and Climate Change: Chal-lenges and Solutions, edited by: Mathie E., McInnes, R., Fair-bank, H., and Jakeways, J.: Proceedings of the International Con-ference on Landslides and Climate Change, Ventnor, Taylor & Francis, 73–80, doi:10.1201/noe0415443180, 2007.
Borgatti, L. and Soldati, M.: Landslides as a
geomorpho-logical proxy for climate change: a record from the
Dolomites (northern Italy), Geomorphology, 120, 56–64, doi:10.1016/j.geomorph.2009.09.015, 2010.
Brunetti, M., Buffoni, L., Mangianti, F., Maugeri, M., and Nanni, T.: Temperature, precipitation and extreme events during the last century in Italy, Global Planet. Change, 40, 141–149, doi:10.1016/s0921-8181(03)00104-8, 2002.
Brunetti, M., Caloiero, T., Coscarelli, R., Gullà, G., Nanni, T., and Simolo, C.: Precipitation variability and change in the Calabria region (Italy) from a high resolution daily dataset, Int. J. Clima-tol., 32, 57–73, doi:10.1002/joc.2233, 2012.
Brunetti, M. T., Peruccacci, S., Rossi, M., Luciani, S., Valigi, D., and Guzzetti, F.: Rainfall thresholds for the possible occurrence of landslides in Italy, Nat. Hazards Earth Syst. Sci., 10, 447–458, doi:10.5194/nhess-10-447-2010, 2010.
Brunetti, M. T., Peruccacci, S., Antronico, L., Bartolini, D., De-ganutti, A. M., Gariano, S. L., Iovine, G., Luciani, S., Luino, F., Melillo, M., Palladino, M. R., Parise, M., Rossi, M., Turconi, L., Vennari, C., Vessia, G., Viero, A., and Guzzetti, F.: Catalogue of Rainfall Events with Shallow Landslides and New Rainfall thresholds in Italy, in: Engineering Geology for Society and Ter-ritory, edited by: Lollino, G., Giordan, D., Crosta, G.B., Coromi-nas, J., Azzam, R., Wasowski, J., and Sciarra, N., Vol. 2, Springer International Publishing, Switzerland, 1575–1579, 2015. Buma, J. and Dehn, M.: A method for predicting the impact of
climate change on slope stability, Env. Geol., 35, 190–196, doi:10.1007/s002540050305, 1998.
Buma, J. and Dehn, M.: Impact of climate change on a landslide in South East France, simulated using different GCM scenarios and downscaling methods for local precipitation, Climate Res., 15, 69–81, doi:10.3354/cr015069, 2000.
Caloiero, T., Coscarelli, R., and Ferrari, E.: Trend analysis of short rainfalls annual maxima in Calabria, in: Ferrari, E., and Versace, P. (eds.): Variability in space and time of extreme rainfalls, floods and droughts, Bios, Cosenza, Italy, 103–111, 2008.
Caloiero, T., Coscarelli, R., Ferrari, E., and Mancini, M.: Precip-itation change in Southern Italy linked to global scale oscil-lation indexes, Nat. Hazards Earth Syst. Sci., 11, 1683–1694, doi:10.5194/nhess-11-1683-2011, 2011.
Carrara, A., Cardinali, M., Detti, R., Guzzetti, F., Pasqui, V., and Reichenbach, P.: GIS techniques and statistical models in evalu-ating landslide hazard, Earth Surface Proc. Land., 16, 427–445, doi:10.1002/esp.3290160505, 1991.
Chiang, S. H. and Chang, K. T.: The potential impact
of climate change on typhoon-triggered landslides in
Taiwan, 2010–2099, Geomorphology, 133, 143–151,
doi:10.1016/j.geomorph.2010.12.028, 2011.
Crozier, M. J.: Deciphering the effect of climate change on landslide activity: a review, Geomorphology, 124, 260–267, doi:10.1016/j.geomorph.2010.04.009, 2010.
Dehn, M. and Buma, J.: Modelling future landslide activity based on general circulation models, Geomorphology, 30, 175–187, doi:10.1016/s0169-555x(99)00053-7, 1999.
Dehn, M., Bürger, G., Buma, J., and Gasparetto, P.: Impact of cli-mate change on slope stability using expanded downscaling, Eng. Geol., 55, 193–204, doi:10.1016/s0013-7952(99)00123-4, 2000. Diodato, N., Petrucci, O., and Bellocchi, G.: Scale-invariant rain-storm hazard modeling for slopeland warning, Meteorol. Appl., 19, 279–288, doi:10.1002/met.259, 2011.
Emilia-Romagna SGSS (Servizio Geologico, Sismico
e dei Suoli): Geologia, sismica e suoli. Archivio
Storico delle Frane, available at: http://ambiente.regione. emilia-romagna.it/geologia/temi/dissesto-idrogeologico/ larchivio-storico-dei-movimenti-franosi, last access: 10 October 2015.
Ferrari, E. and Terranova, O. G.: Non-parametric detection of trends and change point years in monthly and annual rainfalls, in: Pro-ceedings of 1st Italian–Russian Workshop – New trends in hy-drology, CNR Publications, Rende (CS), Italy, 177–188, 2004. Gullà, G., Caloiero, T., Coscarelli, R., and Petrucci, O.: A
pro-posal for a methodological approach to the characterisation of Widespread Landslide Events: an application to Southern Italy, Nat. Hazards Earth Syst. Sci., 12, 165–173, doi:10.5194/nhess-12-165-2012, 2012.
Guzzetti, F.: Landslide fatalities and the evaluation of land-slide risk in Italy, Eng. Geol., 58, 89–107, doi:10.1016/s0013-7952(00)00047-8, 2000.
Guzzetti, F. and Tonelli, G.: Information system on hydrological and geomorphological catastrophes in Italy (SICI): a tool for managing landslide and flood hazards, Nat. Hazards Earth Syst. Sci., 4, 213–232, doi:10.5194/nhess-4-213-2004, 2004. Guzzetti, F., Cardinali, M., and Reichenbach, P.: The AVI Project:
A bibliographical and archive inventory of landslides and floods in Italy, Env. Manag., 18, 623–633, doi:10.1007/BF02400865, 1994.
Guzzetti, F., Salvati, P., and Stark, C. P.: Evaluation of risk to the population posed by natural hazards in Italy, in: Landslide risk management, edited by: Hungr, O., Fell, R., Couture, R., and Eberhardt, E., Taylor & Francis Group, London, 381–389, 2005a. Guzzetti, F., Stark, C. P., and Salvati, P.: Evaluation of flood and landslide risk to the population of Italy, Env. Manag., 36, 15–36, doi:10.1007/s00267-003-0257-1, 2005b.
Guzzetti, F., Peruccacci, S., Rossi, M., and Stark, C. P.: Rain-fall thresholds for the initiation of landslides in central and southern Europe, Meteorol. Atmos. Phys., 98, 239–267, doi:10.1007/s00703-007-0262-7, 2007.
Guzzetti, F., Peruccacci, S., Rossi, M., and Stark, C. P.: The rainfall intensity-duration control of shallow landslides and debris flow: an update, Landslides, 5, 3–17, doi:10.1007/s10346-007-0112-1, 2008.
Iovine, G., Greco, R., Gariano, S. L., Iaquinta, P., Pellegrino, A. D., and Terranova, O. G.: Shallow-landslide susceptibility in the Costa Viola mountain ridge (Southern Calabria, Italy) with con-siderations on the role of causal factors, Natural Hazards, 73, 111–136, doi:10.1007/s11069-014-1129-0, 2014.
IPCC: Climate Change 2013: The Physical Science Basis. Working Group I. Contribution of to the Fifth Assessment Report of the Intergovernmental Panel on Climate Change, Cambridge, United Kingdom and New York, NY, USA, 2013.
Kirschbaum, D.: Global Catalog of rainfall-triggered landslides for spatial and temporal hazard characterization, in: Landslide Sci-ence for a Safer Geoenvironment, edited by: Sassa, K., Canuti, P., and Yin, Y., Vol. 2, Springer International Publishing Switzer-land, 2014.
Lang, A., Moya, J., Corominas, J., Schrott, L., and Dikau, R.: Classic and new dating methods for assessing the temporal occurrence of mass movements, Geomorphology, 30, 33–52, doi:10.1016/s0169-555x(99)00043-4, 1999.
Llasat, M. C., Llasat-Botija, M., Petrucci, O., Pasqua, A. A., Rosselló, J., Vinet, F., and Boissier, L.: Towards a database on societal impact of Mediterranean floods within the framework of the HYMEX project, Nat. Hazards Earth Syst. Sci., 13, 1337– 1350, doi:10.5194/nhess-13-1337-2013, 2013a.
Llasat, M. C., Llasat-Botija, M., Petrucci, O., Pasqua, A. A., Rosselló, J., Vinet, F., and Boissier, L.: Floods in the north-western Mediterranean region: presentation of the HYMEX database and comparison with pre-existing global databases, Houille Blanche, Revue International de l’Eaux, 1, 5–9, 2013b. Lollino, G., Manconi, A., Clague, J., Shan, W., and Chiarle, M.
(Eds.): Engineering Geology for Society and Territory, Vol-ume 1, Climate Change and Engineering Geology, 570 pp., doi:10.1007/978-3-319-09300-0, 2014.
Mathie E., McInnes, R., Fairbank, H., and Jakeways, J. (Eds.): Landslides and Climate Change: Challenges and So-lutions, Proceedings of the International Conference on Land-slides and Climate Change, Ventnor, Taylor & Francis, doi:10.1201/noe0415443180, 2007.
Melillo, M., Brunetti, M. T., Peruccacci, S., Gariano, S. L., and Guzzetti, F.: An algorithm for the objective reconstruction of rainfall events responsible for landslides, Landslides, 12, 311– 320, doi:10.1007/s10346-014-0471-3, 2015.
Monaco, C. and Tortorici, L.: Active faulting in the Calabrian arc and eastern Sicily, J. Geodyn., 29, 407–424, doi:10.1016/s0264-3707(99)00052-6, 2000.
Palmieri, W., Petrucci, O., and Versace, P.: La difesa del suolo nell’Ottocento nel Mezzogiorno d’Italia. IV Quaderno dell’Osservatorio di Documentazione Ambientale (Dip. Difesa del Suolo, UNICAL), Rubbettino, Soveria Mannelli, Italy, 184 pp., 2011 (in Italian).
Peruccacci, S., Brunetti, M. T., Luciani, S., Vennari, C., and Guzzetti, F.: Lithological and seasonal control of rainfall thresholds for the possible initiation of land-slides in central Italy, Geomorphology, 139–140, 79–90, doi:10.1016/j.geomorph.2011.10.005, 2012.
Petrucci, O. and Gullà, G.: A simplified method for assess-ing landslide damage indices, Nat. Hazards, 52, 539–560, doi:10.1007/s11069-009-9398-8, 2010.
Petrucci, O. and Pasqua, A. A.: The study of past damaging hy-drogeological events for damage susceptibility zonation, Nat. Hazards Earth Syst. Sci., 8, 881–892, doi:10.5194/nhess-8-881-2008, 2008.
K., Vol. 7, Social and Economic Impact and Policies, Springer, Switzerland, ISBN 978-3-642-31313-4, 145–151, 2013. Petrucci, O. and Versace, P.: Frane e alluvioni in provincia di
Cosenza agli inizi del ‘900: ricerche storiche nella documen-tazione del Genio Civile, I Quaderno dell’Osservatorio di Doc-umentazione Ambientale (Dipartimento Difesa del Suolo, UNI-CAL), Editoriale Bios, Rende, Italy, 172 pp., 2005 (in Italian). Petrucci, O. and Versace, P.: Frane e alluvioni in provincia di
Cosenza tra il 1930 e il 1950: ricerche storiche nella documen-tazione del Genio Civile, II Quaderno dell’Osservatorio di Doc-umentazione Ambientale (Dipartimento Difesa del Suolo, UNI-CAL), Pubbl. GNDCI N. 2913, Editoriale Bios, Rende, Italy, 247 pp., 2007 (in Italian).
Petrucci, O., Versace, P., and Pasqua, A. A.: Frane e alluvioni in provincia di Cosenza fra il 1951 ed il 1960: ricerche storiche nella documentazione del Genio Civile. III Quaderno dell’Osservatorio di Documentazione Ambientale (Dipartimento Difesa del Suolo, UNICAL), Rubbettino, Soveria Mannelli, Italy, 175 pp., 2009 (in Italian).
POLARIS, available at: http://polaris.irpi.cnr.it/
cinquanta-anni-di-frane-ed-inondazioni-in-italia-1964-2013/, last access: 27 April 2015.
Polemio, M. and Petrucci, O.: Occurrence of landslide events and the role of climate in the twentieth century in Calabria, southern Italy, Q. J. Eng. Geol. Hydroge., 43, 403–415, doi:10.1144/1470-9236/09-006, 2010.
Reichenbach, P., Cardinali, M., De Vita, P., and Guzzetti, F.: Re-gional hydrological thresholds for landslides and floods in the Tiber River Basin (central Italy), Environ. Geol., 35, 146–159, doi:10.1007/s002540050301, 1998.
Rianna, G., Zollo, A. L., Tommasi, P., Paciucci, M., Comegna, L., and Mercogliano, P.: Evaluation of the effects of climate changes on landslide activity of Orvieto clayey slope, Procedia Earth Planetary Science, 9, 54–63, doi:10.1016/j.proeps.2014.06.017, 2014.
Rossi, M., Witt, A., Guzzetti, F., Malamud, B. D., and Peruccacci, S.: Analysis of historical landslide time series in the Emilia-Romagna region, northern Italy, Earth Surf. Process. Landf., 35, 1123–1137, doi:10.1002/esp.1858, 2010.
Salvati, P., Guzzetti, F., Reichenbach, P., Cardinali, M., and Stark, C. P.: Map of landslides and floods with human consequences in Italy, CNR Gruppo Nazionale per la Difesa dalle Catastrofi Idro-geologiche Publication n. 2822, scale 1 :1 200 000, CNR GNDCI Publication, Italy, 2003.
Salvati, P., Bianchi, C., and Guzzetti F.: Catalogo delle Frane e delle Inondazioni Storiche in Umbria, CNR IRPI e Fondazione Cassa di Risparmio di Perugia, ISBN-10 88-95172-00-0, ISBN-13 978-88-95172-00-2, 278 pp., 2006 (in Italian).
Salvati, P., Bianchi, C., Rossi, M., and Guzzetti, F.: Societal land-slide and flood risk in Italy, Nat. Hazards Earth Syst. Sci., 10, 465–483, doi:10.5194/nhess-10-465-2010, 2010.
Stoffel, M., Tiranti, D., and Huggel, C.: Climate change impacts on mass movements – Case studies from the
European Alps, Sci. Total Environ., 493, 1255–1266,
doi:10.1016/j.scitotenv.2014.02.102, 2014.
Terranova, O. G.: Caratteristiche degli eventi pluviometrici a scala giornaliera in Calabria, in: XXIX Convegno di Idraulica e Costruzioni Idrauliche, Trento, 7–10 settembre, Editoriale Bios, Cosenza, Italy, 2, 343–350, ISBN 88-7740-382-9, 2004 (in Ital-ian).
Terranova, O. G. and Gariano, S. L.: Rainstorms able to in-duce flash floods in a Mediterranean-climate region (Calabria, southern Italy), Nat. Hazards Earth Syst. Sci., 14, 2423–2434, doi:10.5194/nhess-14-2423-2014, 2014.
Tortorici, L.: Lineamenti geologico-strutturali dell’Arco Calabro-Peloritano, Rendiconti della Società Italiana di Mineralogia e Petrologia, 38, 940–972, 1982 (in Italian).
Trigila, A., Iadanza, C., and Spizzichino, D.: Quality assessment of the Italian Landslide Inventory using GIS processing, Land-slides, 7, 455–470, doi:10.1007/s10346-010-0213-0, 2010. Varnes, D. J. and IAEG Commission on Landslides and other Mass
Movements on Slopes: Landslide hazard zonation: a review of principles and practice, UNESCO Press, Paris, 63 pp., 1984. Vennari, C., Gariano, S. L., Antronico, L., Brunetti, M. T., Iovine,
G., Peruccacci, S., Terranova, O., and Guzzetti, F.: Rain-fall thresholds for shallow landslide occurrence in Calabria, southern Italy, Nat. Hazards Earth Syst. Sci., 14, 317–330, doi:10.5194/nhess-14-317-2014, 2014.
Witt, A., Malamud, B. D., Rossi, M., Guzzetti, F., and Peruccacci, S.: Temporal correlations and clustering of landslides, Earth Surf. Process. Landf., 35, 1138–1156, doi:10.1002/esp.1998, 2010. Wood, J. L., Harrison, S., and Reinhardt, L.: Landslide inventories