INTERNATIONAL RESEARCH JOURNAL OF PHARMACY
www.irjponline.com
ISSN 2230 – 8407
Research Article
DEVELOPMENT OF CHROMATOGRAPHIC METHOD AND VALIDATION FOR
ESTIMATION OF PIRFENIDONE IN BULK AND PHARMACEUTICAL DOSAGE FORM
More Siddhant *, Dalwate Shweta, Chandramore Nehal, Jadhav Vaishali, Jain Ashish
Department of Quality Assurance, Shri .D.D. Vispute College of Pharmacy, New Panvel, India
*Corresponding Author Email: [email protected]Article Received on: 01/01/19 Approved for publication: 13/05/19
DOI: 10.7897/2230-8407.1007216
ABSTRACT
The Pirfenidone (orphan drug) is a novel antifibrotic agent used in idiopathic pulmonary fibrosis. A new RP-HPLC method was developed and validated for the quantitative determination of Pirfenidone in tablet dosage form. Separation was achieved on C18 analytical column (250 × 4.6 mm, 5 µm) using
Acn: Methanol: Water (65:15:20) as mobile phase with PDA detector. λ max was found to be at 317 nm. The flow rate was 1ml/min. standard curve was found to be linear over the concentration range of 5-25 μg/ml with r2 of 0.9989. The % recovery was found to be within 98-100 % and RSD < 2%.
The method was validated as per ICH guidelines for linearity, precision, accuracy, robustness. The method was successfully applied for determination of Pirfenidone in tablet dosage form. The develop method was simple, less time consuming and cost effective.
Key words: RP-HPLC, Pirfenidone, Validation, Assay.
INTRODUCTION
Pirfenidone (orphan drug) is first clinically used novel antifibrotic agent approved for idiopathic pulmonary fibrosis (IPF) in Japan (Pirespa), Europe (Esbriet) and India (pirfenair).1 It is orally
available pyridone derivative that has antifibrotic, anti-inflammatory and antioxidative actions.1 Patients with IPF shows
symptoms such as shortness of breath, Cough, destruction of healthy lung tissue and hampered daily physical activities.2 The
exact cause of IPF is unknown. The disease causes lungs to become scarred and stiffened, which may lead to difficulty in breathing. IPF usually occurs in people aged 50 to 70.3 It is believed to occur due to inflammatory response from an unknown substance. Patients diagnosed with IPF experience progressive pulmonary insufficiency and most die of respiratory failure.1 The
estimated survival upon diagnosis is approximately 3 years. Treatment for IPF includes oxygen therapy, pulmonary rehabilitation and lung transplant. Pirfenidone is the only therapeutic agent for treatment of IPF. In animal experimental models, PFD has demonstrated and antifibrotic effect in several tissues, such as lung, liver and kidney. Pirfenidone / 5-methyl-1-phenyl-2-(1H)-pyridone is small heterocyclic molecule which on oral administration shows that it is rapidly metabolized to 5 – hydroxyl Pirfenidone and 5-Carboxy Pirfenidone. Major metabolite i.e. 5-Carboxy Pirfenidone is eliminated in the urine (>87%). Various HPLC and LCMS/MS methods are reported for Pirfenidone for biological fluids like plasma, serum, urine, but very few methods are reported for estimation of Pirfenidone in pharmaceutical dosage form.3
MATERIALS AND METHOD
Chemicals and reagents
Pirfenidone was provided as gift sample from Cipla, Vikroli. Purity of drug was evaluated by obtaining its IR spectra. No impurities were found and the drug was used for further study without any purification. HPLC grade methanol, water, Acn were obtained from research chem, Mumbai were of standard quality. Film coated tablets of Pirfenidone tablet IP 200 mg (Pirfenex RX,
Cipla Ltd) were purchased from local market.
Instrumentation
The chromatographic technique was performed on shimadzu UV 1800 double beam UV-visible spectrophotometer with UV probe software and JASCO HPLC 4000 on Chrom NAV software on reverse phase inertsil C18 column (250 × 4.6 mm × 5μm) as
stationary phase.
Chromatographic condition
Chromatographic separation was performed on inertsil C18
analytical column. Mobile phase consisting of Acn: Methanol: Water (65:15:20) at flow rate 1.0 ml /min with injection volume of 10 μl.
PREPARATION OF CALIBRATION CURVE FOR UV
Working standard stock solution (A1)
Working standard stock solution (A2)
Pipette out 1 ml of above stock solution (A1) and transfer it to 10 ml volumetric flask, and volume was made up to mark with Acn. (Concentration of 100 μg/ml of Pirfenidone)
Working standard solution
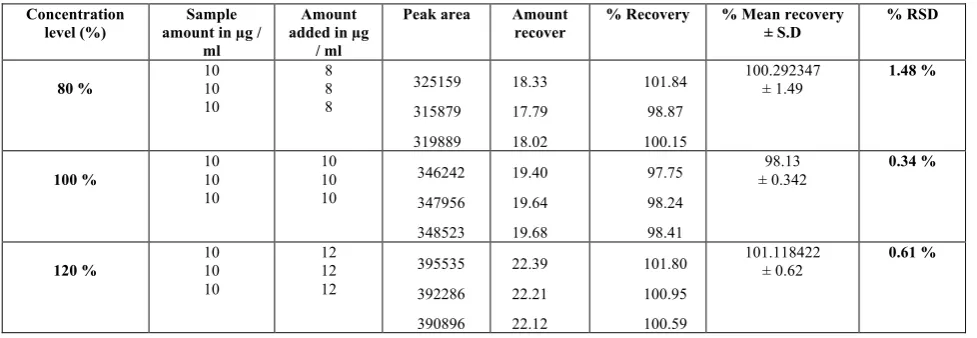
2 ml of standard stock solution (A2) was transferred to 10 ml volumetric flask and volume was made up to the mark with Acn. (Concentration of 20 μg/ml). Standard solution of 20 μg/ml was scanned between 400 to 200 nm. From the spectra, λ max of Pirfenidone was selected at 317 nm for method development.
SAMPLE PREPARATION
Standard stock solution
Accurately weigh 0.01 gm of Pirfenidone drug and transferred it in 10 ml volumetric flask. Make up the volume up to the mark with Acn to prepare a stock of concentration 1000 μg/ml. from this solution pipette out 1 ml and transferred to 10 ml volumetric flask and make up the volume upto the mark with diluent (Acn) to prepare a stock of concentration 100 μg/ml. from this solutions further dilutions were made to prepare a concentration of 5, 10, 15, 20, 25 μg/ml.
Method validation
Linearity
Linearity of an analytical procedure is its ability to obtain test results which are directly proportional to the concentration (amount) of analyte in the sample. Linearity was performed by diluting standard stock solution (100 μg/ml) to give final concentration in the range of 5μg/ml to 25 μg/ml. 10 μl of each concentration was injected and calibration curve was constructed by plotting peak area vs drug concentration. Correlation coefficient should not be less than 0.999.4
Accuracy
Accuracy of an analytical method is the closeness of test results obtained by the method to the true value. Accuracy was performed in triplicates and compares the results. % recovery was performed by spiking known quantity of drug at 80,100,120% to a pre-quantified sample solution.4
From the result % recovery was calculated
1. Mean recovery should be in the range of 98-102% 2. The relative standard deviation should not be more
than 2.0%
Precision
Precision of an analytical procedure is the closeness of agreement between a series of measurement obtained from multiple sampling of same homogeneous sample under the prescribed conditions. Precision is consider at three levels. Repeatability, intermediate precision and reproducibility. Prepare 6 different test solutions. Inject duplicate injection of each test solution. Pipette 1 ml of stock solution (100 μg/ml) in 10 ml volumetric flask and dilute with solvent in sufficient quantity and make volume up to the mark with solvent to get concentration of Pirfenidone 10 ppm.4
Robustness
Robustness of an analytical method, is the capacity to remain unaffected by small but deliberate variations to remain unaffected by small but deliberate change in the method parameters. Robustness is carried out by changing parameters like flow rate at 0.8ml/min and 1.2 ml/min, wavelength 312 nm and 322 nm, temperature 25 ̊ c and 35 ̊ c and mobile phase composition.4
Analysis of marketed tablet formulation
Accurately weigh 5 tablets of (Pirfenidone) and crushed to a fine powder. Accurately weigh and transfer a quantity of powder sample equivalent to 10 mg of Pirfenidone into a 10 ml volumetric flask. Add sufficient diluent and sonicate to dissolve it completely and make volume up to the mark with diluent. Filter the solution through 0.45 μm nylon filter. Pipette out 1 ml of above stock solution into 10 ml volumetric flask and dilute up to the mark with diluent for 10 μg/ml solution.4
RESULTS AND DISCUSSION
The present work was aimed to chromatographic method development and validation for estimation of Pirfenidone in pharmaceutical dosage form. A reverse phase chromatographic technique was developed to determine Pirfenidone at 317 nm on C18 column. (250 × 4.6 mm ×5 μm)
HPLC method development and optimization
In the literature survey of Pirfenidone there were many methods developed on RPHPLC using mobile phase such as Acn: water, methanol: water, Acn: buffer i.e. binary system. But, no suitable method were developed using tertiary system i.e. combination of Acn: methanol: water (65:15:20) on C18 column at flow rate 1
ml/min at detection wavelength 317 nm. Hence this mobile phase was chosen as the best chromatographic condition for the entire study.
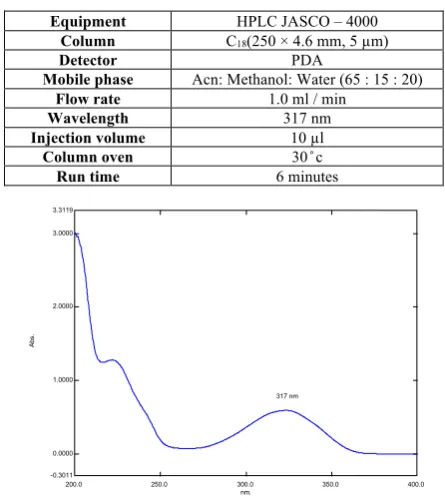
Table no 1: Optimization conditions for HPLC
Equipment HPLC JASCO – 4000 Column C18(250 × 4.6 mm, 5 µm)
Detector PDA
Mobile phase Acn: Methanol: Water (65 : 15 : 20)
Flow rate 1.0 ml / min
Wavelength 317 nm
Injection volume 10 µl
Column oven 30 ̊ c
Run time 6 minutes
Figure no 1: UV spectra of Pirfenidone in acetonitrile
METHOD VALIDATION
Linearity
The calibration curve for Pirfenidone was linear over the concentration range 5-25 μg/ml. calibration curve was constructed by plotting the peak area vs the drug concentration. The regression equation for the calibration curve was found to be y = 17312x + 7782.8 with correlation coefficient of 0.9989 which is nearly equals to unity.
nm.
200.0 250.0 300.0 350.0 400.0
Ab
s.
3.3119
3.0000
2.0000
1.0000
0.0000
-0.3011
Table no 2: linearity data for Pirfenidone
Sr.no Concentration Peak area
1 0 0
2 5 98208
3 10 185887
4 15 272348
5 20 352721
6 25 435909
Mean 2241478.8
Correlation coefficient 0.9989
Slope 7782.8
R2 = 0.9989
Linearity equation: y = 17312x + 7782.8
Acceptance criteria: correlation coefficient ‘r’ should not be less than 0.997
Observation: peak area is directly proportional to the concentration of analyte in the sample, therefore the proposed method is linear in the specified range.
Figure no 2: linearity graph of Pirfenidone
Accuracy
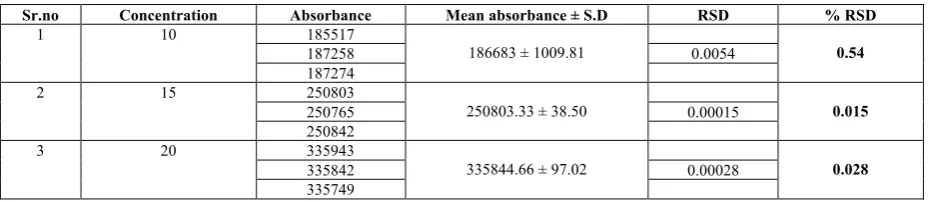
Accuracy was performed in three different levels for Pirfenidone. Analysis was done in triplicate for each level. The % recovery is within 98-102%.
Table no 3: accuracy data for Pirfenidone
Concentration level (%)
Sample amount in µg /
ml
Amount added in µg
/ ml
Peak area Amount recover
% Recovery % Mean recovery ± S.D
% RSD
80 %
10 10 10
8 8 8
325159
315879
319889
18.33
17.79
18.02
101.84
98.87
100.15
100.292347 ± 1.49
1.48 %
100 %
10 10 10
10 10 10
346242
347956
348523
19.40
19.64
19.68
97.75
98.24
98.41
98.13 ± 0.342
0.34 %
120 %
10 10 10
12 12 12
395535
392286
390896
22.39
22.21
22.12
101.80
100.95
100.59
101.118422 ± 0.62
0.61 %
Acceptance criteria: % recovery as per ICH guidelines should be within 98 – 102%
Observation: % recovery of Pirfenidone at 80 %, 100%, 120 % concentration level was found to be 100.29, 98.13, 101.11 respectively, which are within the limits.
Precision
The precision of the method was determined by system precision, method precision and intermediate precision. System precision
Table 4: System and method precision
Sr.no Concentration ( μg/ml) System precision Method precision
1 10 183740 185887
2 10 183781 185202
3 10 183898 185246
4 10 183862 182452
5 10 183878 184524
6 10 183884 185321
Mean 183840.5 184772
S.D 64.35 1216.39
% RSD 0.035 0.65
Intermediate precision
Table no 5: Intraday precision of Pirfenidone
Sr.no Concentration Peak area Mean absorbance ± S.D RSD % RSD
1 10 179519
179662.33 ± 497.72 0.277
179252 0.00277
187274
2 15 246620
246475 ± 171.97 0.069
246520 0.000698
246285
3 20 330023
330464.6 ± 644.63 0.198
330153 0.001951
331218
Acceptance criteria: % RSD should be less than 2.0 %
Observation: the relative standard deviation was found to be within 0.0006 – 0.00277 % for intraday precision. % RSD was found to be less than 2.0 %, which is within the limits.
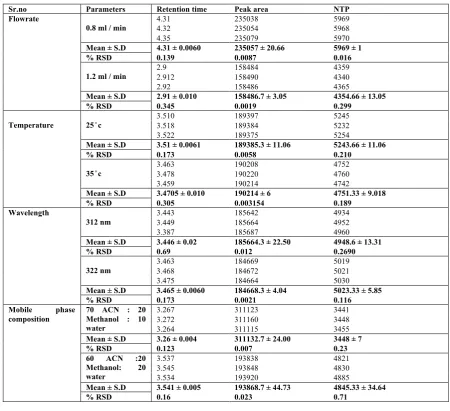
Table no 6: Interday precision of Pirfenidone
Sr.no Concentration Absorbance Mean absorbance ± S.D RSD % RSD
1 10 185517
186683 ± 1009.81 0.54
187258 0.0054
187274
2 15 250803
250803.33 ± 38.50 0.015
250765 0.00015
250842
3 20 335943
335844.66 ± 97.02 0.028
335842 0.00028
335749
Acceptance criteria: % RSD should be less than 2.0 %
Observation: the relative standard deviation was found to be within 0.00015 – 0.0054 % for interday precision. % RSD was found to be less than 2.0 % for interday precision. It was observe that % RSD was less than 2.0 % for intraday and interday precision, therefore the developed method is precise for its use. Robustness
Robustness of an analytical method is a measure of its capacity to remain unaffected by small but deliberate variations in method
Table no 7: Robustness data for Pirfenidone
Sr.no Parameters Retention time Peak area NTP
Flowrate
0.8 ml / min
4.31 235038 5969
4.32 235054 5968
4.35 235079 5970
Mean ± S.D 4.31 ± 0.0060 235057 ± 20.66 5969 ± 1
% RSD 0.139 0.0087 0.016
1.2 ml / min
2.9 158484 4359
2.912 158490 4340
2.92 158486 4365
Mean ± S.D 2.91 ± 0.010 158486.7 ± 3.05 4354.66 ± 13.05
% RSD 0.345 0.0019 0.299
Temperature 25 ̊ c
3.510 189397 5245
3.518 189384 5232
3.522 189375 5254
Mean ± S.D 3.51 ± 0.0061 189385.3 ± 11.06 5243.66 ± 11.06
% RSD 0.173 0.0058 0.210
35 ̊ c
3.463 190208 4752
3.478 190220 4760
3.459 190214 4742
Mean ± S.D 3.4705 ± 0.010 190214 ± 6 4751.33 ± 9.018
% RSD 0.305 0.003154 0.189
Wavelength
312 nm
3.443 185642 4934
3.449 185664 4952
3.387 185687 4960
Mean ± S.D 3.446 ± 0.02 185664.3 ± 22.50 4948.6 ± 13.31
% RSD 0.69 0.012 0.2690
322 nm
3.463 184669 5019
3.468 184672 5021
3.475 184664 5030
Mean ± S.D 3.465 ± 0.0060 184668.3 ± 4.04 5023.33 ± 5.85
% RSD 0.173 0.0021 0.116
Mobile phase composition
70 ACN : 20 Methanol : 10 water
3.267 311123 3441
3.272 311160 3448
3.264 311115 3455
Mean ± S.D 3.26 ± 0.004 311132.7 ± 24.00 3448 ± 7
% RSD 0.123 0.007 0.23
60 ACN :20 Methanol: 20 water
3.537 193838 4821
3.545 193848 4830
3.534 193920 4885
Mean ± S.D 3.541 ± 0.005 193868.7 ± 44.73 4845.33 ± 34.64
% RSD 0.16 0.023 0.71
Acceptance criteria: % RSD should be less than 2.0 %
Observation: system suitability parameters was found to be within limit at all variable conditions for robustness study conducted with % RSD not more than 2.0 %.
Assay
Table no 8: Assay results for Pirfenidone
Sr.no Concentration μg / ml Sample area Standard area
1 10 188074 185887
2 10 186854 188502
3 10 187798 187746
4 10 186814 188852
5 10 184912 188954
6 10 186207 189921
Average 187043.16 188533.5
Tablet average weight 291.7 mg
Standard weight 10 mg
Sample weight 14.5 mg
Label amount 200 mg
Standard purity 100.01 %
Assay 99.80 %
Figure no 3: chromatogram of sample of Pirfenidone Figure no 4: chromatogram of standard of Pirfenidone
CONCLUSION
The Pirfenidone is an antifibrotic, anti-inflammatory and antioxidant agent having high solubility and high permeability. A simple, rapid, selective, precise and accurate HPLC method has been developed for the estimation of Pirfenidone in bulk drugs and its tablet dosage form. λ max of Pirfenidone in water was found to be 311 nm. λ max of Pirfenidone in ACN was found to be 317 nm. Acn was used as a diluent for sample preparation. The developed method was optimized to get reproducible results with minimum run time. The stationary phase was C18 (250 × 4.6 mm,
5 µm), mobile phase was Acn: methanol: water (65:15:20), flow rate (1.0 ml/min), injection volume (10 μl), PDA detection is at λ max 317 nm and run time was 6 minute. This method is validated for specificity (selectivity), linearity (range), Precision (System, method, intermediate), Accuracy (recovery), robustness, filter suitability which was found to be within the specified limit. Influence of acid, alkaline, oxidative, thermal and photolytic stress conditions on Pirfenidone was studied. Results indicated that Pirfenidone is unstable in solution form after suitable time period. The results of the developed method indicates that, this method may be used into routine analysis for the determination of assay in Pirfenidone tablet dosage form.
REFERENCES
1. https://www.drugbank.ca/drugs/DB04951
2. https://pubchem.ncbi.nlm.nih.gov/compound/pirfenidone 3.
https://www.drugdevelopment- technology.com/projects/pirfenidone-treatment-for-idiopathic-pulmonary-fibrosis/
4. ICH-Q2 (R1): Validation of Analytical Procedures: Text and Methodology, FDA, 27 October, 1994
5. Pirfenidone for idiopathic pulmonary fibrosis: analysis of pooled data from three multinational phase 3 trials. Paul W. Noble, European Respiratory Journal 2016 47: 243-253.
6. V.K. Parmar, S.B. Desai and T. Vaja. RP-HPLC and UV spectrophotometric methods for estimation of Pirfenidone in pharmaceutical formulation. Indian journal of Pharm science-2014; 76(3): 225-229
7. Ravisankar P, Anusha Rani K, Devadasu ch, and devala Rao G. A novel validated RP-HPLC method for the determination of Pirfenidone in Pharmaceutical dosage form. Scholar’s research library- 2014; 6(4): 19-29
8. S.G. Thorat, S.P. Padmane, M.R. Tajne, A.M. Ittadwar. Development and validation of simple, rapid and sensitive UV, HPLC and HPTLC methods for estimation of Pirfenidone in tablet dosage form. Journal of the Chilean chemical society, 61, N ̊ 2 (2016)
9. Kesha desai, Alisha patel. Method development and validation for estimation of Pirfenidone by UV-Spectrophotometric and RP-HPLC in tablet dosage form. International Journal of Pharmaceutical Research; volume 7: issue 3
10.Tong S., Wang X., Jiang H, Xuegu X., Pan Y, et al. Determination of Pirfenidone in rat plasma by LC–MS-MS and its application to a pharmacokinetic study, Chromatographia, 2010; 71: 709-713.
11.Snehal Ganpat Tekawade, Dr. Ashok Pandurang Pingle, Rina Mohan Sonawane and Rutuja Prabhakar Sonare. Chromatographic method development and validation for estimation of Pirfenidone in pharmaceutical dosage form. European journal of biomedical and pharmaceutical science. Year: 2018; Volume: 5, Issue: 8, 552-558.
Cite this article as:
More Siddhant et al. Development of chromatographic method and validation for estimation of pirfenidone in bulk and pharmaceutical dosage form. Int. Res. J. Pharm. 2019;10(7):45-50 http://dx.doi.org/10.7897/2230-8407.1007216
Source of support: Nil, Conflict of interest: None Declared