For Chinese Listeners With Profound Hearing
Loss
by
Jianing WEI
Department of Phonetics and Linguistics
University College London
A thesis submitted to
the University of London
for the degree of Doctor of Philosophy
ProQuest Number: 10106705
All rights reserved
INFORMATION TO ALL USERS
The quality of this reproduction is dependent upon the quality of the copy submitted.
In the unlikely event that the author did not send a complete manuscript and there are missing pages, these will be noted. Also, if material had to be removed,
a note will indicate the deletion.
uest.
ProQuest 10106705
Published by ProQuest LLC(2016). Copyright of the Dissertation is held by the Author.
All rights reserved.
This work is protected against unauthorized copying under Title 17, United States Code. Microform Edition © ProQuest LLC.
ProQuest LLC
789 East Eisenhower Parkway P.O. Box 1346
ABSTRACT
A speech pattern processing method was developed and investigated which
provides voice fundamental frequency, voiceless frication, and speech amplitude
information for Chinese listeners with profound hearing loss.
Two broad problem areas have been investigated. The first concerned the robust
analysis of speech signals into frication, voicing, and silence regions. This task was
formulated as a pattern classifying recognition problem. The multi-layer perceptron
(MLP) method was employed in the development of the pattern classifier. In the pre
processing stage of the algorithm, an input vector was generated which consists of a set
of parameters from the output of a wide-band filter-bank, and from calculations of zero-
crossing rate, short-time energy and auto correlation of the speech signal. A feature divergence analysis method was developed and used as a guide-line for selecting useful
features from the pre-processor. Both training and testing speech data were hand-
labelled. The classifier was initially trained on anechoic speech recordings of three
speakers (two male, one female), and tested both on new recordings from the same
speakers used for training and also with speech from three other speakers.
The algorithm was then additionally further trained and tested using reverberant speech, and speech with a babble noise background. Satisfactory results were obtained
from three different recording conditions. The classifier was implemented on a
Masscomp 6000 computer, but the algorithm can be ported to real-time DSP processors.
The second task in this study concerned the investigation of the effectiveness of the speech pattern processing scheme for Chinese hearing impaired listeners as an aid to
lipreading. A facility for dubbing off-line speech pattern sounds from the Masscomp
computer onto video recordings in synchrony with the video-image was specially
developed and used in the study. Lipreading tests were then carried out using this
facility and employing the compound speech patterns of voice fundamental frequency,
voiceless frication excitation information, and amplitude information. The voice
' fundamental frequency can be obtained from the laryngograph signal or the MLP-Tx
algorithm developed in the Department, and the voiceless frication information is
extracted by the algorithm developed in this study and coded by combining aperiodic low frequency sound.
Responses from both normal and hearing impaired Chinese listeners for lexical
ABSTRACT
was used in the analysis of consonant perception. The results indicate that this speech
pattern encoding scheme is effective as an aid to lipreading when applied to tonal
ACKNOWLEDGEMENTS
This work is financially supported by the British Council Technical Co-operation
Training Department and the Chinese Educational Commission to whom the author
remains indebted
My first gratitude must go to my supervisors Professor Adrian Fourcin and Dr.
Andrew Faulkner. The work itself was only made possible through their guidance and
constructive supervision, and careful criticism.
I should also like to give my thanks to all colleagues and friends both inside and
outside the Department of Phonetics and Linguistics at UCL, for their help and support throughout the time of this work, and especially they are due to:
- Dr. Mark Huckvale for the original pattern recognition workbench software and
the speech filing system (SFS).
- Professor Zhang Jialu and his colleague Professor Qi Shiqian at Institute of
Acoustics, Academic Sinica of China, for their help in organising and providing
equipment for the lipreading tests for hearing impaired Chinese listeners.
- Dr. Deng Yuancheng at Beijing Institute of Otorhinolaryngology in finding hearing impaired subjects and his enthusiasm in this work.
- Dr. Ian Howard for providing programs for pattern formatting in the MLP training.
Many colleagues in the Department of Phonetics and Linguistics at UCL also deserve thanks for providing excellent research facilities and friendly working
environment, in particular: Dr. Stuart Rosen for providing the "score" program used to
generate confusion matrix and useful discussion at various stages of the work; Mr. Mike
Johnson for providing the SINFA program for perceptual feature analysis; Mr. Warwick
Smith for helping with using the Masscomp Computer the Sun workstation; Mr. David
Cushing, for his help in making video tapes for the lipreading tests in this study; Steven
Nevard, for his help with the audio recordings; and Mahen Goonewardane, John
Walliker for their help in providing the SiVo aid for the test in China.
To those who have made helpful comments on the early versions of this thesis,
my grateful thanks: Andrew Faulkner, Adrian Fourcin, Stuart Rosen, David Howells,
Bridget Allen, Sarah Palmer, and Shi Bo.
My appreciation also goes to the hearing impaired subjects in China for their
voluntary participation in the test, and the normal listeners and speakers in London who
ACKNOWLEDGEMENT
Dr. David Haigh and his family provided great help and encouragement in
overcoming difficulties during my first year of the course.
Joanna Burke from the British Council also provided help during my first year of
study.
Last but not least to my husband Xiaodong and my parents Dr. Nanshan Wei
A B STR A C T ... 2
A C K N O W L E D G E M E N T S ...4
TABLE OF CONTENTS... 6
LIST OF FIG U R E S ... 12
LIST OF TA B L ES...16
LIST OF PRINCIPAL SYMBOLS AND ABBREVIATIONS...18
C h a p t e r 1 I n t r o d u c t i o n 1.1 Background - The Needs of Profoundly Hearing-Impaired People... 22
1.1.1 Conventional Amplifying Hearing Aids... 23
1.1.2 Speech Processing Hearing Aids... 26
1.1.4 Tactile A ids... 28
1.1.5 Speech Processing Acoustic Aids Versus Cochlear Implants and Tactile Aids for the Profoundly Hearing Impaired... 29
1.2 Aims of the Present Study... 30
1.3 Organization of the Thesis... 32
C h a p te r 2 Signal Processing fo r H earing Im p aired People w ith Severe H earing Loss a t H igh Frequencies - L ite ra tu re Review 2.1 Aspects of Sensori-Neural Hearing Impairment...37
2.1.1 Sensitivity for Detection...37
2.1.2 Intensity Coding...38
2.1.3 Frequency Selectivity and Frequency Discrimination... 38
2.1.4 Temporal Integration and Temporal Resolution...40
2.2 Signal Processing Strategies for the Profoundly Hearing Impaired with Residual Low Frequency Hearing...41
a) Frequency Conçression... 42
b) Energy Shifting Aids...42
c) Spectrum Shifting Aids... 43
2.2.2 Speech Pattern Processing A ids... 45
Chapter 3
Modern Standard Chinese
3.1 Introduction... 483.2 Phonetic and Acoustic Description...49
3.2.1 Chinese Phonetic Alphabet P in y in ...49
3.2.2 Syllabic Structure... 50
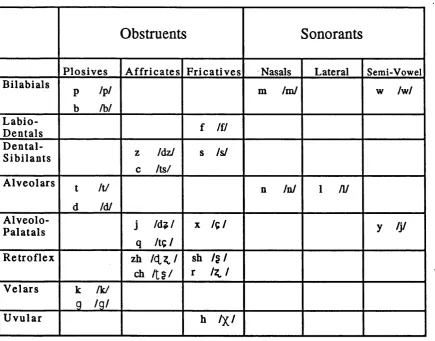
3.2.3 Initials...52
3.2.3.1 Plosives... 53
3.2.3.3 Fricatives...55
3.2.3.2 Affricates... 58
3.2.3.4 Nasals...61
3.2.3.5 Lateral... 62
3.2.3.6 Semi-Vowels...62
3.2.4 Chinese Finals...63
3.2.4.1 Simple Vowels...63
3.2.4.2 Diphthongs and Triphthongs... 67
3.2.4.3 Nasal Endings... 68
3.2.4.4 Phonotactic Constraints... 69
3.2.5 Lexical Tones...70
3.3...Intonation...72
3.4 Speech Pattern Element Extraction for Chinese Profoundly Hearing Impaired Patients -Phonetic and Perceptual Considerations... 73
3.4.1 Phonetic Aspects... 75
3.4.2 Phonotactic Aspects... 75
3.4.3 Frequency of Occurrence of Sounds Associated with Frication in Chinese... 75
Suprasegmental Feature Perception
4.1 Prosodic Information in Human Speech Perception... 79
4.1.1 Prosodic Cues... 79
4.1.2 Prosodic Information for Speech Perception by Normal and Hearing-Impaired Listeners... 81
4.2 Segmental Information for Speech Perception...90
4.2.1 Definitions... 90
4.2.2 Temporal and Spectral Information in Consonant Perception...91
4.2.2.1 Basic Consonantal Types...92
4.2.2.2 Temporal Information in Consonant Perception... 92
4.2.2.S Spectral Information in Consonant Perception... 94
4.3 Segmental and Suprasegmental Information Carried by the Simplified Speech P attern s...95
4.3.1 Introduction... 95
4.3.2 Acoustic Realization of the Simplified Speech Patterns... 96
4.3.3 Information Carried by the Simplified Speech Patterns... 98
Chapter 5
Friction Information Detection : Outline of the
Friction/Vocalic/Silence Classification Algorithm
- MLPFVS
5.1 Purpose of Frication Detection... 1035.2 Methods of Frication Detection... 105
5.3 Pattern Recognition Techniques...107
5.3.1 Definition...107
5.3.2 Basic Structure of a Conventional Pattern Classifier...108
5.3.3 Artificial Neural Networks (ANN)... 109
5.3.4 Multi-Layer Perceptron... 114
5.3.4.1 The Learning Rule... 115
5.4 Review of Pattern Recognition Techniques for Voiced / Unvoiced / Silence
Detection...123
5.4.1 Conventional Pattern Recognition Method for V/UV/S Classification... 124
5.4.2 Neural Network Approaches... 128
5.5 The MLP Algorithm for Frication/Vocalic/Silence Detection — MLP-FVS...129
5.5.1 Pre-processing... 129
5.5.2 Network Architecture... 132
5.5.3 Databases... 135
5.5.4 Training... 138
5.5.5 Performance... 139
5.5.5.1 Initial Algorithm Trained on Anechoic Speech...139
5.5.5.2 Algorithm Trained on Anechoic and Reverberant Speech 143 5.5.5.3 MLP Algorithm Trained on Anechoic, Reverberant, and Noisy Speech... 148
Chapter 6
Issues in the Development of the MLP-FVS
6.1 Feature Divergence... 1586.2 Improved Training Method for the MLP Classifier... .'... 171
Chapter 7
Chinese Lexical Tone Perception by Normal and Hearing
Impaired Listeners Using Simplified Speech Patterns
7.1 Roles and Importance of Chinese Tones in Speech Perception and Intelligibility... 1777.1.1 Segmental Aspects... 177
7.1.2 Suprasegmental Aspects... 177
7.2 Perceptual Evaluation of the Simplified Speech Patterns for Chinese Lexical Tones by Normal Listeners...180
7.2.1 Aims...180
7.2.2 Method...181
7.3.2 Subjects... 187
7.3.3 Test Conditions and Procedure... 187
7.3.4 Results and Discussions...189
Chapter 8
Evaluations of the Simplified Speech Patterns for
Chinese Consonant Perception as an aid to Lipreading
8.1 Perceptual Feature Analysis for Consonant Perception... 1958.2 Perceptual Configurations of Chinese Consonants...199
8.3 SINFA ANALYSIS... 201
8.3.1 Mathematical Basis for SINFA analysis... 202
8.3.2 Procedure of SINFA Analysis... 208
8.4 Chinese Consonant Perceptual Tests by Normal Listeners...213
8.4.1 Aims... 213
8.4.2 Method and Procedure... 213
8.4.3 Analysis of Results... 215
8.5 Chinese Consonant Tests by Hearing-Impaired Listeners...221
8.5.1 Aims... 221
8.5.2 Method and Procedures...221
8.5.3 Results and Discussion...222
Chapter 9
Lipreading Connected Speech by Hearing Impaired
Listeners — Preliminary Results
9.1 Method and Test Procedure... 2369.2 Results and Discussion...237
10.1.1 Frication Detection Method... 240
10.1.2 Perceptual Evaluation... 241
10.2 Discussion... 244
10.3 Future W ork... 245
R E FE R E N C E S...248
Appendix A Chinese Data Base for Training and Testing the MLP-FVS Classifier... 264
Appendix B Running MLP-FVS on the Masscomp Computer... 274
Appendix C Audiograms of the Hearing-Impaired Chinese Listeners...306
Appendix D Confusion Matrices for the hearing-impaired subjects... 317
Appendix E Chinese Consonant Perception Results by Normal Chinese L iste n ers...329
Appendix F Chinese Consonant Perception Results by Hearing-Impaired Chinese Listeners...353
Appendix G Dubbing Off-line Speech Pattern sounds onto Video Recordings Using the Masscomp Computer...387
Figure 2-1 Oticon TP 72 Frequency Transposition Hearing Aid... 43
Figure 2-2 The Velmans' FRED Frequency Transposition Hearing Aids. (after Velmans, 1983)... 44
Figure 2-3 The Diagram of the SiVo Hearing Aid Developed by the External Pattern Input (EPI) Group at UCL. (after Rosen & Walliker, 1987) ... 46
Figure 3-1 Chinese Syllabic Structure... 51
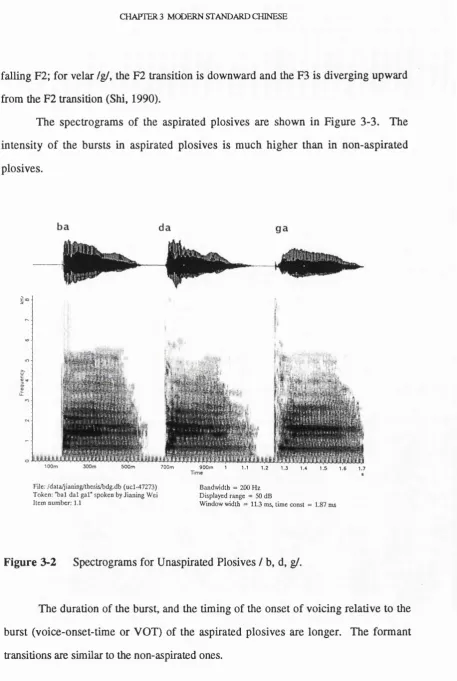
Figure 3-2 Spectrograms for Unaspirated Plosives / b, d, g/... 54
Figure 3-3 Spectrograms for Aspirated Plosives /p, t, k/... 55
Figure 3-4 Spectrograms for Fricatives f, x, s /f, ç , s/...57
Figure 3-5 Spectrograms for Fricatives sh, r, h /§, ^ , %/... 58
Figure 3-6 Spectrograms of the Affricates j, q /d?, tç/... 59
Figure 3-7 Spectrograms of the Affricates zh, ch /d ^, t§/... 60
Figure 3-8 Spectrograms of the Affricates z, c /dz, ts/... 61
Figure 3-9 Four Lexical Tones in Chinese...71
Figure 3-10 Chinese Sentence with a Low-Fall Intonation Pattern...72
Figure 3-11 The Simplified Speech Patterns for the Chinese Syllable "sha” in a Sentence...74
Figure 4-1 Simplified Speech Patterns Employed in this Study...97
Figure 4-2 The Simplified Speech Pattern (Sx+Nx)A for Plosive k'. Affricate 'ch', and Fricative 'sh', in the Sentence 'wo du ... ' (I read ...)...100
Figure 4-3 Lexical Tone Information Carried by the Sx Signal...101
Figure 5-1 Zero-Crossing Rate and Auto-Correlation of the Chinese Fricatives sh /§/, h /x/, and f /ft... .. 106
Figure 5-2 Basic Structure of a Conventional Pattern Classifier... 108
Figure 5-3 Decision Functions of Conventional Pattern Recognition Techniques... 109
Figure 5-5 Nonlinear Computational Nodes...112
Figure 5-6 Neural Net Classifiers (after Lippmann, 1987)... 113
Figure 5-7 A Multi-layer Perceptron with One Hidden Layer... 114
Figure 5-8 Single Layer Linear Classifier... 119
Figure 5-9 Two-Layer Linear Classifier... 120
Figure 5-10 Decision Regions of MLP Classifiers... 122
Figure 5-11 Decision Tree for Structuring Three-Way Decision as Three Two-Way Decisions (after Siegel & Bessey, 1982)... 126
Figure 5-12 Pre-processing Stage of the MLP-FVS Classifier... 131
Figure 5-13 Similarity of the Features from the 1st and 2nd Channels of the Filterbank ...132
Figure 5-14 Speech and the Corresponding Features from the Pre-P ro c esso r...133
Figure 5-15 The Block Diagram of the MLP-FVS Classifier...134
Figure 5-16 Architecture of the MLP-FVS Classifier...135
Figure 5-17 The Outputs of the Classifer Trained on Anechoic Speech (Model 1), and Tested on the Mechoic Testing Data...142
Figure 5-18 The Outputs of the Classifer Trained on Anechoic Speech (Model 1), and Tested on the Reverberant Testing Data...146
Figure 5-19 The Outputs of the Classifer Trained on Anechoic Speech (Model 1), and Tested on Speech in Noise... 147
Figure 5-20 Average Hit Rates of the MLP Algorithms for Frication, Voicing, and Silence...150
Figure 5-21 Average False Alarm Rates of the MLP Algorithms for Frication, Voicing, and Silence... 151
Figure 5-22 The Outputs of the Three Classifers Model 1 - Model 3 Tested on Anechoic Speech...152
Figure 5-23 The Outputs of the three Classifers Model 1 - Model 3 Tested on Anechoic Speech... 153
Figure 5-24 The Outputs of the three Classifers Model 1 - Model 3 Tested on Reverberant Speech... 154
1 (ZRJ)... 164
Figure 6-2 Feature Divergences of the Anechoic Training Data from Speaker
2 (XHL)...168
Figure 6-3 Feature Divergences of the Training Data in Different Background
C onditions...170
Figure 6-4 Relations between Gradient of Error and Weight Changes in the
MLP Network...172
Figure 6-5 Training Errors of the Three Adaptation Methods Used in this
Study...174
Figure 7-1 Four Chinese Lexical Tones... 181
Figure 7-2 Four Types of Stimuli used for the Chinese Tone Perception by
Normal Listeners... 183
Figure 7-3 The Set-Up for Tests with Stimuli Sp, Sx, and (Sx)A... 188
Figure 7-4 The Set-Up for the Test with Stimuli (Sx+Nx) A...189
Figure 7-5 % Correct Response for Lexical Tone Perception (added across
all the subjects)... 191
Figure 7-6 % Correct Responses for Lexical Tone Perception by Each
Hearing- Impaired Listeners... 191
Figure 8-1 A 3-dimensional Perceptual Configuration for Chinese
Consonants (after Zhang, 1981)...200
Figure 8-2 Subject's Stimuli / Response M atrix...202
Figure 8-3 Relationships between Information Components in a Two-Variable Case (after (Juastler, 1953)...204
Figure 8-4 Schematic Representation of Information Sharing in the Three-
Variable Case...208
Figure 8-5 Total Information Transmitted for Normal Listeners' Consonant
Perception in Three Stimulus Conditions... 218
Figure 8-6 % Correct Scores for Normal Listeners' Consonant Perception in
Four Stimulus Conditions...219
Figure 8-8 Total Information Transmitted under Three Different Conditions
by the Hearing-Impaired Listeners... 224
Figure 8-9 % Correct Scores for Hearing-Impaired Listeners’ Consonant
Perception in Four Stimulus Conditions...225
Figure 8-10 Information Transmitted for Different Perceptual Features
(Added across all the Hearing-Impaired Listeners)...227
Figure 8-11 Individual Hearing Listener's Scores of Information
Transmitted for Voicing, Manner, and Place of Articulation... 233
Figure 9-1 The Results of the Connected-Speech Lipreading Tests...238
Table 3-1 Chinese Initials... 52
Table 3-2 Chinese Finals in CPA with the Coiresponding IPA...64
Table 3-3 Seven Chinese Simple Vowels and their Allophones in CPA with their Corresponding IPA...65
Table 3-4 Chinese Diphthongs and Triphthongs...68
Table 3-5 Phonotactic Constraints of Chinese Initials and Simple Vowels... 69
Table 3-6 Phonotactic Constraints of the Chinese Initials and Finals... 70
Table 3-7 Frequency of Occurrence of the Friction Sound in Chinese...76
Table 4-1 Tone Perception Results for Normal and Hearing-impaired Listeners in Thai Language ( after Candour 1984 ) ... 88
Table 5-1 The Confusion Matrices of Input / Output Patterns of the Classifier Trained with Anechoic Speech (Voicing Threshold=0.5, Frication Threshold = 0 .5 )...140
Table 5-2 Hit Rate and False Alarm Rate of the Classifier Trained and Tested on Anechoic Speech... 141
Table 5-3 Hit Rate and False Alarm Rate of the Classifier Trained on Anechoic Speech (Model 1), Tested on Reverberant Speech, and Speech in Babble Noise with S/N=20 dB (results from speech in noise are in brackets)... 143
Table 5-4 Hit and False Alarm Rates of the Classifier Trained and Tested on Both Anechoic and Reverberant Speech (Model 2) (results fiom reverberant speech are in brackets)... 144
Table 5-5 Hit and False Alarm Rates of the Classifier Trained on Both Anechoic and Reverberant Speech (Model 2), Tested on Speech in Babble Noise (S/N=20dB)...145
Table 5-6 Hit and False Alarm Rates of the Classifier Trained and Tested on Anechoic, Reverberant Speech, and Speech in Noise (Model 3)...149
Table 7-1 The Initial, Final, Tone and Syllable Articulation in Four Transmission Conditions (after Zhang,1984a)... 178
Table 7-2 The Articulation Scores of Chinese for Four Different Excitation Sources (after Zhang, 1984a)... 179
Table 7-3 Confusion Matrices for Lexical Tone Perception by the Normal Subjects...185
Table 8-1 Information Transmitted in Bits for Composite Channel and for
Each Feature Separately (after Miller and Nicely, 1955)... 196
Table 8-2 Confusion Matrix under the Test Condition (Sx+Nx)A (added
across all the subjects)... 209
Table 8-3 Feature Matrix For Chinese Consonants... 210
Table 8-4 Feature Matrix of the Chinese Consonant Perception by Normal
Listeners for SINFA Analysis... 216
Table 8-5 Features Emerged from the SINFA Analysis of the Normal
Listener's Consonant Test Results...217
Table 8-6 Feature Matrix of the Chinese Consonant Perception by Normal
Listeners for SINFA Analysis... 222
Table 8-7 Features Emerged from the SINFA Analysis for the Hearing-
Impaired Listeners Consonant Test Results... 226
Table 8-8 Feature Matrix of Chinese Consonants Used in the Anlysis of
Individual Hearing-Impaired Listeners' Results... 228
LIST OF PRINCIPAL SYMBOLS AND ABBREVIATIONS A/D CPA DAT dB EPI exp
Fo or Fx
Final Frication Hz Initial Lipr. Ln Log Lx MLP MLP-FVS mlpw ms N.N. PCM Pinyin Sp Sx (Sx)A
Analogue to digital
Chinese Phonetic Alphabet
Digital audio tape
Decibel
External Pattern Input group at University College London
Natural exponent
Fundamental frequency (Fx refers to the fundamental frequency derived
from the Lx)
The remainder of a vocalized component of a Chinese syllable.
In this study, it refers to the turbulent noise component of sounds which
is contrastive at the phone and phoneme levels in normal phonetic
description.
Frequency in Hertz
A consonantal onset of a Chinese syllable
Lipreading Natural logarithm
Logarithm base 2
Laryngograph signal
Multi-layer perception
Multi-layer perceptron pattern classifier for frication,voicing and silence
classification
Multi-layer perception work-bench program
Millisecond
Neural network
Pulse code modulation
A quasi-phonemic Roman transcription system for Chinese
Speech waveform
Sinusoid wave triggered cycle-by-cycle by voice fundamental period,
constant amplitude.
LIST OF SYMBOLS AND ABBREVIATIONS
(Sx+Nx)A Sx plus voiceless frication information (Nx) simulated by low frequency
noise (bandwidth: 0-5(X) Hz) all amplitude modulated by speech intensity
envelope.
Tx Fundamental period
VOT Voice onset time
CHAPTER 1
INTRODUCTION
1 .1 Background - The Needs of Profoundly Hearing-Impaired People
1.1.1 Conventional Amplifying Hearing Aids
1.1.2 Speech Processing Hearing Aids
1.1.3 Electrical Cochlear Stimulation
1.1.4 Tactile Aids
1.1.5 Speech Processing Aids Versus Cochlear Implants and Tactile Aids for
the Profoundly Hearing Impaired
1 .2 Aims of the Present Study
CHAPTER 1 INTRODUCTION
CHAPTER 1
INTRODUCTION
Although this thesis is concerned with research into the possibilities afforded by
a special, speech specific, approach to the design of hearing aids, with special reference
to the needs of the profoundly hearing impaired in China, it is important to set its
broader context in relation to more conventional prostheses.
In the last 70 years hearing aid research has had varying degrees of success in
restoring hearing to people with different degrees of hearing loss. The history of
hearing aid development is also the story of reducing the hearing aid’s size and
improving its sound quality (Graham, 1987). The first electrical hearing aids were
suitcase size and it was only with the development of the transistor in the 1950s that
combined battery pack hearing aids were really widely introduced. Hearing aids with
selective amplification were first proposed in the 1940s (Radley, 1947). Since then, the
problem of hearing aid selection and evaluation has been the most controversial aspect of
audiology (Carhart, 1950). In the last 30 years, a great deal of progress has been made
in hearing aid design, especially in reducing the size of hearing aids. Much of what has
been accomplished also involves methods of a more thorough evaluation of impaired
hearing function and the subsequent skills employed in the fitting and follow-up care
afforded the user (Jerger, 1984). With the benefit of rapidly growing modern
microelectronics technology and the computer industry, signal enhancement and
processing technology has already played an increasing role in hearing aid development
This includes not only hearing aids incorporating methods for dealing with the reduced
dynamic range of the hearing impaired, but also speech-specific signal processing;
methods designed to alleviate poor speech reception in noise or reverberation; and
single/multi channel cochlear prostheses with complex speech processing.
1.1 Background - The Needs of Profoundly Hearing-Impaired People
Hearing impairment is recognized as one of the major health problems in many
countries. For many epidemiological purposes, the degree of hearing loss can be
divided into four categories: mild, moderate, severe and profound. The measure of the
average hearing loss generally used in pure tone audiometry (see section 2.1.1) is the
three-frequency average taken at 500,1000, and 2000 Hz (Davis, 1947; Working Group
on Communication Aids for the hearing-impaired, 1991). The four categories of
hearing impairment recommended by the Committee on Conservation of Hearing of the
American Academy of Ophthalmology and Otolaryngology can be described as: mild -
average hearing loss < 40 dB; moderate - average hearing loss 40-70 dB; severe -
average hearing loss 70-90 dB; and profound - average hearing loss > 90 dB (Davis,
1947; 1978).
In the U.K., the National Study of Hearing (NSH) carried out by the Institute of
Hearing Research estimated that about 7.12% of the population have a better-ear average
hearing loss greater or equal to 40 dB, - some 3 million people. The study also
estimated that 0.21 % of the population (some 100,000 people) are profoundly hearing
impaired and have an average hearing loss greater than or equal to 90 dB (Davis, 1987;
Thornton, 1986).
In China, the official survey of the disabled population indicated that about 17.7
million people suffer hearing-impairment, which is the most prevalent of the five major
categories of disablement (hearing impairment, physical disability, mental retardation,
CHAPTER 1 INTRODUCTION
Disabled, 1988). However, the United Nations Children's Fund's (UNICEF)
investigation pointed out there could be some 120 million people in China (about 10% of
the population) suffering from hearing impairment - of all degrees - mild, moderate and
profound (Dalais,1991). There are no details of the numbers falling into the subgroups
of the hearing impaired but this is not likely to be closely similar to the UK estimation.
The UNICEFs spot check surveys carried out in various parts of the country indicated
that they were 740,000 profoundly hearing impaired young children of pre-school age
(birth - 6 years). The major cause of hearing impairment in this case is the misuse of
pharmaceutical products (70% of the figure). Surveys from various audiology clinics in
China also show that ototoxicic drugs account for 50 - 80% of the hearing impairment in
the country. Furthermore, the profoundly hearing-impaired population is large. For
example about 30 - 40% of the patients at the Beijing Institute of Otorhinolaryngology,
with a patient population of more than 10,000 pre-school children and 20,(X)0 teenagers
and adults, are profoundly hearing impaired. 1 - 2% of the patients in these groups are
profoundly deafened with some residual hearing at low frequencies, but little or no
hearing at high frequencies (personal communication with Deng Yuancheng (MD), Head
of the Dept of Hearing and Speech Sciences, Beijing Institute of Otorhinolaryngology,
1991).
1.1.1 Conventional Amplifying Hearing Aids
The conventional amplifying hearing aids refers to a hearing prosthesis which
employs an acoustic amplifier with adjustable gain and specific frequency response
characteristics. Acoustic amplification via electronic circuits is the method most
commonly used to enhance the recognizability of speech and other signals with the aim
of improving communication and environmental awareness for the hearing impaired.
The approach most often used to compensate for audiometric loss of sensitivity
is "frequency shaping", which provides different amounts of amplification at different
frequencies so as to fit as much of the speech signal as possible into the residual hearing
area. One limitation of this approach is that there is no general agreement on which
frequency-gain characteristic is the optimum for hearing aid users (Humes, 1986 ;
Sullivan et al., 1988). Secondly, hearing aids are not linear, ideal amplifiers; they
introduce both distortion and noise which can be more serious in reducing speech
intelligibility than a poorly chosen frequency-gain characteristic. Furthermore, the
frequency-gain characteristic measured on a standard coupler or on an artificial ear may
be quite different from the true frequency-gain characteristic of the hearing aid when
mounted on the ear (Wallenfels, 1967; Sullivan et al., 1988).
In addition to frequency shaping, conventional aids provide protection against
excessive amplification. One form of protection is peak clipping - sometimes
unavoidable (eliminating all portions of the output of the aid that exceed some specific
level). This method introduces distortion. Another form of protection against excessive
amplification is compression amplification which can be divided into two categories: (1)
compression limiting, (2) automatic gain control (AGC) (Humes et al., 1981; Villchur,
1982).
The compression limiting method is designed to allow the hearing aid to behave
as a conventional amplifier for signals below the threshold of compression. When the
threshold is exceeded, the gain of the amplifier is reduced substantially. Automatic gain
control is designed to automatically adjust the gain of the amplifier according to the level
of input sound (Villchur, 1982).
A recent report on speech-perception aids (Working Group on Communication
Aids for the Hearing-Impaired, 1991) summarized "although frequency shaping,
CHAPTER 1 INTRODUCTION
dealing with the reduced dynamic range of the impaired ear, they have failed to yield
significant improvements in speech intelligibility for the profoundly hearing impaired
population".
Most hearing-impaired listeners who have mild to moderate hearing losses can
benefit from a conventional hearing aid. With a greater degree of hearing loss, several
factors combine to reduce the effectiveness of the conventional hearing aid. In cases of
severe-to-profound hearing loss, the damaged auditory system is often incapable of
performing sufficiently the spectral and temporal analyses of the speech signal that are
necessary for successful communication (Rosen & Fourcin,1986; Moore, 1987). These
aie some of the characteristics of sensori-neural loss which are caused by damage to the
cochlea. Secondly, one of the most common characteristics of a sensori-neural hearing
impairment is that hearing loss is greater at higher frequencies. In cases of profound
hearing loss, there is usually little or no functional hearing at high frequencies.
Furthermore, a greater hearing loss requires greater amplification to achieve
audibility. Because the threshold of discomfort does not increase as much as the
threshold of detection, the dynamic range of the profoundly impaired ear can be very
much reduced (Hawkins, 1980). Another very common complaint made by hearing
impaired users is that speech in noise, or in a reverberant room, is particularly difficult to
understand (Moore, 1987). Conventional amplification aids amplify both speech and
noise, but do not clarify speech.
The combined effects described above may render many persons with profound
hearing loss imable to derive substantial benefit from the acoustic signals provided by
conventional hearing aids. Even persons with severe hearing losses may receive only
very limited help from conventional hearing aids. As the severity of hearing loss
progresses, the aided speech recognition performance decreases using conventional aids.
Estimates of the aided performance for meaningful sentences (no visual cues) are 100%,
91% and 15% for patients with mild-to-moderate loss, severe loss, and profound loss
respectively (Working Group on Communication Aids for the Hearing-Impaired, 1991).
Due to the limitations of conventional hearing aids, especially for patients with
severe or profound hearing loss, other alternatives have been developed for such people.
These include (1) speech processing hearing aids; (2) tactile aids; and (3) cochlear
implants.
1.1.2 Speech Processing Hearing Aids
Advances in speech recognition, speech signal processing and microelectrortics
technology promise possible ways of assisting the hearing impaired by automatically
enhancing the audibility of critical speech features. A hearing aid incorporating some
degree of speech-specific signal processing can be defined as a speech-processing
hearing aid. Speech processing aids may be divided into three categories: (a) frequency-
lowering aids; (b) feature-enhancement hearing aids; (c) speech pattern/feature
extraction aids.
Frequency-lowering hearing aids map the speech energy in the high frequencies
downward to lower frequencies, because most sensori-neural hearing impaired people
have a greater hearing loss at higher frequencies (Risberg,1977; Hicks et al., 1981;
Velmans & Marcuson, 1983). Various frequency-lowering or frequency-transposition
methods will be reviewed in section 2.2.
Speech feature enhancement experimental aids employ techniques for enhancing
specific acoustic-phonetic signal components which are not easily perceived by the
hearing aid user. These techniques includes adjusting the consonant-vowel intensity
ratio (Montgomery et al., 1987), exaggerating the durational cues associated with voiced
and voiceless consonants (Revoile et al., 1986,1987), exaggerating the spectral shape
CHAPTER 1 INTRODUCTION
Structure (Suramerfield et al., 1985). Although these techniques are still at laboratory
stage, they could be incorporated into speech processing aids.
The speech pattern extraction aid is a different type of hearing aid which is at
present expressly designed for profoundly hearing-impaired people (but could be
extended to other hearing-impaired listeners). In this type of hearing aid, acoustic
speech pattern information, such as that associated with the voice fundamental
frequency, frication excitation or nasality are extracted from speech and presented
following speech pattern rules so as to make best use of the user's residual hearing
(Fourcin et al., 1979; Rosen et al., 1987; Wei et al, 1990).
The results from speech processing aids have been mixed: improvements have
been reported for some forms of signal processing and not for others, or for some
patients but not for others. More details of this type of hearing aid will be discussed in
section 2.2.2.
1.1.3 Electrical Cochlear Stimulation
Cochlear implants are electrode systems fixed surgically in or on the outer
surface of the cochlea so as to stimulate fibres of the auditory nerve. It has been found
that these fibres can be stimulated in a very large majority of profoundly or totally deaf
patients. Because such systems are not able to simulate the normal acoustic-to-neural
conversion process, the sound perceived via implants is highly unusual. But it appears
that some basic auditory information is perceivable by most of the implanted patients
(Pickett, 1986). The simplest device is a single channel system (e.g.. House et al.,
1976). The alternative to the single-channel system is the multi-channel device which
typically consists of an array of electrodes inserted into the cochlea so that each electrode
is at a different distance along the cochlear duct (e.g. Dowell et al., 1984). Electrodes
can also be placed extracochlearly. Here an electrode or electrodes is placed on the wall
of the cochlear, typically basally, in the round window niche or on the promontory, but
not actually inserted into the cochlear(Fourcin et al., 1979).
In general, cochlear stimulation can provide auditory sensations to profoundly
deafened subjects. Most subjects are able to use this electrical stimulation as an effective
aid to lipreading, whilst some, especially among those using multi-chaimel implants, are
able to perceive a good deal of speech without lipreading (Dorman, 1988).
1.1.4 Tactile Aids
The common characteristic of conventional hearing aids, speech processing aids,
and cochlear implants is that they present information to the hearing-impaired individual
by stimulating the impaired auditory system. An alternative strategy is a tactile display
based on one or more vibrators. Body sites to which tactile displays have been applied
include the finger-tip, hand, wrist, forearm.
Substantial tactile research has been conducted mainly into two types of tactile
display: (1) spectral displays; and (2) speech feature and fundamental frequency
displays.
Spectral displays (Reed et al., 1982) using tactile sensitivity employ a frequency-
to-place transformation: the outputs of the filters used to achieve the spectral
decomposition are applied to different regions of skin (Greene et al., 1983; Brooks &
Frost, 1983). Evaluations at the segmental level with the spectral display suggested that
the identification performance for vowels was superior to that for consonants (Sparks et
al., 1978).
Other research on tactile displays has been concerned with systems that extract
speech features. A number of studies have focused on the use of multi-chaimel systems
CHAPTER 1 INTRODUCTION
Single-channel displays of fundamental frequency have also been studied (Boothroyd &
Hnath, 1986). The results of Boothroyd & Hnath showed no advantage for their multi
channel system over their single-channel system.
In general, studies have shown that tactile aids can transmit limited prosodic
information, based on voice fundamental frequency, to the profoundly deafened subjects
(Grant, 1980; Plant 1986). Some studies indicate that relatively simple tactile aids may
provide an important increase in communication at a crucial period in the deaf child's
education (Goldstein et al., 1985); however, overall the results of using tactile aids are
poor, and very extended training is required before realizing their full potential.
1.1.5 Speech Processing Acoustic Aids Versus Cochlear Implants and
Tactile Aids for the Profoundly Hearing Impaired
There is a general agreement about the limitations of conventional electroacoustic
aids for cases of profound hearing loss. However, there is not such a degree of general
agreement on the relative advantages of the alternative different possible treatments for
this group of subjects. The results of single-chaimel vibrotactile systems compared with
cochlear implants and hearing aids by subjects with profound postlingual hearing loss
(Agelfors & Risberg, 1991) showed that single-chaimel tactile aids do not give sufficient
support during lipreading and that the use of a hearing aid by listeners with some
residual hearing often provided more information than cochlear implants.
The Working Group on Communication Aids for the Hearing Impaired in the
USA (1991) concluded that those with speech-ffequency losses in excess of 115 dB are
candidates either for a cochlear implant or tactile aids.
Recommendations for individuals with losses in the region 90 -115 dB (about
0.2% of the population fall into this group) are more controversial. Usually these
subjects still have residual hearing at low frequencies. Advanced microelectronics
technology has made it possible in principle to employ sophisticated speech processing
techniques in speech processing hearing aids to extract important speech patterns and
recode them into the subjects' residual hearing range. How those speech patterns can be
robustly extracted and encoded to match the available range of residual hearing are
important issues and are the main motivations of this study.
1.2 Aims of the Present Study
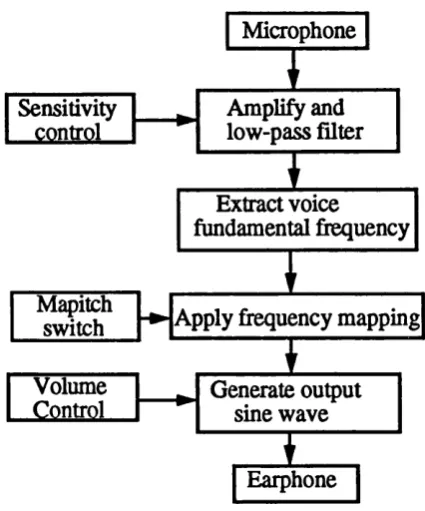
The present study is based on the SiVo (Sinusoidal Voicel aid developed at the
Department of Phonetics and Linguistics at University College London. The SiVo aid
provides voice fundamental frequency information (Fx) as an acoustic sinusoid, at the
patient's most comfortable listening level, mapped into the patient's available frequency
range. This aid is designed to aid lipreading for individuals with profound postlingual
deafness.
During the development of the SiVo aid, the perceptual ability of profoundly
hearing impaired patients has been carefully assessed (Rosen et al., 1987, 1990;
Faulkner, Fourcin & Moore, 1990b; Faulkner, Ball, Fourcin et al., 1992). Frequency
discrimination in the profoundly hearing impaired was not much worse than in normal
listeners at low frequencies (around 100-200 Hz), but much poorer than normal at
higher frequencies. Frequency selectivity is likely to be much worse than normal. It is
often absent above 500 Hz in some subjects.The auditory filter bandwidths at 125 Hz
and 250 Hz were, at best, 2 to 3 times larger than normal. These analytic abilities are
unlikely to be optimally utilized with conventional hearing aids.
Rosen and Fourcin's (1983) observations which followed earlier informal work
using the laiyngograph signal that the fundamental frequency pattern of speech presented
CHAPTER 1 INTRODUCTION
impaired people than the complete acoustic speech signal in perception of features
associated with it (voicing and intonation) led to the development of the SiVo speech
pattern processing hearing aid. Another important phenomenon from the speech-
perceptual point of view is that profoundly hearing listeners can distinguish between
periodic and aperiodic signals. This had been found in earlier eletro-cochlear studies and
a study in a single listener showed the ability to distinguish acoustic noise stimuli from a
sinusoid within her hearing range at durations of 30 - 40 ms (Rosen et al., 1987) which
indicates the potential for coding other pattern elements in addition to fundamental
frequency patterns. Amplitude information combined with these two speech patterns
also provides additional information for speech perception in English (Faulkner, Ball &
Fourcin, 1990d).
The purposes of the present study are to contribute to the further development of
the SiVo approach by:
1) developing a pattern classification algorithm that will robustly extract voiceless
frication information from speech. This frication excitation information can then be
coded within the residual hearing range of the profoundly hearing impaired.
2) investigating whether a speech-pattem based encoding scheme in which not only
voice fundamental frequency, Fx, but also voiceless frication excitation, and speech
amplitude information are encoded, will be particularly beneficial when applied to the
Chinese language.
In principle, it should be possible to improve the intelligibility of speech by
extracting acoustic/phonetic cues not easily perceived by the profoundly hearing-
impaired person. But this depends on the reliability of the speech pattern extraction
method. Robust and reliable speech component analysis is an important issue in
developing signal processing aids. If the speech pattern elements to be processed are
extracted incorrectly, the effect of the consequent erroneous cues on speech intelligibility
may be more damaging than the absence of the cues or their reduced salience. In this
study, pattern extraction algorithms are trained and tested with speech recorded in
different environments in order to improve and to assess the robustness of the method.
Speech pattern element encoding is likely to be particularly appropriate for
Chinese profoundly hearing impaired listeners because of the characteristics of the
language. Chinese is a tone language in which four tones are lexically contrastive. One
of the most significant problems for the profoundly hearing-impaired Chinese listener is
that the tones are extremely difficult (if not impossible) to lipread (Ching, 1979). In so
far as the tones are difficult to perceive with conventional amplification, a substantial
improvement would be expected by the clear supplementary provision of voice
fundamental frequency information (the most distinctive acoustic correlate of speech
tones). Another characteristic of Chinese is its essentially open syllable (C V) structure
(see section 3.2.2). All the Chinese consonants (except [g]) occur only at the beginning
of each syllable. 15 of the total 23 consonants contain a voiceless frication component
(in this study, the frication component refers to voiceless excitation in a fricative or
affricate, and burst in a plosive, see section 5.1), which due to its high frequency
energy, is unlikely to be heard by the profoundly hearing impaired. Further
improvement in consonant and connected-speech recognition for Chinese lipreaders
might thus be expected when voiceless frication excitation information is presented in
addition to that for fundamental frequency and this is also investigated.
1.3 Organization of the Thesis
The thesis is organized as follows:
Chapter 2 of the thesis first describes aspects of sensori-neural hearing
CHAPIER 1 INTRODUCTION
review of the signal processing methods for the profoundly hearing impaired follows.
This compares the various methods developed in the area, including the research being
carried out in the Department of Phonetics and Linguistics at UCL in the development of
acoustic speech pattern hearing aids.
Chapter 3 describes the phonetic and acoustic characteristics of Modem Standard
Chinese. Some particular features of the Chinese language, such as its lexical tones, and
syllable structure, which are clearly represented by the speech pattern extraction and
encoding scheme employed in this study, and which are special problems for the
Chinese profoundly hearing impaired, are discussed.
Chapter 4 provides a brief discussion of the roles of segmental and
suprasegmental information in speech perception for normal and hearing impaired
listeners. Also discussed is the phonetic and prosodic information coded in the
simplified speech pattern signals which will be employed in the perceptual tests in this
study.
Chapter 5 formulates the Frication /Voicing /Silence classification as a pattern
recognition problem. The purpose of the frication detection is first presented in this
chapter, then a brief overview of the conventional and neural network pattern recognition
techniques is given. The conventional and neural network methods for Voiced
/Unvoiced /Silence classification are reviewed and their limitations are discussed. Then
the development of the Frication /Voicing /Silence multi-layer perceptron classification
algorithm MLP-FVS, including the database, training and testing procedures, is
described in detail and quantitative results are given.
Chapter 6 investigates in greater depth the issues and problems concerning the
feature selection (pre-processing stage) for the classification algorithm, selection of
training data, and the adaptation method for the network training. A feature divergence
analysis method is proposed and the analysis is run on various training data; the results
are presented and assessed as a guide-line for selecting useful features in the
development of the classifier.
Chapters 7, 8 and 9 are concerned with perceptual tests. Chapter 7 first
describes the roles of the Chinese lexical tones in speech perception and intelligibility,
then presents perceptual evaluations of the simplified speech patterns for Chinese tone
discrimination by both normal and hearing impaired Chinese listeners.
Chapter 8 describes tests of the simplified speech pattern stimuli for Chinese
consonant perception as an aid to lipreading by normal and hearing impaired Chinese
listeners. The feature analysis method SINFA is described and used in the analysis of
the test results.
Chapter 9 gives preliminary test results of lipreading connected speech by
hearing-impaired Chinese subjects.
Chapter 10 then offers conclusions from this study and proposes future work in
the area.
The appendices contain materials that are appropriate for reference purposes.
Appendix A lists all the Chinese speech data material for training and testing the
Frication/Voicing/Silence multi-layer perceptron classification algorithm MLP-FVS.
Appendix B describes in detail the computer programs that were written for this work
and their subsequent use in the training and testing of the MLP-FVS classifier, and also
how to use the classifier for labelling speech data. The audiograms of the hearing-
impaired Chinese listeners used in this study are shown in Appendix C. The detailed
test results for Chinese lexical tone perception by the hearing-impaired Chinese subjects
are presented in Appendix D. In Appendices E and F, there then follow the confusion
matrices for Chinese consonant discrimination by normal and hearing-impaired Chinese
CHAPTER 1 INTRODUCTION
lipreading tests with the processed audio signals output from the minicomputer. This is
useful when the audio signals cannot be generated in real time by any hardware devices.
CHAPTER 2
SIGNAL PROCESSING FOR HEARING-IMPAIRED PEOPLE
WITH SEVERE HEARING LOSS AT HIGH FREQUENCIES
2 .1 Aspects of Sensori-Neural Hearing Impairment
2.1.1 Sensitivity for Detection 2.1.2 Intensity Coding
2.1.3 Frequency Selectivity and Frequency Discrimination
2.1.4 Temporal Integration and Temporal Resolution
2 .2 Signal Processing Strategies for the Profoundly Hearing-Impaired
with Residual Low Frequency Hearing
2.2.1 Frequency Recoding Hearing Aids
* Frequency Compression
* Energy Shifting Aids
* Spectrum Shifting Aids
CHAPTER 2 SIGNAL PROCESSING FOR HEARING IMPAIRED PEOPLE WITH SEVERE HEARING LOSS AT HIGH FREQUENCIES
CHAPTER 2
SIGNAL PROCESSING FOR HEARING-IMPAIRED PEOPLE
WITH SEVERE HEARING LOSS AT HIGH FREQUENCIES
In order to develop effective rehabilitative methods for hearing-impaired people,
the relationships between hearing and speech perception must be studied and applied. If
the impaired perception of phonetic features can be accounted for in terms of reduced
performance with specific acoustic cues, then this should enable individual deficits in
speech discrimination and recognition to be described in more detail and, therefore, this
knowledge could help to improve prostheses for this group. Thus this chapter begins
with the examination of hearing impairment and the consequent disability in speech
perception; then various methods of speech processing based on the details of, and
designed to reduce, these perceptual deficits will be described.
2.1 Aspects of Sensori-Neural Hearing Impairment
This section deals with auditory perception in those with sensori-neural hearing
loss, but omits discussion of conductive hearing loss, since pure conductive losses are
often successfully treated with amplification or in some cases surgery and do not
necessitate further aids to speech understanding.
2.1.1 Sensitivity for Detection
Evaluation of detection thresholds for pure tones ( pure-tone audiogram) is the
most commonly used test for hearing impairment. Thresholds for pure tones are
expressed in dB HL (decibels hearing level) and are calibrated such that the average
threshold for a normally hearing person is at 0 dB for frequencies from 0.125 -1 0 kHz.
The audiograms of the hearing-impaired listeners used for perceptual tests later in this
Study are shown in Appendix C. It can be seen that sensori-neural hearing losses are
likely to be worse in the higher frequencies. Since most consonants have their
contrastive information (e.g. formant transitions) in the high frequency region, people
with a sensori-neural hearing loss will have greater difficulties in perceiving these major
carriers of lexical information in the English language (Fry, 1976).
The sensitivity loss can be largely corrected by conventional amplification
hearing aids. But, for a number of reasons, speech discrimination scores depend only
partially upon sensitivity levels, and one has to look at other impaired perceptual
processes in order to understand the complex phenomena occurring in those with
sensori-neural hearing losses.
2.1.2 Intensity Coding
There is a dynamic range of hearing which lies between the minimum-audibility
threshold and the loudness discomfort level (LDL) (BaUantyne & Martin, 1984). LDL is
at approximately 100 dB SPL across the frequency range in normal ears. In cochlear
hearing loss, detection thresholds are elevated but LDL may remain at normal or near
normal levels. This results in a much reduced dynamic range, and as a consequence, a
diagnostic sign of cochlear hearing loss is the phenomenon of recruitment, or abnormal
loudness g ro w th. One hypothesis for the explanation of this phenomenon is related to
the marked reduction of the number of functioning receptor cells which is common in
cochlear pathology (Evans, 1975).
2.1.3 Frequency Selectivity and Frequency Discrimination
Frequency selectivity denotes the ability of the auditory system to resolve or
separate out the individual spectral components of a complex signal. The loss of
frequency selectivity relates to the broadening of auditory filters. Sensori-neural hearing
CHAPTER 2 SIGNAL PROCESSING FOR HEARING IMPAIRED PEOPLE WITH SEVERE HEARING LOSS AT HIGH FREQUENCIES
conductive hearing impaired subjects. A particular example of how this damage may be
induced is by the use of ototoxic drugs such as Kanamycin. Appendix C indicates that
most of the hearing-impaired Chinese subjects used in this study were injected with
these drugs at an early age.
One effect of the consequences of impaired frequency selectivity is to impair the
pitch perception of complex tones, and hence, the perception of intonation in speech
signals. Rosen and Fourcin (1986) give a detailed discussion of how the widening of
the auditory bandwidth affects the temporal representation of fundamental frequency
which is thought to be important for pitch perception (Moore & Glasberg, 1986).
The theory of pitch perception for complex tones that Moore and Glasberg
(1986) detail is directly applicable to the perception of the pitch of voiced speech sounds.
In their model, the pitch of complex tones is based primarily on a temporal process
preceded by an initial frequency analysis, i.e., each temporal processing chaimel
operates on the information contained in a selected frequency range defined by an
associated auditory filter.
For normal listeners, at low frequencies (where the filters have the narrowest
bandwidths) each Hlter responds primarily to a single harmonic since the harmonic
spacing is wide compared to the filter bandwidth. The temporal information in the
waveforms is then extremely simple and well defined by the peaks ( or valleys) of the
sinusoids. The high-frequency channels, however, are excited by a number of
harmonics at the same time and more complex waveforms can often be seen. It appears
that the lower resolvable harmonics dominate the perceived pitch (Plomp, 1967; Ritsma,
1967).
For some hearing impaired listeners, most of the filter bandwidths are greater
than the harmonic spacing. As a result the waveforms for most charmels are, temporally
speaking, complex. We should therefore expect a reduced ability to discriminate
fundamental frequency changes in complex tones consequent upon reduced frequency
selectivity (Rosen and Fourcin, 1986).
Speech perception is based on acoustic features that occur simultaneously, such
as the spectral formants which are present at different frequencies and which are used as
cues for phonetic discrimination. The reduction of frequency selectivity caused by the
widening of the auditory filter bandwidth will also limit the ability of the ear to resolve
the individual formants of the speech signal, and especially the ability to follow speech
in noisy situations.
F requency discrim ination is the ability of the auditory system to perceive
frequency changes. The smallest detectable change in frequency is defined as the
frequency difference limen (DLF), and used as a measure of frequency discrimination.
The DLFs of profoundly hearing impaired listeners are generally much larger than those
of normal listeners (Grant, 1987b). In his experiment, the DLFs for the hearing-
impaired subjects were approximately 36 times larger than those for normal-hearing
subjects under the condition where the amplitudes of the frequency-modulated test tones
were randomly modulated.
Measures of frequency discrimination are often thought to be closely related to
the ability to perceive pitch in speech ( Hoekstra & Ritsma, 1977), since the
deterioration in frequency discrimination may cause difficulty in following changes in
Fx.
2.1.4 Temporal Integration and Temporal Resolution
Tem poral integration is concerned with the contributions of duration and
intensity to the detectability of a signal. It may be assessed by obtaining measures of
threshold as a function of stimulus duratioiL
Temporal resolution refers to the minimum time required to resolve acoustic
CHAPTER 2 SIGNAL PROCESSING FOR HEARING IMPAIRED PEOPLE WITH SEVERE HEARING LOSS AT HIGH FREQUENCIES
listeners have to detect the presence of a temporal gap in a burst of noise. Temporal
difference limen ( the increment in duration necessary to detect a difference in the
duration of a noise burst ) and ge^? difference limen ( the increment in duration necessary
to detect a difference in the duration of a silent interval between two noise bursts) can
also be used as measures of auditory temporal processing ability.
Tyler et al. (1982) found that, in general, most hearing-impaired subjects
performed significantly less well than normals in temporal processing ability tests.
Speech identification in noise, and identification and discrimination of synthetic speech
stimuli varying in voice-onset time (VOX) were measured in his study. VOX is the onset
of voicing relative to the onset release of burst in stop consonants. It is one of the major
parameters distinguishing voiced and voiceless stop consonants and is a temporal
parameter. The authors found that the discrimination of synthetic syllables that differ in
their VOX is reduced in hearing impaired listeners. The consonants could not be
identified by the listeners with reduced temporal processing ability when the durations in
time were short The hearing impaired group made about twice as many errors as the
normally hearing group on each of the consonant features of place, manner and voicing
when identifying speech in noise. Increased thresholds were found to correlate
significantly with reduced speech intelligibility in noise.
2.2 Signal Processing Strategies for the Profoundly Hearing Impaired
with Residual Low Frequency Hearing
For several decades, investigators have attempted to lower the spectrum of
speech to match the residual hearing of listeners with little or no hearing at high
frequencies, in order to improve the intelligibility of speech. A number of frequency-
lowering systems have been developed over the years and can be divided into two broad
categories : (1) frequency-recoding hearing aids; and (2) speech pattern processing aids.
2.2.1 Frequency Recoding Hearing Aids
In frequency recoding aids the whole or part of the speech spectrum is recoded to
cover a new frequency region which is within the subject's residual hearing range.
Three of the most common forms of frequency recoding methods are frequency
compression, energy shifting (distortion generation), and spectrum shifting.
a) Frequency Compression
In frequency compression aids the whole frequency spectrum of speech is
compressed to fit into the low-frequency residual hearing of the subject The technique
proposed by Hicks et al. (1981) achieves pitch-invariant frequency lowering with non-
uniform compression of the short-term spectral envelope, which involves four steps:
segmentation, warping, dilation and time aliasing, and resynthesis.
The effects of the pitch-invariant frequency compression technique were studied
in four listeners with high-frequency sensori-neural loss (Reed et al., 1985). The results
of consonant-vowel discrimination and identification experiments did not indicate any
advantage for frequency compression over linear amplification. This may be because
this technique requires good frequency selectivity ability in a subject, but these subjects
receive a lot of help from a conventional hearing aid and it is, therefore, unlikely that
they will use a recoding aid of this type.
b) Energy Shifting Aids
In the energy shifting aids, high-frequency energy is transformed into low-
frequency energy but no attempt is made to shape the spectrum of the shifted energy.
CHAPTER 2 SIGNAL PROCESSING FOR HEARING IMPAIRED PEOPLE WITH SEVERE HEARING LOSS AT HIGH FREQUENCIES
manufactured by Oticon . The diagram of the Oticon TP 72 frequency transposer is
shown in figure 2-1:
Oticon TP 72
fs + N"
/ Amplifier Amplifier
High pass 4 kHz
Non-linear atage
Low pass 1.5 kHz
Figure 2-1 Oticon TP 72 Frequency Transposition Hearing Aid.
The Oticon system feeds signals in the 4-8 kHz region into a non-linear circuit
This converts the signal into a broad band noise. A low-pass filter then selects only that
portion of noise that falls below 1.5 kHz, and this noise constitutes the recoded signal.
Nine subjects with moderate to profound sensori-neural hearing loss were
trained and tested with the Oticon frequency transposition aid (Foust & Gengel, 1973).
The results indicated that some subjects after a reasonable amount of training, could
receive additional benefit (6-10%) from the transposer (relative to conventional
amplification). Although some statistically significant differences were found favouring
the transposer, the magnitude of the differences was small. A major complaint about the
transposer was that it was very sensitive to noise.
c) Spectrum Shifting Aids
In the spectrum shifting aids, the high-frequency sounds are recoded in such a
way that spectrum differences are presented in the low-frequency band. An example of
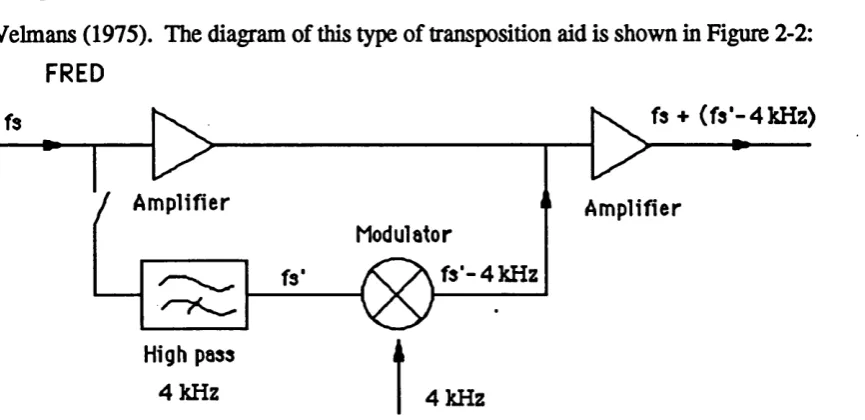
the spectrum shifting aids is the Frequency REcoding Device (FRED) developed by
Velmans (1975). The diagram of this type of transposition aid is shown in Figure 2-2:
FRED
S ^ f s + (fa * -4 kHz)
j Amplifier Amplifier
Modulator
f s '- 4 k H z
High pass
4 kHz 4 kHz
Figure 2-2 The Velmans' FRED Frequency Transposition Hearing Aids, (after
Velmans, 1983)
Both the Oticon TP 72 and FRED systems have a conventional amplifying
chaimel as well as a transposing chaimel and both systems select the region 4-8 kHz for
transposition. The systems differ only in their mode of transposition (see Figure 2-1
and 2-2). The FRED system subtracts a constant 4 kHz from every frequency
component of signals falling in the 4-8 kHz region. This shifts the signals down the
frequency axis but leaves their relative spectral envelope and their energy distribution
over time unaltered.
An evaluation study by Velmans (1975) has shown that some subjects can use
the shifted spectrum information for identification of a small number of fricatives. These
subjects had moderate hearing losses. Further investigation comparing the FRED aid
and conventional amplification was carried out using 29 subjects with various
formations of high frequency hearing loss (D. Vickers, personal communication, 1991).
The results showed that only a few (five) subjects obtained some improvement in the
perception of consonants, but most subjects' identification of environmental sounds