Pharmacogenomics and Personalized Medicine
Dove
press
O r i g i n a l r e s e a r c h open access to scientific and medical research
Open access Full Text article
CYP19A1
single nucleotide polymorphism
associations with cYP19a1, nF
κ
B1, and il6 gene
expression in human normal colon and normal
liver samples
rosalind B Penney1
abbie lundgreen2
aiwei Yao-Borengasser3
Vineetha K edavana3
suzanne Williams3
ishwori Dhakal4
roger K Wolff2
susan Kadlubar3
Martha l slattery2
1Department of environmental and Occupational health, University of arkansas for Medical sciences, little rock, ar, 2Department of internal Medicine, University of Utah health sciences center, salt lake city, UT, 3Division of Medical genetics, University of arkansas for Medical sciences, little rock, ar, 4Department of Biostatistics, University of arkansas for Medical sciences, little rock, ar, Usa
correspondence: susan Kadlubar University of arkansas for Medical sciences, 4301 W Markham, #580, little rock, ar 72205, Usa Tel +1 501 526 7957 email [email protected]
Background: Estrogen is known to decrease the risk of colon cancer in postmenopausal women, and may exert its actions by decreasing interleukin-6 (IL6) production via stabilization of the transcription factor nuclear factor kappa-light-chain-enhancer of activated B cells (NFκB). Estrogens are biosynthesized by CYP19A1 (aromatase), so it is possible that genetic variations in CYP19A1 influences the risk of colon cancer by altering expression of CYP19A1. Further, studies on gene-gene interactions suggest that single nucleotide polymorphisms in one gene may affect expression of other genes. The current study aims to explore the role of CYP19A1 single nucleotide polymorphisms on CYP19A1, NFκB1 and IL6 gene expression.
Methods: Phenotype–genotype associations, cross-associations between genes, and haplotype analyses were performed in both normal human colon (n=82) and liver (n=238) samples.
Results: CYP19A1 rs10459592, rs1961177, and rs6493497 were associated with CYP19A1 expression in colon samples (P=0.042, P=0.041, and P=0.013, respectively). CYP19A1 single nucleotide polymorphisms (rs12908960, rs730154, rs8025191, and rs17523880) were cor-related with NFκB1 expression (P=0.047, P=0.04, P=0.05, and P=0.03, respectively), and
CYP19A1 rs11856927, rs2470152, and rs2470144 (P=0.049, P=0.025, P=0.047, respectively) were associated with IL6 expression in the colon. While rs730154 and rs17523880 could not be analyzed in the liver samples, none of the other associations with the colon were replicated in the liver samples. Haplotype analysis revealed three separate haplotypes of the CYP19A1 single nucleotide polymorphism that were significantly associated with CYP19A1, NFκB1, and IL6 gene expression.
Conclusion: CYP19A1 single nucleotide polymorphisms are associated not only with CYP19A1 expression but also with NFκB1 and IL6 expression. These data demonstrate the possible functional consequences of genetic variation within the CYP19A1 gene on other genes in a biologically plausible pathway.
Keywords: CYP19A1, NFκB1, interleukin-6, single nucleotide polymorphism, colon, liver
Introduction
Colorectal cancer is the third most common cancer and cause of cancer death in women.1
The link between estrogen and the risk of colon cancer has been well established.2–4
Hormone replacement therapy has been shown to decrease the risk of colon cancer in postmenopausal women,5 with two separate meta-analyses demonstrating a 20%
decrease in risk of colon cancer in ever users.6,7
One mechanism by which estrogen exerts its protective action may be via modulation of the immune system response.8 A recent study in mice indicated that estrogen suppresses
Pharmacogenomics and Personalized Medicine downloaded from https://www.dovepress.com/ by 118.70.13.36 on 26-Aug-2020
For personal use only.
Number of times this article has been viewed
This article was published in the following Dove Press journal: Pharmacogenomics and Personalized Medicine
Dovepress
Penney et al
inflammation-associated colon cancer, even after initiation of colonic DNA damage by administration of azoxymethane and dextran sulfate sodium.9 Specifically, estradiol negatively
regulates the inflammatory cytokine, interleukin-6 (IL6).10,11
It has been demonstrated that IL6 levels increase as Dukes’ stage increases in patients with colorectal cancer, so increased IL6 expression may play a role in the risk of colon cancer.12
CYP19A1 (aromatase), which facilitates the biosynthesis of estrogens, is expressed by colorectal adenocarcinoma cell lines,13 and colon carcinoma has increased expression of
CYP19A1 mRNA relative to non-neoplastic colon mucosa.14
While the mechanisms of this difference in expression have not been identified, it has been postulated that an inflamma-tory response process may be involved, with expression of IL6 and CYP19A1 activity having been positively correlated in macrophage-rich tissue15 and IL6 and other inflammatory
cytokines having been shown to increase the expression of CYP19A1. This increases local estrogen levels,16 which can
inhibit binding of nuclear factor kappa-light-chain-enhancer of activated B cells (NFκB) to inflammatory gene promoters.17
NFκB is a transcription factor that has binding sites in or near many cytokine promoter regions,18 and is closely associated
with the development of cancer, angiogenesis, invasion, and metastasis.19 NFκB is known to mediate the synthesis of IL6,20
indicating a possible feedback loop.
Single nucleotide polymorphisms (SNPs) in CYP19A1 have been linked to a risk of colon cancer.21–23 Interactions
between SNPs in pairs of genes, such as CYP19A1 and
NFκB1, have also been shown to affect the risk of colon
can-cer.22 The functionality of these associations, as determined by
gene expression, has not been explored. The primary purpose of this study was to validate findings from a large case-control study22 by exploring the gene expression functionality of (and
possible interactions between) SNPs in CYP19A1 and gene expression of CYP19A1, NFκB1, and IL6 in normal colon samples. Haplotype analysis of multiple CYP19A1 SNPs was performed to understand better the broader variation in the
CYP19A1 gene and how it may influence expression.
Materials and methods
Tissue samples
Deidentified normal frozen colon and liver tissue samples were obtained from the Cooperative Human Tissue Network and stored at −80°C. For colon tissues (n=82), 54% were from male patients and 46% were from female patients. The mean patient age was 60.48 (range 17–92) years, and the samples were from patients of Caucasian (n=51), African American (n=23), Asian (n=1), or unknown (n=7) origin.
For the liver samples (n=238), the mean patient age was 58.79 (range 1–102) years, and the samples were from patients of Caucasian (n=195), African American (n=21), Hispanic (n=2), or other/unknown (n=20) origin. Fifty-three percent of the liver samples came from male patients, 45% from female patients, and 2% from patients of unknown sex.
reverse transcription
and quantitative real-time Pcr
To increase the yield in normal colon tissue samples, total RNA was isolated utilizing Trizol reagent (Invitrogen, Grand Island, NY, USA) for homogenization, and the RNEasy Mini kit (Qiagen, Valencia, CA, USA) for isolation using a proto-col developed by Mauricio Rodriquez-Lanetty (unpublished) but with minor alterations. Briefly, tissue samples (∼25 mg) were homogenized in 150 µL of Trizol using a Bullet Blender (Next Advance, Averill Park, NY, USA) and stainless steel beads. The homogenate was placed in a new vial with 450 µL of Trizol. After adding 100 µL of chloroform, the vials were shaken, incubated for 2 minutes at room temperature, and centrifuged, after which the supernatant was placed in a new vial. An equal portion of 100% ethanol was added, and the mixture was placed in an RNEasy spin column. The RNA was washed and eluted according to the RNEasy protocol. Total DNA was isolated from normal colon samples and total RNA and DNA were isolated from normal liver tissue samples using the AllPrep DNA/RNA/Protein mini kit (Qiagen).
First strand cDNA synthesis was performed using a High Capacity RNA-to-cDNA Kit (ABI, Carlsbad, CA, USA) on 500 ng of total RNA as measured by an RNA 6000 Nano kit (Agilent, Santa Clara, CA, USA). Quantitative real-time PCR reactions were performed on a 7900HT Fast Real-Time PCR System (ABI) using Taqman primer/probe sets and
Taq-man Fast Universal PCR Master Mix no AmpErase® UNG
(ABI). Experiments were run as per the manufacturer’s protocol (except as noted) in quadruplicate on CYP19A1 colon cDNA and in triplicate on NFκB1 and IL6 cDNA and CYP19A1 liver cDNA diluted 1:10 for 50 PCR cycles. Samples were normalized to β-actin, discarding those with
β-actin cycle thresholds (Cts) that were .30 (n=12 for colon CYP19A1 analysis, n=5 for colon IL6 analysis, n=4 for colon NFκB1 analysis; and n=8 for all liver analyses). Gene of interest Cts that were $40 or that were undetermined were set to 40 (n=13 for colon CYP19A1 analysis, n=2 for colon IL6 analysis, n=86 for liver CYP19A1 analysis, and n=9 for liver IL6 analysis). Two observations were removed from the liver CYP19A1 analysis because the standard deviation among the CYP19A1 triplicates was .1; one observation was similarly
Pharmacogenomics and Personalized Medicine downloaded from https://www.dovepress.com/ by 118.70.13.36 on 26-Aug-2020
Dovepress CYP19A1 snP associations in colon and liver
removed from the liver IL6 analysis. β-actin was used as the housekeeping gene because it has been shown that structural housekeeping genes such as β-actin have less variation in normal colon and liver tissues than metabolic housekeeping genes such as glyceraldehyde 3-phosphate dehydrogenase.24
snP genotyping of colon samples
The process of choosing TagSNPs for analysis has been described previously.22 All markers were genotyped using a
multiplexed bead array assay format based on GoldenGate chemistry (Illumina, San Diego, CA, USA). A genotyping call rate of 99.93% was achieved. Blinded internal replicates repre-sented 1.6% of the sample set. The duplicate concordance rate was 99.996%. In this study, 25 SNPs from CYP19A1, eleven from NFκB1, and five from IL6 were examined.
snP genotyping of liver samples
Genotyping for SNPs found to be significant in the colon was performed using Taqman SNP Genotyping Assays (Life Technologies, Carlsbad, CA, USA) on the 7900HT Fast Real-Time PCR System (ABI). The PCR protocol was adapted as follows: AmpliTaq activation (95°) for 10 minutes, followed by 50 cycles of denature (95°) for 15 seconds and anneal (58°) for 90 seconds. Samples were automatically called with the post-PCR allelic discrimination protocol, with a genotyping success rate of .95%. One SNP (rs730154) did not have a Taqman primer available, so was not analyzed in liver samples. CYP19A1 rs17523880 was not in Hardy–Weinberg equilibrium, so was not analyzed either.
statistical analysis
effects of individual snPs on expression
Statistical analyses were performed using SAS version 9.3 software (SAS Institute, Cary, NC, USA). Tests for Hardy-Weinberg equilibrium and linkage disequilibrium measures were calculated and stratified by race using the ALLELE procedure. Median 2^∆Ct (∆Ct = control Ct – gene of interest Ct)25 values were calculated by genotype initially
assuming a codominant model, and the best fitting inheritance model is presented. P-values based on nonparametric analysis of variance tests (Wilcoxon rank-sum and Kruskal–Wallis rank-sum tests) were used to detect differences in distribution of expression levels by genotype.
haplotypes
CYP19A1 SNPs that appeared to be significantly
associ-ated (at α=0.05) with expression were used to construct haplotypes. Haplotypes were not created based on linkage
disequilibrium bins as tagSNP markers were chosen from different linkage disequilibrium bins. Haplotypes were created based on results from colon samples as follows: all CYP19A1 SNPs that were significantly associated with
CYP19A1 expression (n=3); all CYP19A1 SNPs that were significantly associated with NFκB1 expression (n=4); and all CYP19A1 SNPs that were significantly associated with
IL6 expression (n=3).
The haplotype reconstruction software, PHASE,26 was
used to predict the population frequencies and the “best pair” of haplotypes for each individual. This program provides a “best pair” of haplotypes that most likely explains the genotypes of that subject with the corresponding probability of having that particular haplotype for each individual. If haplotypes for each individual are uncertain, then the pro-gram assigns alternative pairs of haplotypes with respective probabilities. PHASE output was read into SAS version 9.3 which created one variable for each haplotype with three possible values, ie, 0 (no copies of that haplotype), 1 (one copy of that haplotype), or 2 (two copies of that haplotype). Association of each haplotype with gene expression was examined again using nonparametric analysis of variance. A P-value of less than 0.05 (two-sided) was considered to be statistically significant. Any haplotypes found to be sta-tistically significant in normal colon samples were tested in normal liver samples as well.
Results
effects of
CYP19A1
snPs
on cYP19a1 expression
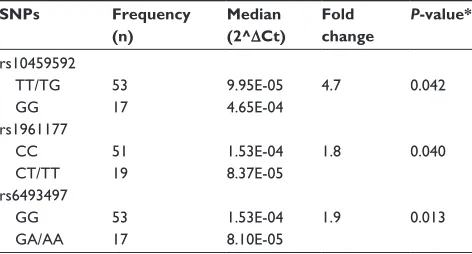
Three CYP19A1 SNPs were significantly associated with changes in gene expression in colon samples (Table 1). The
Table 1 association of cYP19a1 expression and CYP19A1 snPs in colon samples
SNPs Frequency (n)
Median (2^ΔCt)
Fold change
P-value*
rs10459592 TT/Tg gg
53 17
9.95e-05 4.65e-04
4.7 0.042
rs1961177 cc
cT/TT
51 19
1.53e-04 8.37e-05
1.8 0.040
rs6493497 gg
ga/aa
53 17
1.53e-04 8.10e-05
1.9 0.013
Notes: rs1961177 and rs6493497 r2=1 among caucasians and 0.58 among african-americans. *nonparametric analysis of variance (Kruskal–Wallis or Wilcoxon rank sum test).
Abbreviation: snPs, single nucleotide polymorphisms.
Pharmacogenomics and Personalized Medicine downloaded from https://www.dovepress.com/ by 118.70.13.36 on 26-Aug-2020
Dovepress
Penney et al
CYP19A1 rs10459592 homozygous variant genotype (GG)
was associated with 4.7-fold higher expression (P=0.042) of CYP19A1 compared with the heterozygous or homozygous common (TT/TG) genotype. The rs1961177 CT/TT genotype was associated with 1.8-fold lower gene expression (P=0.040) as compared with the CC genotype. Having one or more cop-ies of the rs6493497 variant allele (GA/AA) was associated with 1.9-fold lower (P=0.013) CYP19A1 expression. No significant associations between CYP19A1 SNPs and mRNA expression levels were found in the liver samples.
cross-associations between
CYP19A1
snPs and
NF
κ
B1
and
IL6
expression in colon samples
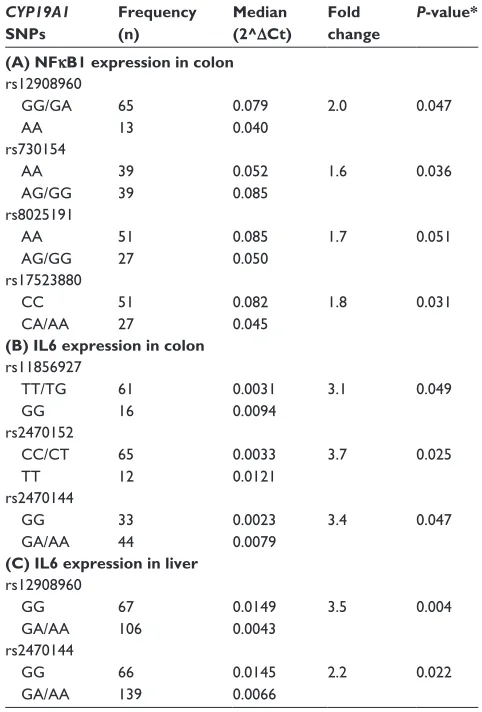
The CYP19A1 rs12908960 homozygous variant genotype (AA) was associated with 2.0-fold lower (P=0.047) NFκB1 expression as compared with the heterozygous or homozy-gous common (GG/GA) genotype. Having one or more copies of the CYP19A1 rs730154 or rs8025191 variant allele (AG/GG) was associated with 1.6-fold higher (P=0.036) and 1.7-fold lower (although this only approached significance at P=0.051) NFκB1 expression, respectively, as compared with the homozygous common (AA) genotype. Having one or more copies of the CYP19A1 rs17523880 variant allele (CA/AA) was associated with 1.8-fold lower (P=0.031) NFκB1 expression as compared with the homozygous com-mon (CC) genotype (Table 2, A).
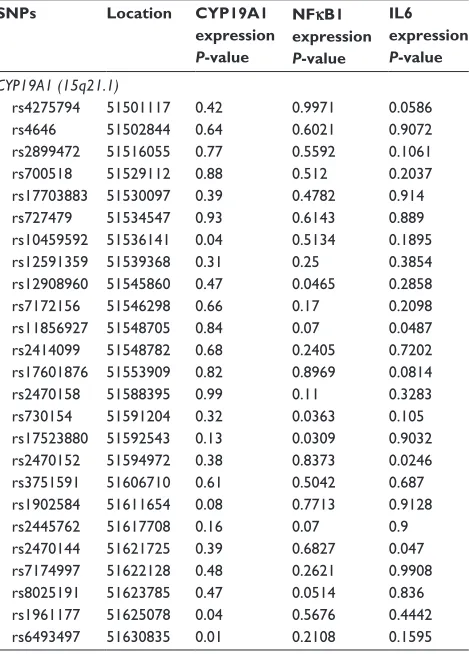
The CYP19A1 rs11856927 homozygous variant genotype (GG) was associated with 3.1-fold higher (P=0.049) IL6 expression compared with the heterozygous or homozygous common genotype (TT/TG). Having two of the variant alleles in CYP19A1 rs2470152 (TT) was associated with 3.7-fold higher (P=0.025) IL6 expression compared with the heterozy-gous or homozyheterozy-gous common genotype (CC/CT), while hav-ing one or more of the variant allele in CYP19A1 rs2470144 (GA/AA) was associated with 3.4-fold higher (P=0.047) IL6 expression (Table 2, B). A summary of P-values for all single nucleotide polymorphisms explored in colon samples can be found in Table S1.
cross-associations between
CYP19A1
snPs and
IL6
expression in liver samples
One or two copies of the variant (A) allele of CYP19A1 rs12908960 or rs2470144 was significantly associated with 3.5-fold and 2.2-fold lower IL6 expression compared with the homozygous common (GG) genotype (P=0.004 and
P=0.022, respectively, Table 2, C). A summary of P-values
for all single nucleotide polymorphisms explored in liver samples can be found in Table S2.
haplotype analysis
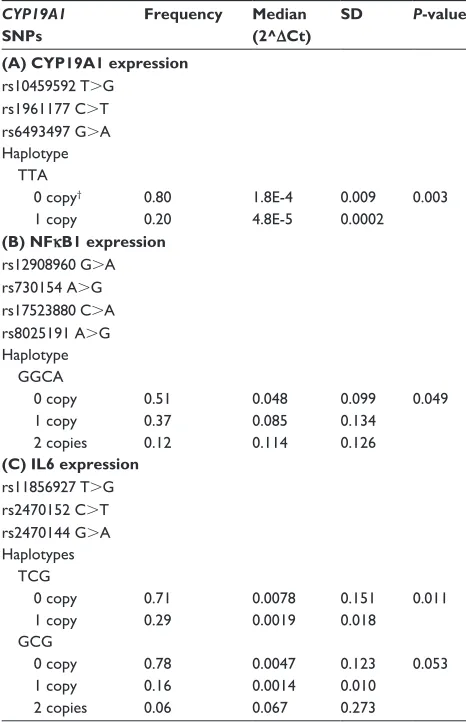
The CYP19A1 rs10459592 T.G, rs1961177 C.T, and rs6493497 G.A haplotype TTA (one copy) was sig-nificantly associated with CYP19A1 expression (P=0.003, frequency 0.20; Table 3, A). Haplotype construction of
CYP19A1 rs12908960 G.A, rs730154 A.G, rs17523880 C.A, and rs8025191 A.G demonstrated that two copies of GGCA (frequency 0.12) was associated with increased NFκB1 expression (P=0.049; Table 3, B). A single copy of another CYP19A1 haplotype (rs11856927 T.G, rs2470152 C.T, rs2470144 G.A) was associated with IL6 expres-sion (TCG, P=0.011, frequency 0.29), with a different combination of GCG approaching significance at P=0.053
Table 2 cross-associations of cYP19a1 genotypes with il6 and nFκB1 gene expression in colon and liver samples
CYP19A1 SNPs
Frequency (n)
Median (2^ΔCt)
Fold change
P-value*
(A) NFκB1 expression in colon rs12908960
gg/ga aa
65 13
0.079 0.040
2.0 0.047
rs730154 aa
ag/gg 39 39
0.052 0.085
1.6 0.036
rs8025191 aa
ag/gg 51 27
0.085 0.050
1.7 0.051
rs17523880 cc
ca/aa
51 27
0.082 0.045
1.8 0.031
(B) IL6 expression in colon rs11856927
TT/Tg gg
61 16
0.0031 0.0094
3.1 0.049
rs2470152 cc/cT
TT
65 12
0.0033 0.0121
3.7 0.025
rs2470144 gg
ga/aa
33 44
0.0023 0.0079
3.4 0.047
(C) IL6 expression in liver rs12908960
gg ga/aa
67 106
0.0149 0.0043
3.5 0.004
rs2470144 gg
ga/aa
66 139
0.0145 0.0066
2.2 0.022
Note: *nonparametric analysis of variance (Kruskal–Wallis or Wilcoxon rank sums test).
Abbreviations: il6, interleukin-6; snPs, single nucleotide polymorphisms; nFκB, nuclear factor kappa-light-chain-enhancer of activated B-cells.
Pharmacogenomics and Personalized Medicine downloaded from https://www.dovepress.com/ by 118.70.13.36 on 26-Aug-2020
Dovepress CYP19A1 snP associations in colon and liver
(Table 3, C). A summary of haplotype analyses can be found in Table S3.
Discussion
Understanding the interplay between estrogen synthesis genes and inflammatory genes may help to explain the mechanisms behind the role of estrogen in reducing the risk of colon cancer. The estrogen synthesizer CYP19A1 (aromatase, coded by the CYP19A1 gene), the transcrip-tion factor NFκB (coded by NFκB1), and the inflammatory
cytokine IL6 (coded by IL6) may work together to create a feedback loop for homeostasis. An increase in CYP19A1 would lead to an increase in estrogen, which could lead to decreased IL6 production by stabilization of NFκB. The
purpose of this study was to explore the gene expression functionality of, and possible interactions between, SNPs in
CYP19A1 and gene expression of CYP19A1, NFκB1, and IL6 in normal colon samples.
Variants in CYP19A1 (rs10459592, rs1961177, rs6493497) were significantly associated with CYP19A1 gene expression in colon samples. CYP19A1 rs1961177 has previously been associated with the risk of colon cancer and rectal cancer.22 Transcription factors and other
regula-tory molecules vary in expression across organs and tissues, resulting in tissue-specific regulation. Since the liver is the site of first-pass metabolism for many colon carcinogens, genotype–phenotype correlations in DNA and mRNA from 238 normal liver samples were also examined. In contrast with colon tissue, none of the CYP19A1 SNPs that had a sig-nificant association in the colon were sigsig-nificantly associated with CYP19A1 expression in liver samples. The differences seen for CYP19A1 SNP associations with CYP19A1 gene expression between the organs could be due to differences in expression of transcription factors and regulatory molecules between colon and liver tissues.
When cross-associations were examined in the colon,
CYP19A1 rs12908960, rs730154, rs8025191, and rs17523880
were associated with NFκB1 expression. In addition,
CYP19A1 rs11856927, rs2470152, and rs2470144 were
significantly associated with IL6 gene expression. While no single SNP in CYP19A1 influenced expression in all three genes, these data indicate there may be some cross-talk between genes that affect function. It is possible that the cross-gene associations identified could occur by chance, and rigorous mechanistic testing needs to be performed to verify these observations.
CYP19A1 SNPs found to be significant in the colon were
also explored for cross-association in the liver. CYP19A1 rs12908960 and rs2470144 were associated with IL6 expression in the liver samples. While one or more copies of the variant allele genotype (GA/AA) for rs2470144 were associated with increased expression in colon samples, the variant allele was associated with decreased expression in liver samples. Given this difference in association and the fact that no other cross-associations were found to be significant in the liver, these associations could be organ-specific.
Each of the genes is located on a separate chromosome (CYP19A1 on 15, NFκB1 on 4, and IL6 on 7). Haplotypes
were developed with CYP19A1 SNPs, and expression levels of CYP19A1, NFκB1, and IL6 mRNA were explored in colon samples. Haplotype/activity analysis demonstrated
Table 3 association of haplotypes of CYP19A1 snPs with selected gene expression in colon
CYP19A1 SNPs
Frequency Median (2^ΔCt)
SD P-value*
(A) CYP19A1 expression rs10459592 T.g
rs1961177 c.T rs6493497 g.a haplotype TTa 0 copy†
1 copy
0.80 0.20
1.8e-4 4.8e-5
0.009 0.0002
0.003
(B) NFκB1 expression rs12908960 g.a rs730154 a.g rs17523880 c.a rs8025191 a.g haplotype ggca 0 copy
1 copy 2 copies
0.51 0.37 0.12
0.048 0.085 0.114
0.099 0.134 0.126
0.049
(C) IL6 expression rs11856927 T.g rs2470152 c.T rs2470144 g.a haplotypes Tcg 0 copy
1 copy
0.71 0.29
0.0078 0.0019
0.151 0.018
0.011
gcg 0 copy
1 copy 2 copies
0.78 0.16 0.06
0.0047 0.0014 0.067
0.123 0.010 0.273
0.053
Notes: haplotypes created based on results from colon samples; *nonparametric analysis of variance (Kruskal–Wallis or Wilcoxon rank sum test); †0 copy, no copies of the haplotype; 1 copy, one copy of the haplotype; 2 copies, two copies of the haplotype.
Abbreviations: il6, interleukin-6; snPs, single nucleotide polymorphisms; nFκB, nuclear factor kappa-light-chain-enhancer of activated B-cells; sD, standard deviation.
Pharmacogenomics and Personalized Medicine downloaded from https://www.dovepress.com/ by 118.70.13.36 on 26-Aug-2020
Dovepress
Penney et al
that haplotype TTA constructed from CYP19A1 rs10459592 T.G, rs1961177 C.T, and rs6493497 G.A was associated with CYP19A1 mRNA expression. The CYP19A1 haplotype GGCA (two copies) constructed from rs12908960 G.A, rs730154 A.G, rs17523880 C.A, and rs8025191 A.G demonstrated a significant influence on expression of NFκB1. The haplotype TCG constructed from CYP19A1 rs11856927 T.G, rs2470152 C.T, and rs2470144 G.A was associated with IL6 mRNA expression. The haplotype GCG (con-structed from the same SNPs) also showed an association with IL6 mRNA expression. This association, however, only approached statistical significance (P=0.053). These data suggest that CYP19A1 SNPs, as well as haplotypes, affect NFκB1 and IL6 expression, as well as CYP19A1 expression. The CYP19A1 haplotype rs12591359, rs17523880, rs1961177, and rs3751591 was reported by Slattery et al to be associated with risk of colon cancer (global P=0.0059). This haplotype was tested in normal colon samples in our study, and one construct, ACTT, was significant (P=0.008, frequency 0.06). This finding supports the association reported by Slattery et al.22
Further studies of the coregulation of these genes and their effect on risk of colorectal cancer need to be performed in a large population sample to confirm that these are not false findings based on the small number of colon samples. Samples should also include individuals from different ethnic backgrounds. Other mechanisms also need to be considered, such as the role of transcription factors in these associations. Further study of how NFκB1 may affect the associations
shown here is warranted, as well as exploration of other suitable transcription factors. For example, the transcription factor, NF-IL6, has been associated with both CYP19A127
and (synergistically with NFκB) IL628 expression in
endome-trial stromal cells and murine P19 cells, respectively. These associations have not, however, been tested in colon samples. Future studies will include testing this transcription factor at the genetic level, as well as examining the combined effect of these genes and their SNPs on the risk of colon cancer in case-control studies.
These data demonstrate the functional consequences of genetic variation within one gene on interconnected genes within a biologically plausible pathway. They also indicate that there are cross-associations between CYP19A1 SNPs and NFκB1 and IL6 expression in colon samples, although these findings were not validated in liver samples. Further research may help to elucidate the mechanisms behind the relationships described here. Understanding the estrogen-metabolizing
CYP19A1 gene and its interactions with other pertinent genes
could lead to a better understanding of colon cancer and to more effective prevention and treatment options.
Disclosure
The authors report no conflicts of interest in this work.
References
1. US Cancer Statistics Working Group. United States Cancer Statistics: 1999–2009 incidence and mortality web-based report. 2013. Available from: http://www.cdc.gov/cancer/npcr/pdf/USCS_FactSheet.pdf. Accessed May 5, 2014.
2. Persson I, Yuen J, Bergkvist L, Schairer C. Cancer incidence and mortality in women receiving estrogen and estrogen-progestin replacement therapy – long-term follow-up of a Swedish cohort. Int J
Cancer. 1996;67(3):327–332.
3. Calle EE, Miracle-McMahill HL, Thun MJ, Heath CW Jr. Estrogen replacement therapy and risk of fatal colon cancer in a prospective cohort of postmenopausal women. J Natl Cancer Inst. 1995;87(7):517–523. 4. Mahavni V, Sood AK. Hormone replacement therapy and cancer risk.
Curr Opin Oncol. 2001;13(5):384–389.
5. Nanda K, Bastian LA, Hasselblad V, Simel DL. Hormone replacement therapy and the risk of colorectal cancer: a meta-analysis. Obstet
Gynecol. 1999;93(5 Pt 2):880–888.
6. Grodstein F, Newcomb PA, Stampfer MJ. Postmenopausal hormone therapy and the risk of colorectal cancer: a review and meta-analysis.
Am J Med. 1999;106(5):574–582.
7. Nelson HD, Humphrey LL, Nygren P, Teutsch SM, Allan JD. Postmenopausal hormone replacement therapy: scientific review.
JAMA. 2002;288(7):872–881.
8. Harnish DC, Albert LM, Leathurby Y, et al. Beneficial effects of estro-gen treatment in the HLA-B27 transestro-genic rat model of inflammatory bowel disease. Am J Physiol Gastrointest Liver Physiol. 2004;286(1): G118–G125.
9. Armstrong CM, Billimek AR, Allred KF, Sturino JM, Weeks BR, Allred CD. A novel shift in estrogen receptor expression occurs as estradiol suppresses inflammation-associated colon tumor formation.
Endocr Relat Cancer. 2013;20(4):515–525.
10. Ponce C, Torres M, Galleguillos C, et al. Nuclear factor kappaB pathway and interleukin-6 are affected in eutopic endometrium of women with endometriosis. Reproduction. 2009;137(4):727–737.
11. Deshpande R, Khalili H, Pergolizzi RG, Michael SD, Chang MD. Estradiol down-regulates LPS-induced cytokine production and NFkB activation in murine macrophages. Am J Reprod Immunol. 1997;38(1): 46–54.
12. Chung YC, Chang YF. Serum interleukin-6 levels reflect the disease status of colorectal cancer. J Surg Oncol. 2003;83(4):222–226. 13. Fiorelli G, Picariello L, Martineti V, Tonelli F, Brandi ML. Estrogen
synthesis in human colon cancer epithelial cells. J Steroid Biochem Mol
Biol. 1999;71(5–6):223–230.
14. Sato R, Suzuki T, Katayose Y, et al. Aromatase in colon carcinoma.
Anticancer Res. 2012;32(8):3069–3075.
15. Cutolo M, Sulli A, Capellino S, et al. Sex hormones influence on the immune system: basic and clinical aspects in autoimmunity. Lupus. 2004;13(9):635–638.
16. Harle P, Bongartz T, Scholmerich J, Muller-Ladner U, Straub RH. Predictive and potentially predictive factors in early arthritis: a multidisciplinary approach. Rheumatology (Oxford). 2005;44(4):426–433.
17. Xing D, Oparil S, Yu H, et al. Estrogen modulates NFkappaB signaling by enhancing IkappaBalpha levels and blocking p65 binding at the promoters of inflammatory genes via estrogen receptor-beta. PLoS
One. 2012;7(6):e36890.
18. Royds JA, Dower SK, Qwarnstrom EE, Lewis CE. Response of tumour cells to hypoxia: role of p53 and NFkB. Mol Pathol. 1998;51(2):55–61.
Pharmacogenomics and Personalized Medicine downloaded from https://www.dovepress.com/ by 118.70.13.36 on 26-Aug-2020
Dovepress CYP19A1 snP associations in colon and liver
19. Dai Y, Lawrence TS, Xu L. Overcoming cancer therapy resistance by targeting inhibitors of apoptosis proteins and nuclear factor-kappa B.
Am J Transl Res. 2009;1(1):1–15.
20. Tak PP, Firestein GS. NF-kappaB: a key role in inflammatory diseases.
J Clin Invest. 2001;107(1):7–11.
21. Curtin K, Wolff RK, Herrick JS, Abo R, Slattery ML. Exploring multilocus associations of inflammation genes and colorectal cancer risk using hapConstructor. BMC Med Genet. 2010;11:170.
22. Slattery ML, Lundgreen A, Herrick JS, et al. Variation in the CYP19A1 gene and risk of colon and rectal cancer. Cancer Causes Control. 2011;22(7):955–963.
23. Slattery ML, Wolff RK, Herrick JS, Caan BJ, Potter JD. IL6 genotypes and colon and rectal cancer. Cancer Causes Control. 2007;18(10): 1095–1105.
24. Rubie C, Kempf K, Hans J, et al. Housekeeping gene variability in normal and cancerous colorectal, pancreatic, esophageal, gastric and hepatic tissues. Mol Cell Probes. 2005;19(2):101–109.
25. Peinnequin A, Mouret C, Birot O, et al. Rat pro-inflammatory cytokine and cytokine related mRNA quantification by real-time polymerase chain reaction using SYBR green. BMC Immunol. 2004;5:3. 26. Stephens M, Smith NJ, Donnelly P. A new statistical method for
haplotype reconstruction from population data. Am J Hum Genet. 2001;68(4):978–989.
27. Yang S, Fang Z, Suzuki T, et al. Regulation of aromatase P450 expression in endometriotic and endometrial stromal cells by CCAAT/enhancer binding proteins (C/EBPs): decreased C/EBPbeta in endometriosis is associated with overexpression of aromatase. J Clin Endocrinol Metab. 2002;87(5):2336–2345.
28. Matsusaka T, Fujikawa K, Nishio Y, et al. Transcription factors NF-IL6 and NF-kappa B synergistically activate transcription of the inflammatory cytokines, interleukin 6 and interleukin 8. Proc Natl Acad
Sci U S A. 1993;90(21):10193–10197.
Pharmacogenomics and Personalized Medicine downloaded from https://www.dovepress.com/ by 118.70.13.36 on 26-Aug-2020
Dovepress
Penney et al
Table S1 association of CYP19a1, nFκB1, and il6 expression and CYP19A1, snPs in colon samples
SNPs Location CYP19A1 expression
P-value
NFκB1 expression
P-value
IL6 expression
P-value
CYP19A1 (15q21.1)
rs4275794 51501117 0.42 0.9971 0.0586
rs4646 51502844 0.64 0.6021 0.9072
rs2899472 51516055 0.77 0.5592 0.1061
rs700518 51529112 0.88 0.512 0.2037
rs17703883 51530097 0.39 0.4782 0.914
rs727479 51534547 0.93 0.6143 0.889
rs10459592 51536141 0.04 0.5134 0.1895
rs12591359 51539368 0.31 0.25 0.3854
rs12908960 51545860 0.47 0.0465 0.2858
rs7172156 51546298 0.66 0.17 0.2098
rs11856927 51548705 0.84 0.07 0.0487
rs2414099 51548782 0.68 0.2405 0.7202
rs17601876 51553909 0.82 0.8969 0.0814
rs2470158 51588395 0.99 0.11 0.3283
rs730154 51591204 0.32 0.0363 0.105
rs17523880 51592543 0.13 0.0309 0.9032
rs2470152 51594972 0.38 0.8373 0.0246
rs3751591 51606710 0.61 0.5042 0.687
rs1902584 51611654 0.08 0.7713 0.9128
rs2445762 51617708 0.16 0.07 0.9
rs2470144 51621725 0.39 0.6827 0.047
rs7174997 51622128 0.48 0.2621 0.9908
rs8025191 51623785 0.47 0.0514 0.836
rs1961177 51625078 0.04 0.5676 0.4442
rs6493497 51630835 0.01 0.2108 0.1595
Abbreviations: il6, interleukin-6; snPs, single nucleotide polymorphisms; nFκB, nuclear factor kappa-light-chain-enhancer of activated B-cells.
Table S2 association of cYP19a1, nFκB1, and il6 expression and CYP19A1 snPs in liver samples
SNPs CYP19A1 expression
P-value
NFκB1 expression
P-value
IL6 expression
P-value
CYP19A1
rs10459592 0.885 0.081 0.088
rs11856927 0.019 0.182 0.374
rs12908960 0.326 0.456 0.004
rs17523880 0.071 ,0.001 0.041
rs1902584 0.115 0.554 0.742
rs1961177 0.665 0.329 0.079
rs2470144 0.452 0.593 0.022
rs2470152 0.941 0.646 0.807
rs6493497 0.983 0.11 0.113
rs8025191 0.991 0.5 0.13
Abbreviations: snPs, single nucleotide polymorphisms; il6, interleukin-6; nFκB, nuclear factor kappa-light-chain-enhancer of activated B-cells.
Supplementary materials
Pharmacogenomics and Personalized Medicine downloaded from https://www.dovepress.com/ by 118.70.13.36 on 26-Aug-2020
Pharmacogenomics and Personalized Medicine
Publish your work in this journal
Submit your manuscript here: http://www.dovepress.com/pharmacogenomics-and-personalized-medicine-journal Pharmacogenomics and Personalized Medicine is an international,
peer-reviewed, open access journal characterizing the influence of genotype on pharmacology leading to the development of personalized treatment programs and individualized drug selection for improved safety, efficacy and sustainability. This journal is indexed on the American Chemical
Society’s Chemical Abstracts Service (CAS). The manuscript manage-ment system is completely online and includes a very quick and fair peer-review system, which is all easy to use. Visit http://www.dovepress. com/testimonials.php to read real quotes from published authors. Dovepress
Dove
press
CYP19A1 snP associations in colon and liver
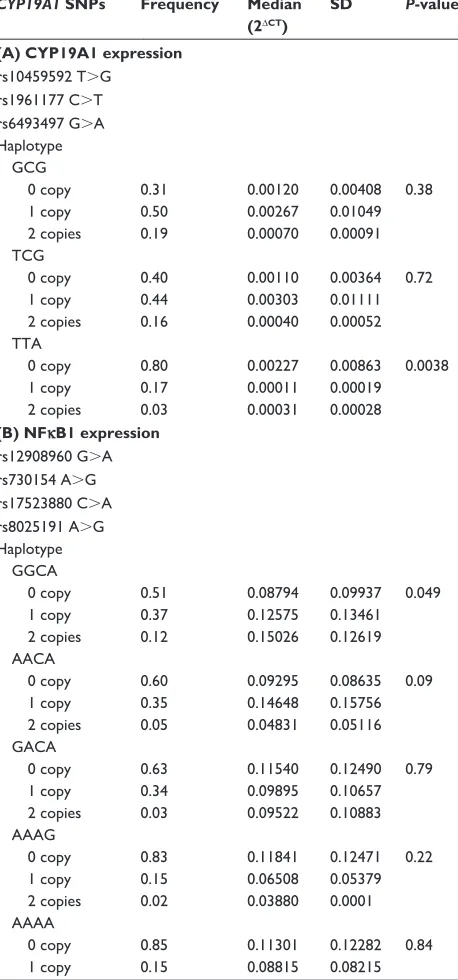
Table S3 association of haplotypes of CYP19A1 snPs with selected gene expression in colon
CYP19A1 SNPs Frequency Median
(2ΔCT)
SD P-value*
(A) CYP19A1 expression rs10459592 T.g
rs1961177 c.T rs6493497 g.a haplotype gcg 0 copy 1 copy 2 copies 0.31 0.50 0.19 0.00120 0.00267 0.00070 0.00408 0.01049 0.00091 0.38 Tcg 0 copy 1 copy 2 copies 0.40 0.44 0.16 0.00110 0.00303 0.00040 0.00364 0.01111 0.00052 0.72 TTa 0 copy 1 copy 2 copies 0.80 0.17 0.03 0.00227 0.00011 0.00031 0.00863 0.00019 0.00028 0.0038
(B) NFκB1 expression rs12908960 g.a rs730154 a.g rs17523880 c.a rs8025191 a.g haplotype ggca 0 copy 1 copy 2 copies 0.51 0.37 0.12 0.08794 0.12575 0.15026 0.09937 0.13461 0.12619 0.049 aaca 0 copy 1 copy 2 copies 0.60 0.35 0.05 0.09295 0.14648 0.04831 0.08635 0.15756 0.05116 0.09 gaca 0 copy 1 copy 2 copies 0.63 0.34 0.03 0.11540 0.09895 0.09522 0.12490 0.10657 0.10883 0.79 aaag 0 copy 1 copy 2 copies 0.83 0.15 0.02 0.11841 0.06508 0.03880 0.12471 0.05379 0.0001 0.22 aaaa 0 copy 1 copy 0.85 0.15 0.11301 0.08815 0.12282 0.08215 0.84
(Continued)
Table S3 (Continued)
CYP19A1 SNPs Frequency Median
(2ΔCT)
SD P-value*
(C) IL6 expression rs11856927 T.g rs2470152 c.T rs2470144 g.a haplotype TTg 0 copy 1 copy 2 copies 0.53 0.43 0.04 0.03375 0.05958 0.05123 0.10986 0.15508 0.08554 0.98 Tcg 0 copy 1 copy 2 copies 0.71 0.25 0.04 0.6040 0.00934 0.00138 0.15092 0.01893 0.00166 0.025 gca 0 copy 1 copy 2 copies 0.57 0.38 0.05 0.04007 0.04857 0.08305 0.10889 0.15764 0.14872 0.34 gcg 0 copy 1 copy 2 copies 0.77 0.16 0.07 0.04360 0.00644 0.16209 0.12301 0.00988 0.27339 0.053 TTa 0 copy 1 copy 0.81 0.19 0.04673 0.04045 0.13932 0.08229 0.58 Tca 0 copy 1 copy 0.92 0.08 0.04811 0.01465 0.13478 0.01784 0.44 gTg 0 copy 1 copy 0.92 0.08 0.04869 0.00778 0.13469 0.00644 0.84
Notes: haplotypes created based on results from colon samples: *non-parametric anOVa (Kruskal–Wallis or Wilcoxon rank sums test).
Abbreviations: snPs, single nucleotide polymorphisms; il6, interleukin-6; nFκB, nuclear factor kappa-light-chain-enhancer of activated B-cells; sD, standard deviation.
Pharmacogenomics and Personalized Medicine downloaded from https://www.dovepress.com/ by 118.70.13.36 on 26-Aug-2020
![4,4′ (Ethene 1,2 diyl)dipyridinium 4 [2 (pyridin 4 yl)ethenyl]pyridinium octacyanidomolybdate(V) tetrahydrate](data:image/gif;base64,R0lGODlhAQABAIAAAP///wAAACH5BAEAAAAALAAAAAABAAEAAAICRAEAOw==)