UCL
University College London
Coherent Radar Clutter Statistics
Ph.D. Thesis
Mohammed Jahangir
January 2000
All rights reserved
INFORMATION TO ALL USERS
The quality of this reproduction is dependent upon the quality of the copy submitted.
In the unlikely event that the author did not send a complete manuscript and there are missing pages, these will be noted. Also, if material had to be removed,
a note will indicate the deletion.
uest.
ProQuest U642820
Published by ProQuest LLC(2016). Copyright of the Dissertation is held by the Author.
All rights reserved.
This work is protected against unauthorized copying under Title 17, United States Code. Microform Edition © ProQuest LLC.
ProQuest LLC
789 East Eisenhower Parkway P.O. Box 1346
C oherent radar clutter statistics
Mohammed J ahangir
Ground surveillance radars have been used for a number o f years for target
detection and terrain mapping. Neither o f these tasks can be carried out without a
proper understanding o f the ground clutter statistics. Traditionally, radar signal
processing has been optimised for Gaussian interference. However, ground clutter
in high resolution systems is rarely Gaussian. Thus in this thesis the non-Gaussian
statistics o f a coherent radar sensor are investigated.
The clutter statistics are a function o f both the terrain features and the imaging
process. One o f the major influencing factors is the radar resolution ceU size. Thus
as a prerequisite to studying the clutter characteristics the theory concerning radar
resolution is discussed.
A review o f the non-Guassian clutter models is carried out and the K-
distribution is selected as a reasonable model for land clutter statistics based on
empirical evidence. However, a major drawback with the K-distribution is a lack of
efficient optimum estim ators for its parameters.
Neural nets are devised to give an optimum estimator for the order parameter
o f the K-distribution. The minimum error is obtained with a net trained on the
mean normalised log intensity and the amplitude contrast. A new estimator is pr o-
posed based on the multiple moments model. It is shown that nearly optimum pe r-
formance is achieved with the new estimator.
The parameter estimators are also investigated for a more general form o f the
K-distribution where the data statistics are such that a simple K-distribution is no
longer sufficient to describe the clutter statistics. Estimators are proposed for the
parameter values o f generaksed-K and homodyned-K based on a large order p a-
rameter approximation. Error analysis is carried out and a comparison is made
between theoretical and simulated results.
Abstract 1
Contents 2
A cknow ledgem ent 4
1 Introduction 5
1.1 Importance o f understanding clutter ... 5
1.2 O utline... 10
1.3 Novel aspects o f the research... 11
1.4 Real radar d a ta ... 12
2 Radar resolution theory 14 2.1 Range resolution... 16
2.2 Azimuth resolution... 20
2.3 Doppler resolution... 24
2.4 Summary... 27
3 Clutter m odels 28 3.1 Electromagnetic m od els... 30
3.1.1 Periodic surfaces... 30
3.1.2 Normal distributed surfaces... 32
3.1.3 Non-Gaussian surfaces... 33
3.1.4 Numerical solutions... 35
3.1.5 Other methods... 36
3.2 Statistical m odels... 37
3.2.1 Negative exponential distributed intensity... 43
3.2.2 Log-normal distributed intensity... 50
3.2.3 Weibull distributed intensity... 52
3.2.4 K-distributed intensity... 54
3.3 Summary... 63
4 K-distribution parameter estimators 65 4.1 ML estimation o f th e mean and order param eter... 66
4.2 Non-optimal estimation o f the m e a n ... 69
4.3 Non-optimal estimation of the order param eter... 71
4.3.1 Intensity contrast estimator... 74
4.3.2 Normalised log estimator... 76
4.3.3 Neural net based estimator... 79
4.3.4 Hybrid normalised log estimator... 89
4.4 Summary... 96
5 W eak scattering m odels 97 5.1 Homodyned-K distribution... 99
5.1.1 Homodyned-K amplitude statistics... 99
5.1.2 Parameter estimators for homodyned-K distribution... 104
5.2 G eneralised-K distribution... I l l 5.2.1 Generalised-K amplitude statistics... I l l 5.2.2 Parameter estimators for generalised-K distributions... 114
5.3 Summary... 117
6 C onclusion and future work 119 6.1 Background th e o ry ... 119
6.2 Forward p roblem ... 120
6.3 Strong scattering m o d e ls... 121
6.4 K-distribution parameter estimators ... 122
6.5 Weak scattering m odels... 125
6.6 Future W o rk ... 126
A Evaluation o f errors o f estim ated quantities 129
B Calculating the variance o f a parameter
(p
from a m easure Q 136C Chi-squared significance test 138
D M axim um likelihood classification 140
E P d fs o f binary operators 141
F Glossary 143
G List o f sym bols 155
I am indebted to a number o f people for their kind help and assistance without
which it would not have been possible to complete this thesis. M ost o f all I would
like to thank Dr. Chris Baker and Dr. Richard White for firstiy offering me the re
search scientist post at the Defence Evaluation Research Agency and secondly en
couraging me to undertake the external PhD at University College London. I am
grateful to Prof. Hugh Griffiths for taking me as a research student. I thank him
for all the guidance I received in my research work and the time and effort he de
voted to reviewing my written work. I especially thank him for the suggestion to
extend the parameter analysis work to weak scattering models. During the course
o f this research extensive use was made o f the neural net code developed by Mar
tin W arner and the image interpretation language, Imanip, developed by Alan
Blake at D ER A Malvern to whom I would like to extend my thanks. I am also es
pecially grateful to Dr. David BlackneU for agreeing to be my second supervisor,
he has been very generous with his time and offered tremendous guidance through
out. I would also like to acknowledge the use o f his Mathematica perturbation
routine which was modified to carry out the small perturbation results presented in
this thesis. Thanks are also extended to Prof. Chris Oliver o f D ER A Malvern for
useful comments and discussions throughout the course o f this study. I would also
like to express by thanks to Prof. Pier Lombardo o f Rome University, Prof. Maur-
izio D i Biscegke o f Naples University and D r Robert Tough o f TW Research
whose advice was sought at various stages. Finally, I wish to thank my friends for
general encouragement and my wife Sayqa for endeavouring with me through the
1. Introduction
The Concise Oxford Dictionary gives the meaning o f clutter as 'crowded confu
sion' or 'untidy state'. In a radar context clutter refers to unwanted signals - signals
which confuse the detection o f objects o f interest. In ground surveillance radar the
main objects o f interest for a military application are the man-made vehicles. The
radar is being used for target detection and in this situation the signals from sea,
ground, buildings and vegetation are considered as clutter. However, increasingly
radar is being used for terrain mapping and, in this remote sensing application, the
signals from land and sea are the ones which are o f interest. Nevertheless in this
thesis the term clutter will refer to the radar returns from land and sea irrespective
o f the application. The question arises why there is a requirement for studying
clutter characteristics. The answer to this very much depends upon the application
o f the radar. Thus there are essentially two reasons for studying clutter which fol
lows from the two distinct applications o f the ground surveillance radar, i.e. target
detection and terrain mapping. A review o f these two applications o f ground sur
veillance radar would give an appreciation for studying clutter characteristics.
1.1
Importance o f understanding clutter
The principle o f a radar is fairly straightforward. Radar is an active sensor whereby
a signal is transmitted and the energy backscattered from an object is received by
the radar antenna. The nature o f this signal provides information regarding the
object. The delay between the transmitted pulse and the received echo from the
object relates to its range. The strength o f the received echo relates to the object
size, orientation and electromagnetic properties and is an indicator for the object
type. The use o f a directional antenna allows the radar to sense the angle o f arrival
o f the received echo and this identifies the angular location o f the target.
From a target detection consideration the simplest case is where the target, the
object o f interest, is in an isolated location, with no interfering clutter. This situa
tion is typical o f airborne targets. During the second world war this usage o f the
radar was first brought into service and deployed in air defence systems for d e
tecting attacking aircraft [65]. These original radar systems were noncoherent, in
the sense that they transmitted a burst o f Radar Frequency (RF) energy and d e
tected the amplitude o f that proportion o f the signal that came back from a target
o f interest. A receiver contains other spurious signals as well which are background
electrical noise which invariably exists in the output o f a receiver. The echo re
ceived from the target wiU thus only be detected once it can be discerned above
this background electrical noise. O n a radar video image such target returns show
up as bright spots or 'blips' which are recognised by a trained human operator. In
sophisticated radars, detection is performed automatically. The received signal is
compared against a threshold and a target is registered only when it exceeds this
threshold. The system wiU have some undetected targets because o f the target sig
nal being too low and it will also have some false alarms due to the noise signal
exceeding the threshold level. The threshold is set according to the background
signal level. The criteria for the signal processing are to minimise the false alarm
rate and maximise the detection probability. W hen the target is just competing with
the noise background it is easier to set this threshold.
The task becomes more difficult when the target also has to compete with si
multaneous received echoes from interfering objects like ground. These clutter re
turns may in some instances be stronger than the noise signal and the detection
performance drops. Since clutter is always present for ground targets and for low
flying targets there could be clutter at the same range as the target, this would seri
ously limit the effectiveness o f the radar system. M odern radars overcome this
limitation by using a coherent system where the detection is based not only on the
amplitude o f the signal, but on its phase characteristics as well. The phase o f the
locity o f the target. W hen the target is moving the received, echo signal is shifted in
frequency due to the target’s Doppler effect. This enables a radar to separate the
signals from the desired moving target (such as vehicles) from stationary clutter
even though the stationary echo signal may be many orders o f magnitude greater
than the moving target. Thus coherent pulse radars use D oppler filtering to detect
moving targets; a process that is termed Moving Target Indication (MTT). G round
based systems use this method to detect both airborne and ground based moving
targets. For fixed antenna aU the returns from stationary clutter wiU be in zero
Doppler and the D oppler returns from moving targets will be generally free o f
clutter interference. The detection threshold can, therefore, be set using simplified
algorithms based on thermal noise limited data.
The clutter returns, however, do not always reside at zero Doppler. The clut
ter can have real D oppler or apparent Doppler. Real D oppler is when the clutter
has intrinsic motions. The internal clutter motions are mainly wind induced and
this produces only limited D oppler spread. Apparent D oppler is due to one o f two
reasons. A scanning antenna gives the clutter an apparent Doppler. The clutter
D oppler varies linearly along the aperture resulting in a D oppler spread. The extent
o f the spread is dependent on the scan rate and the antenna beamwidth. Secondly,
a moving platform, as in the case o f an airborne or spaceborne radar system, intro
duces an apparent D oppler for the clutter. The apparent D oppler is due to the
com ponent o f platform motion in the direction o f the clutter. Since the radar beam
has a finite width there is a spread in the D oppler frequencies o f the clutter return.
The extent o f this spread depends up on the platform velocity and also on the an
tenna pointing angle in relationship to the platform velocity vector. The widening
o f the clutter band can be quite extensive due to the high speeds o f moving plat
forms. Where the clutter D oppler spread is large, the target will only clear the
clutter dominant region o f the D oppler spectrum if it has a significant D oppler
shift. In the case o f the airborne targets where the velocities are relatively large the
targets have a significant possibility o f residing in the clutter free region o f the
D oppler spectrum. However, ground moving targets are much slower and are far
image processing, regions which are clutter dominated are discarded [82], This re
sults in a failure to detect any o f the slow moving targets. Therefore, the airborne
surveillance o f ground targets has had limited success to date despite the strategic
importance o f such systems. In order to ensure that slow moving targets can be
detected, the target detection has to be carried out in a clutter dominated back
ground. This is not possible without a full understanding o f the statistical proper
ties o f clutter. A n improved understanding o f the clutter characteristics wiU allow
us to set appropriate detection threshold in clutter dominated regions hence ex
tending the range o f velocities at which a target can be detected. Considerable
work has been done on understanding the characteristics o f land and sea clutter. A
number o f statistical models have been put forward for the clutter data [17, 41, 52,
74, 75, 82]. The bulk o f this work has been performed by empirical fitting o f distri
bution to measured data [13, 16, 27, 86, 88, 94]. However, this work has to be put
on a firmer physically based model.
The understanding o f clutter characteristics also plays a vital role in interpret
ing images o f ground-mapping radar. These radars are generally side-looking.
During flight the radar radiates a microwave beam typically at right angles to the
aircraft, then detects and records the reflections received from the earth's surface.
As it travels forwards, successive strips o f terrain are exposed to the radar beam
and are detected at the aircraft. The reflections are used to produce a map o f the
terrain covered. In these images the clutter is now the object o f interest.
There is continuous push to produce maps with finer resolution. Improved
range resolution is achieved using a narrower pulse. Im proved azimuth resolution
in conventional radar was achieved using a narrower beam either by employing a
larger antenna or using shorter wavelength. In m odern pulsed D oppler radar, azi
m uth resolution is achieved by deploying a technique called Synthetic Aperture
Radar (SAR), whereby the aircraft forward motion is utilised to synthesize a very
long antenna. This method produces near photographic quality images. High
resolution radar mapping has proved particularly useful in areas that are u n
mapped, poorly known, sparsely populated, intensively cloud covered and in areas
In order to extract useful information about the scene from such images post
processing tasks such as image segmentation and classification are carried out.
These techniques are based upon the statistics o f the underlying cross section val
ues o f the clutter [60]. An added complication with the coherent imaging process is
that there is speckle noise present. Speckle is random noise which results from the
interference o f the coherent radar echo with the surface scatterer. This speckle,
which gives a granular appearance to a SAR image, seriously degrades the image
quality. Therefore, both the statistical variation in the underlying cross section val
ues o f the background along with the statistical properties o f the speckle has to be
taken into account for the proper modelling o f the observed data. This type o f c o
herent clutter statistics analysis is not unique to the radar sensor but other coherent
imaging processes like sonar and laser have similar statistical behaviour and an
identical approach can be applied to understanding the clutter statistics from such
a scenario.
We have therefore established that studying the clutter properties is a vital Hnk
in a) the detection o f radar targets and b) the understanding and interpretation o f
images o f coherent systems. In this thesis we address this task o f characterising the
clutter model. The discussion will be based on a coherent radar system but the
modelling technique is a generic approach, applicable to other coherent imaging
methods. O ne particular example o f this is coherent sonar systems where clutter
modelling techniques, developed for radar systems, are increasingly being applied.
The clutter characterisation problem can be broken down into a num ber o f
sub-questions:
1. W hat parameterised statistical model can be used to characterise the clutter?
2. W hat physical justification is there to use the statistical models?
3. W hat are the optimal parameter solutions to the statistical model?
4. W hat are the errors associated with estimating these parameter values?
These questions comprise the main aspects o f the clutter characterisation
In the remainder o f this introductory chapter an outline plan o f the thesis is
presented, the novel aspects o f the research presented in this thesis are listed and a
brief description is given o f the radar data that will be used in later chapters.
1.2
Outline
Before we can address the task o f understanding the clutter characteristics we need
to establish a full understanding o f the imaging process. We need to know what
the parameters o f the radar systems are and what information is represented by the
data. This is a general prerequisite for interpreting any type o f data. Hence in
Chapter 2 the general theory o f radar imaging is discussed. A pulsed D oppler sys
tem and a high resolution SAR system is described, discussing in particular the im
age resolution achieved with each system. The information concerning the resolu
tion o f the system wiH be used in later chapters to devise models for the clutter
statistics.
After a brief explanation o f the radar principles we go on to address the task
o f clutter characterisation covered by the questions highlighted above. The first
two o f these questions are addressed in Chapter 3. A general review is carried out
o f the clutter modelling techniques used by various researchers. A short back
ground is given on direct modelling techniques based on the electromagnetic the
ory followed by a detailed discussion o f statistical based models used to describe
the clutter statistics. The search for a proper phenomenological based model leads
us to the K-distribution as an adequate representation o f the statistics o f medium
resolution land clutter data. Evidence from goodness-of-fit tests on SAR and MTT
data is used to justify the K-distribution model. The discussion on the K-
distribution is extended in Chapter 4 where we address the third and fourth ques
tion on clutter modelling regarding parameter estimation. Neural nets are used to
investigate optimal parameter estimators for the K-distribution. A new multi
m om ent estimator is proposed for the estimation o f the parameter o f the K-
distribution and its error analysis is carried out. It is shown that near optimal pa
In Chapter 5 we extend our discussion to high resolution clutter where the
statistics deviate from a K-distribution. Once again we address the four questions
as to what is the m ost suitable noise model and how to obtain the optimal p a
rameter estimators. We introduce weak scattering models which are a more appro
priate representation o f the scattering process when the phase o f the detected field
is not uniformly distributed. Consideration o f a random walk in a weak scattering
regime leads us to the generalised-K and the hom odyned-K distribution. Estim a
tors are proposed for the parameters o f the distributions and error analysis is car
ried out for the estimators.
Chapter 6 contains conclusions on the clutter statistics given the results in
Chapter 3 to 5. It also suggests ideas for further research.
A number o f appendices are included. Appendix A lists a complete evaluation
o f the predicted errors for the various estimators discussed in this thesis. Appendix
B contains an extended proo f o f a result referred to in the main body o f the thesis.
The details o f the chi-squared goodness-of-fit test and the maximum likelihood
classification test used in the evaluation o f real radar data are described in appendi
ces C and D respectively. Appendix E lists the output distributions o f basic binary
operators in terms o f the distributions o f their inputs; these results are required at
various stages in the main body o f the thesis. Appendix F is a glossary which
briefly defines various mathematical functions and relationships referred to in the
thesis. For ease o f reference topics listed in the glossary are printed in bold in the
main body o f the thesis wherever the reader may require further explication o f the
topic (e.g., where it is first introduced). Finally, appendix G gives a list o f symbols
used in the thesis.
1.3
N ovel aspects o f the research
The main achievement o f the results presented in this thesis is the development o f
suitable statistical models for surface clutter. N ew estimators for the m ost viable
clutter distribution models are proposed and their performance assessed using
theoretical predictions and simulated results. This work, on the main, built on the
Sur-face Surveillance group at D ERA Malvern but also drew upon the work o f the
wider radar clutter modelling research community. There are a number o f original
results presented in this thesis and these are listed as follows
• Using new SAR data for land, the K-distribution is shown to be a good em
pirical model for medium resolution system which confirmed previously
published results.
• New results are presented for the empirical fit to M TI data for land clutter
which for the first time showed that the K-distribution is also a suitable non-
Gaussian model for this case.
• Neural nets are used in a novel way to construct estimators for the t pa
rameter o f the K-distribution which outperformed existing texture measure
estimators. A key element to the success o f the neural net estimators is the
introduction o f the pre-processing stage. Thus instead o f presenting directly
the K-distributed intensity data, moments calculated from this data are pre
sented to the input layer o f the neural net which enables a much more suc
cessful convergence o f the neural nets' weights.
• A new hybrid estimator is proposed which combines the normalised log and
the amplitude contrast texture measures to give a near optimal estimator for
the t parameter o f the K-distribution. A new expression is derived for the
predicted error performance o f this estimator which is compared with
simulated results.
• The homodyned-K and the generalised-K distribution, which are candidate
distribution for weak scattering, lacked any optimal parameter estimators.
N ew results are presented which propose some simple estimators for the p a
rameters o f these distributions. The corresponding expressions for the error
predictions are derived and their performance assessed using simulations.
1.4
Real radar data
Results presented in this thesis are based on a number o f data sets from D ERA
Band Allocation
Frequency GHz Wavelength cm
C 5.25-5.35 5.71-5.62
X 9.50-9.80 3.16-3.06
Table 1.1 Frequency band allocations for radar rem ote sensing [89].
1. Single-look complex SAR data taken by the D ER A Malvern Canberra X-band
airborne system near Amesbury, Wiltshire, England.
2. Single polarisation MTI data taken by the D ER A Malvern Canberra X-band
airborne system o f the HuU area, England.
3. Single-look complex SAR data taken by the D ER A Malvern Andover C-band
airborne system near Pershore, Worcestershire, England.
The frequency allocations corresponding to the radar frequency bands referred to
above are listed in Table 1.1. Other relevant imaging parameters will be listed when
2. Radar resolution theory
Radar resolution has a significant bearing on the statistics o f the clutter returns.
Thus in this chapter, as a prerequisite to studying clutter characteristics, the theory
o f radar resolution for ground imaging surveillance systems is described. For m od
ern surveillance systems there has been continuous pressure and desire to achieve
finer resolution. There are a number o f techniques available for improving radar
resolution. An airborne system has certain limitations but there are also particular
features which can be exploited to improve radar resolution. The high resolution
techniques which are applicable to airborne surveillance systems are described in
this chapter.
The resolution o f a system can be defined as a length scale which characterises
how far apart two point targets must be for them to be distinguished as such in an
image. A com mon choice for the resolution is the width o f the main lobe o f the
point spread function (PSF) [70]. However, this is only a nominal resolution as the
actual ability to resolve two scatterers depends upon their relative cross-section and
phase difference [69]. Nevertheless, for the purpose o f the discussion here we wiU
treat this nominal resolution as the system resolution.
Figure 2.1 shows a typical geometry for a sideways-looking radar m ounted on
an airborne platform. The aircraft flies along a straight line track. The direction o f
flight is known as the along-track or azimuth direction and the direction perpen
dicular to this is known as the cross-track or range direction. As the aircraft flies
along its track, it emits a continuous train o f radar pulses. Each radar pulse
a£.
ac
RAN G E V SWATH
-^AZIM UTH BEAMW IDTH
Figure 2.1: G eom etry o f an airborne sideways-looking radar
nates the ground over a region determined by the antenna beamwidth. As a rule o f
thumb, the beamwidth o f an antenna o f length D is [83]
Iff = I D (2.1)
where À is the radar wavelength. Typically the antenna is rectangular with dim en
sions X Dg, where a and e denote azimuth and elevation, respectively. Thus
the antenna footprint has both a range and azimuth extent given by (2.1). These
two spatial components make up the two-dimensional radar image. The range
resolution o f a sideways-looking radar is discussed in Section 2.1. The range reso
resolution requires larger bandwidth which can be achieved by using frequency
modulation. W hen linear modulation (i.e., a chirp pulse) is used the system re
sponse is described by a sine function, provided no amplitude taper is used. The
azimuth resolution for a real aperture antenna is described in Section 2.2. The azi
m uth resolution is inversely proportional to the aperture o f the antenna expressed
as num ber o f wavelengths. Higher azimuth resolution is achieved using SAR tech
niques. The azimuth resolution for a fully focused synthetic aperture is equal to
half the real aperture length, and the system response is described by a sine func
tion.
A n alternative to the two-dimensional spatial image is to represent the re
ceived signal as a range D oppler map. The D oppler data is obtained by a frequency
transformation o f the azimuth data. The Doppler o f a target is proportional to its
radial velocity towards the radar. This feature is exploited in coherent M TI radars
to separate the echoes o f moving targets from stationary clutter. The clutter echoes
also have a D oppler return determined by the platform speed, the antenna beam
width and the antenna pointing direction. Section 2.3 discusses the D oppler reso
lution in an MTI system. The D oppler resolution is equal to the reciprocal o f the
coherent integration time. The total width o f the D oppler spectrum is given by the
Pulse Repetition Frequency (FRF).
The imaging geometry will assume a flat earth model. This is valid for airborne
surveillance radar operating over a narrow swath width. However, surveillance
systems which operate at a very long range, for example spaceborne surveillance
radars, the imaging geometry must also take into account the Earth’s curvature and
rotation, and the satellite orbit [25, 66]. However, these factors are not considered
further since they affect only the details o f the range and azimuth processing rather
than the general theory. The effect o f range curvature [90] will also be ignored.
2.1
Range resolution
The range com ponent o f a radar image is given by the time it takes a radar pulse to
return from the target when it is broadside. This is termed the slant range. Figure
For a pulsed radar the width o f the radar pulse determines the ability o f a radar to
resolve closely spaced targets in range. Thus for a radar with a pulse width the
slant range resolution is given as
^sr - (2 -2)
where c is the speed o f electromagnetic propagation through the atmosphere
(c ~ 3 X 10^ m /s). For an unmodulated pulse, T^is approximately related to the
bandwidth B o f the radar as B . Therefore, the slant range can be written
as
d.r=~^
(2.3)For clutter modelling, the resolution that is of interest is the corresponding ground
range resolution. For (2.3) this is given as
where B is the local incident angle o f the beam with the surface. Û changes over
the range swath o f the antenna footprint. The maximum attainable swath in the
range direction is given by the antenna elevation beamwidth y/^ . For a side looking
radar flying at a height hac and looking down at an angle 0o the maximum range
swath is [25]
S.., = h \
cot
2
y(2.5)
K W , y , , < 1
COS
y/^ -
cos 200
sin 0q
The ground range resolution varies nonlinearly across this swath. This can have
im portant consequences for image properties, particularly for spaceborne or short-
range airborne systems. The actual slant range swath, bounded by the minimum
and maximum range, is determined by the time between the pulse transmission
between the main lobe o f the elevation beam. Since transmission and reception
cannot overlap, the slant swathwidth is restricted by the PRF, and the condition
[60]
S.. <
2 x P R F
(
2
.
6
)
must hold to avoid range ambiguities. For real aperture systems there is no lower
limit on the PRF, however, for SAR systems the PRF m ust exceed a certain lower
limit (see Section 2.2).
A simple sinusoidal pulse o f length 1 fJs wiU give a slant range resolution o f
the order o f 150 m. To achieve higher range resolution would require a pulse with
a much shorter length. This would require higher transmitter peak power to m ain
tain the detection ranges. The bandwidth o f the unmodulated 1 JLls pulse is 1 MHz.
The range resolution can be improved by using frequency modulation, which in
creases the bandwidth o f the pulse without reducing the length o f the transmitted
pulse. This results in the system response in range being a sine function [45, 58, 90]
when no amplitude taper is used.
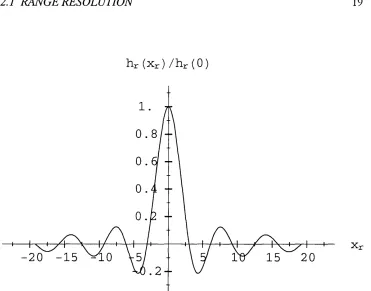
For a linear modulated pulse (i.e., a chirp) o f bandwidth B and length ',
where the frequency f { z ) at time T is given by
/ ( t i =
o '
(2.7)
and where fo is the carrier frequency, the transmitted pulse is o f the form^
p (t) = e x p
f
fo - f o r ItI < —
' 2 (2.8)
The received pulse from a point target at range is a delayed and scaled version o f
h r ( Xr ) / h r ( 0 )
1 5 2 0
Figure 2,2: Compressed chirp pulse for 5 =100 M Hz and '= 100 sec Xt
frequency and performing a correlation with a copy o f the transmitted signal (this
is known as matched filtering [63]). The output for a point target is given by [62]
.nB 2
I j- -i2expl - +
rect
y
ds
rect
r o
( r ; " J
j / y
(2.9)
where
( \ H - i
l o H > - (2.10)
The time resolution r? (related to range resolution as = cr^ /2 ) is given by the
first positive zero o f the sine function. This occurs when
B
which gives the solution for as
1
-1
- (2 .12)For high resolution systems, the time-bandmdth product is large and (2.12) ap
proximates to
(2.13)
r^ris the compressed pulse length. Using (2.13) we get the expression for the
coru-pression ratio as
T '
com pression ratio = — = (2.14)
Thus a pulse o f length \ pis using a chirp with a compression ratio o f 100 wül
have a range resolution of 1.5 m. The corresponding bandwidth is 5 = 100 MHz.
The plot o f the compressed chirp pulse for this system is shown in Figure 2.2,
where the x-axis has been converted to distance units by the substitution = C T .
2.2
Azim uth resolution
The azimuth information makes up the second com ponent in a radar image. The
azimuth resolution o f a real aperture radar is governed by its azimuth beamwidth.
The azimuth geometry o f a side looking radar imaging is illustrated by Figure 2.1.
The azimuth resolution at a slant range 7?o is given as
4 = (2.15)
Using (2.1) this gives
< i . = ^ (2.16)
The returns from a point scatterer at range Rq would be smeared out in azimuth by
T arget
<■
0
Synthetic aperture o f length
Figure 2,3: Geometry o f the illumination o f a point target across a syn
thetic aperture o f length L5.
km win have an azimuth resolution o f 150 m. For m ost imaging purposes this
resolution is very poor. The bmte force method for increasing the azimuth resolu
tion would be to a) reduce the wavelength o f the transmitted signal, and b) increase
the aperture o f the antenna. Neither o f these solutions are practical for long range
surveillance radars, the former due to high propagation losses for frequencies
higher than X-band and the latter due to the constraint on the antenna size due to
platform dimensions.
A more practical method for achieving higher azimuth resolution for a side
ways-looking radar on a moving platform is to coherently add the returns from a
series o f different positions along the line o f flight. This effectively forms a syn
thetic aperture from which this method derives the name 'synthetic aperture radar’
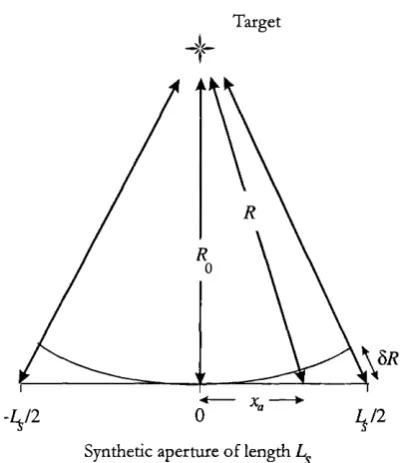
(SAR). The geometry o f the illumination o f a point target along a straight synthetic
aperture o f length Ls is shown in Figure 2.3.
As the radar beam passes over a point target, the range o f the target to the
platform changes. This produces a change in the phase o f the detected field at each
ex-pressed in terms o f its range when it is broadside to the radar platform Rq, and its
azimuth lag Xa, along the ground track o f the radar beam away from being broad
side
+ x ; (2.17)
For a narrow beam, X is only illuminated when « R^ in which case
R — Rq +
2R , (2.18)
Thus the path difference ÔR between when a target is at an azimuth lag Xa com
pared to when it is broadside o f the antenna is given by
5R =
2 & (2.19)
where the corresponding two-way phase difference (50 as a function o f azimuth lag
is given by
(50(x) =
XR, (2.20)
I f Eo is the field detected when the point target is broadside o f the antenna
then the detected field F(%g) at point Xa along the synthetic aperture is given
by
Eoexp U . < —
0
\ x \ >(2.21)
where the variations in the magnitude o f the detected field across the synthetic ap
erture are ignored. This is a valid assumption as the variation in the target’s range
across the synthetic aperture is small relative to the range itself. In the absence of
any phase correction, only those returns for which (50 is less than a fraction o f a
ceived over the full length o f the synthetic aperture can be summed together which
results in very fine azimuth resolution.
Full phase correction involves convolving the detected field with the matched
filter o f the phase difference term. The azimuth response to a point target is then
given as
K ) = p { ^ a ) *e x p (- j S ^ { - ))
=
d k l + y)exp(-
j S ^ { - y))dy
(
(2.22)
1- ^ sine
V1
-for |x^ I < , otherwise it is zero^. The output response is a distorted sine function
with the first null occurring at
1-J
= 1 (2.23)
which gives the solution for the azimuth resolution as
=
2 Le (2.24)
The maximum value for Ls is determined by the distance over which a target is
within the main beam o f the antenna. This is equal to the azimuth beamwidth.
Thus substituting for maximum Ls from (2.16), the azimuth resolution o f a fully
focused SAR is given as
(2.25)
The azimuth resolution is independent o f range and wavelength and is determined
solely by the azimuthal length o f the real aperture. Thus an X-band system with a
2-m antenna can achieve an azimuth resolution o f 1 m. The associated cost o f SAR
processing is high data storage since the Nyquist criterion demands that the sam
pling rate must exceed the resolution length [90]. This imposes a lower limit on the
PRF which then also limits the maximum slant swathwidth (see (2.6)).
The azimuth resolution, however, cannot be increased indefinitely by reducing
the real aperture size. Firstly, reducing the size will lower the gain o f the antenna
and thus the detection performance o f the radar. Secondly, the required minimum
PRF will increase, reducing the slant swathwidth [90]. Higher SAR resolution is,
however, possible with spotlight mode SAR which uses beam steering to keep the
target in the beam for a longer time and thus form a longer synthetic aperture. This
gives considerable improvement on the azimuth resolution, however at the ex
pense o f spatial coverage [17].
2.3
Doppler resolution
A target can be defined in three state variables; range, azimuth and Doppler. The
D oppler o f a target is a function o f its radial velocity toward the radar and is used
in MTI radars to form range-Doppler maps which facilitate the detection o f m ov
ing targets.
The D oppler frequency o f a target is related to its radial velocity Vt, toward
the radar, as [81]
/ , (2.26)
The maximum unambiguous D oppler is given by the PRF. In a coherent MTI
system the received pulses are processed along the azimuth direction using a one
dimensional Fast Fourier Transform (FFT) to generate a D oppler profile. The FFT
is performed for each range gate. This produces a two dimensional range-Doppler
map. The D oppler resolution is given as [83]
. P R E
where is the number o f pulses that are coherently integrated. N ^ jP R F = ,
the coherent integration time. Therefore, the D oppler resolution, and hence the
bandwidth, is given as
A (2-28)
^int
The total number o f D oppler bins is equal to the num ber o f pulses that are coher
ently integrated. The D oppler resolution is increased by extending the coherent
integration interval. For a given PRF this is achieved by increasing the num ber o f
pulses that are processed together by the FFT operation. The upper bound on tmt
is the dwell time on the target. The dwell time is a function o f antenna beamwidth,
platform velocity and antenna scan rate. Therefore, there is a trade-off between
azimuth accuracy, swath coverage and Doppler resolution. Furthermore, has to
be kept as short as possible to avoid target migrating through the resolution cells.
A typical value o f for ground surveillance radar is 0.1 sec.
For a moving platform, ground clutter also has a relative velocity toward the
radar which results in the clutter echo being shifted in Doppler. The relative clutter
velocity depends on the aircraft velocity and the direction o f the clutter relative to
the platform velocity vector. The mean value o f the clutter D oppler shift is given
by
f c = COS00 c o s 00 (2 .2 9 )
where Vac is the platform velocity, 6o is the antenna’s azimuth angle, and 0o is the
antenna’s depression angle. Since the radar footprint has a spatial extent (see Figure
2.1) the clutter spectrum has a D oppler spread. For small depression angles, the
Doppler spread from clutter returns is generally determined by the radar’s azimuth
beamwidth. The D oppler spectral width is found by subtracting the radial Doppler
frequency components, which occur at the half-power edges o f the azimuth beam
Af, =^^^cosi/>„[cos(0„ -v/^j2)-cos(e„ +V/-J2)]
2v f (^30)
^^acJo , ■ n
=
---y/^
COS 00 Sin 00for small azimuth beamwidths. An X-band airborne radar moving at 200 m /s with
a 2-m antenna at 5® depression angle and pointing sideways wiU have a clutter
spectral width due to platform motion o f 199 Hz.
The clutter D oppler spectrum is divided into a num ber o f D oppler bins d e
termined by the D oppler resolution. This has the effect o f dividing the azimuth
beamwidth into subapertures whose beamwidth is determined by the D oppler
resolution. The Doppler frequency corresponding to the A;th subaperture is given
as
U
= c o s<k
COS 0* (2.31)where 6k is the azimuth angle between the kxh subaperture and the aircraft velocity
vector. Since D oppler resolution is the frequency difference between adjacent
D oppler bins, therefore
f d = 4 . . - u = cos (j>^(cos 0^+1 - COS 0, ) (2.32)
Letting AO he the differentiating angle represented by each subaperture such that
^ A 0 /2 and = 0 ^ + A 0 / 2 , where 0m is the medium angle to the
centre o f the clutter cell and substituting in (2.32) gives
fd = cos0oA 0sin0^ (2.33)
and solving for the azimuth resolution angle gives
A0 = ---^ (2.34)
2 ’' a c / o c o s ^ > „ s i n 0 „
The D oppler processing has resulted in an azimuth resolution better than that
sharp-ening [75]. Although the azimuth resolution achieved is inferior to that o f a fully
focused SAR and it is not independent o f range, it is used in M TI radars to pro
duce simple clutter maps. For the example o f the X-band system considered ear
lier, a PRF o f 1 kHz and an FFT o f 64 pulses will give a D oppler resolution o f
16Hz. The corresponding azimuth angle resolution at 5® depression angle and
sideways-looking antenna is 0.07®. A t a slant range o f 10 km this equates to a spa
tial azimuth resolution o f 12 m. Thus in MTI radars, D oppler processing also ef
fects the size o f the radar footprint on ground which in turn has a bearing on the
statistics o f the observed scattering. Clutter models that are able to characterise the
observed scattering are discussed in the following chapter.
2.4
Summary
In this chapter
• The theory o f how a side looking radar down on a moving platform
achieves high resolution in range, azimuth and D oppler domain has been
described.
• It was shown that the range resolution is inversely proportional to radar
bandwidth. The chirp pulse technique for achieving high range resolution
was described and the system response to a point target was shown to be a
sine function.
• The azimuth resolution improvement achieved with a synthetic aperture
compared to a real aperture was discussed. The system response to a point
target was shown to be again a sine function.
• The relationship between the coherent integration time and the Doppler
resolution was described and the technique o f D oppler beam sharpening for
3. Clutter models
Clutter modelling is essential for optimising target detection and terrain classifica
tion. The clutter echoes result from a coherent electromagnetic scattering process.
W hen an electromagnetic wave scatters from a position (%, y) on the Earth’s sur
face, the physical properties o f the terrain cause changes in both the phase <P(x, y)
and amplitude A(x, y) o f the wave. Therefore, the m ost direct method for m odel
ling the clutter returns is to obtain a full wave solution using Maxwell’s equations
while applying the appropriate boundary conditions. This method, however, suf
fers from the difficulty o f selecting and applying the correct boundary conditions
to represent typical real surfaces. A more simplified approach is to represent the
received complex signal as a sum o f contributions from discrete elementary scat-
terers. The statistical distribution o f the received signal can then be modelled in
terms o f the probability distribution o f the amplitude, phase and num ber o f the
discrete scatterers. The choice o f statistical models can be based on some physical
justification for the scatterer distribution or on ad hoc models based on empirical
evidence. The major part o f this chapter is devoted to a discussion o f the statistical
models.
The forward problem^ as the electromagnetic modelling o f rough surface scat
tering is commonly known, is briefly reviewed in Section 3.1. An in-depth study o f
the forward problem is outside the scope o f this thesis and the discussion is limited
to a general overview o f the technique. This method predicts the scattered field
based on the properties o f the scattering medium and the incoming wave. The
first results in this area were obtained for scattering from periodic surfaces.
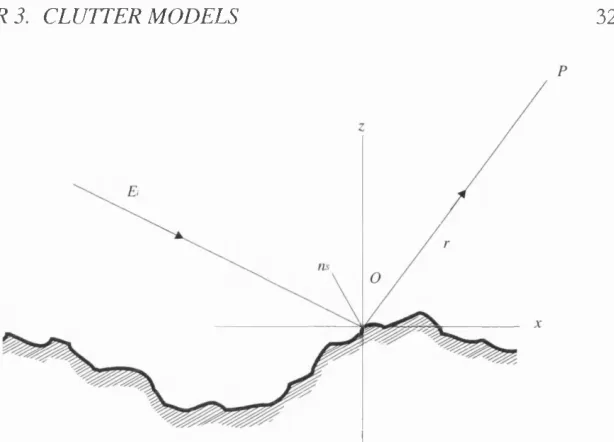
Refeience plane
Figure 3.1: The Rayleigh criterion for smooth surfaces.
quent work addressed the problem of scattering from random rough surfaces. Sec
tion 3.1.1 to 3.1.5 summarises the various approaches taken to solve the forward
problem.
Although the forward problem analysis has helped to identify the dominant
scattering mechanisms, the full wave solutions in most cases are unavailable.
Therefore, an analysis of the statistics of the observed field is a more realistic ap
proach for characterising the clutter models. The statistics o f the received signal are
investigated in terms o f a general model for the electromagnetic field detected by a
radar system; this is described in Section 3.2. When the resolution cell is large
compared to the wavelength the phase o f the scatterers is uniformly distributed
and contains no information regarding the target. Therefore the useful information
regarding the scattering surface is contained only within tlie intensity o f the de
tected field. For the completeness o f the discussion we briefly describe the statis
tics o f the phase and complex components o f the detected field in Section 3.2.
Tliis is followed by a more extensive discussion o f the statistics o f the intensity o f
A review is carried out o f the statistical models used to describe the intensity
characteristics o f ground clutter. Where applicable the physical models underlining
the statistical models are described. For each model the probability density
function (pdf), cumulative distribution function (cdf) and the m om ents are
Hsted. The m ost promising o f these models are selected for testing with real data.
The results are quoted for goodness-of-hts using the chi-squared test.
3.1
Electrom agnetic m odels
The problem o f backscattering from a rough surface is o f interest to radar imaging,
sonar detection and optics. There has been considerable work published on this
subject in a wide spectrum o f journals. The very first work published in this area
was by Rayleigh [67] which analysed the scattering from sinusoidal surfaces for
normal incidence. Schouten and D e H oop [76] extended this for any analytical
rough surface. Although periodic surfaces proved useful in indicating the general
behaviour o f rough surfaces, real surfaces are rarely periodic. A num ber o f re
searchers have investigated the scattering from random rough surfaces. Beckmann
and Spizzichino [7] considered scattering from normally distributed rough surfaces
using the K irchhoff solution which assumes a slowly varying height profile. H ow
ever, many surfaces o f practical interest are not normally distributed. The distribu
tion o f terrain with sharp ridges and round valleys and that o f a rough sea is asym
metric and therefore not normal. A standard approach for modelling scattering
from non-Gaussian surfaces is the Small Perturbation M ethod (SPM) which is suit
able when the surface roughness is small [68]. The purely analytical approach,
however, is limited in the type o f surface that can be modelled, due to the lack o f
closed form solutions. Various numerical solution based approaches have been
used to analyse the scattering from arbitrarily defined rough surfaces. Section 3.1.1
to 3.1.4 summarises each o f these approaches. Besides these methods there have
been a few other notable approaches, which are mentioned in Section 3.1.5.
3.1.1 P e rio d ic surfaces
Historically, this class o f rough surfaces was the first to be treated. A rough surface
profiles, protrusions o f equal shape spaced at regular intervals, etc. This approach
enables the problem to be solved in a simplified non-statistical way.
Rayleigh [67] analysed the problem for sinusoidal surfaces and developed the
well-known Rajleigh criterion., for qualifying the roughness o f a surface. The process
in which an incident wave is reflected depends upon the surface roughness. For
smooth surfaces the reflection is specular. Specular reflection is directional and has
a constant predictable phase with respect to the incident wave. In this case and
in Figure 3.1 wiU be equal and the reflections wUl add coherently to give a
strong return in a single direction. For rough surfaces, the reflection is diffused.
Diffused reflection is much more dispersed and the phase o f scattered energy var
ies over 0 -
2 n .
Rayleigh stated that a surface may be regarded as smooth if the phase difference between two reflected waves is less that 7t/2. Using the geometryo f Figure 3.1 this is
where
A h
is the height difference, Oi is the incident angle and A is the wavelength o f the incident wave. (3.1) states that roughness o f any scattering surface is n ot anintrinsic property o f that surface but depends on the frequency and angle o f the
incident wave. A surface appears rougher the smaUer the incident wavelength or
the closer the angle o f incidence is to the surface normal. Although, the Rayleigh
criterion was originaUy defined for periodic surfaces it has been universaUy adopted
for aU type o f rough surfaces, where
A h
is replaced by Gh the standard deviationo f surface heights.
Rayleigh’s work was for the special case of normal incidence onto a sinusoidal
surface which was extended by LaCasce and Tamarkin [47] to oblique angles.
Deryugin [23] applied it to different profiles and Schouten and D e H oop [76] gen
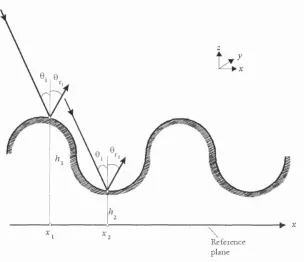
Figure 3.2: Scattering from random rough surfaces.
3.1.2 N o r m a l distributed surfaces
The scattered field Ep observed at a point F at a distance r from a point O on a
surface S (Figure 3.2) is given by the Helmholtz integral [7] as
Ws
diiç (3.2)
where Es is the field on S, ils is a normal to the surface and y/s is given by
.
2
;:exp(y— r)
(3.3)
Beckmann and Spizzichino [7] derived an analytical solution to the scalar
problem o f (3.2) for a normally distributed surface using the Kirchhoff approxi
mation whereby the field at any point on the surface is expressed as the sum o f tlie
incident and reflected field at the tangent at the considered point. Thus Es in (3.2)
is replaced by
= (1 + Ko,Jf (3.4)
where Rcoeff is the reflectivity coefficient o f a smooth plane and Ei is the incident
irregu-(a) (b)
Figure 3.3: The tangent plane at a general point o f the rough surface. The
radius of curvature is (a) small, and (b) large in comparison with the
wavelength.
lari ties is very large compared to the wavelength (Figure 3.3b) but breaks down
completely for sharp edges (Figure 3.3a). Thus the Karchhoff solution is suitable
for smoothly varying normally distributed surfaces. The analyses produced by
Beckmann and Spizzichino [7] assumed small slopes and small standard deviation
o f surface heights (J/,. Wu and Fung [98] extended this to surfaces with large (J/j
using a vector formulation of the Kirchhoff method.
Many surfaces o f practical importance are, however, not normally distributed.
Beckmann [8] showed that the surface height probability distribution has a signifi
cant bearing on the characteristics of the scattered field where the surface rough
ness and the grazing angle of the incident wave are large. Introducing a correlation
function into the Kirchhoff model can compensate for an incorrect surface model.
Shaw and Dougan [80] proposed suitable correlations to model ocean-Hke sur
faces. The assumption of gently undulating terrain, nevertheless severely limits the
applicability o f this model to land surface scattering and therefore there have been
alternative techniques developed for predicting scattering from non-Gaussian sur
faces. These are described in the following section.
3.1.3 N o n -G a u ssia n surfaces
on SPM analysis. Unlike the K irchhoff method, SPM does no t impose a restriction
on the surface curvature and permits the surface height to vary within the distance
o f a wavelength. The method, however, is applicable only to slightly rough surfaces
where
kG^ < 0.3 (3.5)
It also requires that Is, the average slope o f the surface, should meet the criterion
- J 2 a j l ^ < 0 3 (3.6)
SPM calculates the field at any point in the scattering medium using the solutions
for scattering from a smooth surface, together with ‘perturbative’ terms arising
from the slight surface roughness. U nder the assumption o f slightly rough surfaces
the quantities that are a function o f the surface height may be expanded as a Taylor
series about their value on the mean scattering surface
where / i s a quantity defined in the Cartesian co-ordinates
x, y
andz,
and the mean scattering plane isz
=0. The accuracy o f the perturbation theory depends on the num ber o f terms retained in the expansion o f (3.7). Perturbation theory assumesthat the total scattered field Er may be written as a series
(3.8)
where is the contribution from the h term in (3.7). The earlier analysis o f the
perturbation theory was carried out using just the first order terms 'm h [15]. More
recent work by Bass and Fuks [5] and Watson and Keller [96] carried out the
analysis for the second order perturbation theory.
Wright [97] tested the SPM model for sea clutter and found good agreement
to vertically polarised data. The gap between the K irchhoff method, suitable for
high frequencies, and the SPM, suitable for slightly rough surfaces, was bridged by
7
z=0
(^) (b)
Figure 3.4: The image method. The surface field in (a) is equivalent to the
surface field in (b) where the conducting plane has been replaced by a
mirror image o f the surface protrusion.
rough surface with arbitrât}^ slopes. The full wave solution also extends the solu
tion to take into account shadowing and multiple scattering.
3.1.4 N u m erica l solu tion s
This approach uses the numerical solutions of integral equations for the unknown
surface fields to calculate the scattered field. The surface height function /z(x, y) is
treated as a random correlated discrete variable. The numerical solutions are not
restricted to an analytical expression for the scattering surface and thus the solution
can be calculated for any realisation of surface height profile. A variety o f methods
have been adopted from spectral analysis to generate surface height profiles for
example moving average methods and autoregressive processes [55]. Each set of
generated data represents one surface realisation for which the scattered field may
be calculated. The statistical parameters of the scattered field are then determined
by generating large number of surface realisation and analysing the scattered fields
from these surfaces. There is, however, a large price to pay in terms o f increased
Numerical solutions have been used to study the accuracy o f the SPM [18, 30]
and the K irchhoff theory [29, 48] approximate techniques. A further use o f nu
merical simulation techniques is in the modelling o f many aspects o f realistic scat
tering geometries. Factors that complicate, and often preclude, analytical theory,
such as non-planar incident waves with a spatially varying amplitude profile, inci
dent pulses o f arbitrary form and finite-sized surfaces o f non-ideal shape, may aU
be included in a numerical study, however, at the expense o f increased com puta
tional effort.
3.1.5 O th er m e th o d s
The methods described in the previous sections are for the more general type o f
rough surfaces. There has been other less general m ethod developed which over
come some o f the limitations o f the more general models. Twersky [87] developed
a scattering model based on mirror images. He considered a perfectly conducting
surface with arbitrary shaped protrusions. Under this situation the field scattered
by the protruding object under an incident plane wave Ei can be derived by evalu
ating the field scattered from the object in free space illuminated by two incident
waves. This is so since the surface field in both instances is the same, as illustrated
diagramatically in Figure 3.4. The scattered field is easily derivable using this
m ethod and it allows the modelling o f multiple scattering. This approach is par
ticularly useful when the surface can be represented by a collection o f randomly
located discrete scatterers. Fung and Ulaby [28] and others [19, 44] used the dis
crete scatter model to represent scattering from vegetation clutter.
Rather then attempting to calculate the field from a realistic model o f a rough
surface an alternate approach is to adopt a model of a rough surface that will scat
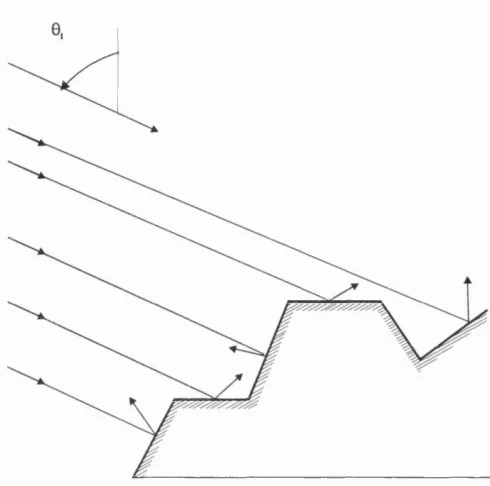
ter a realistic field. A simple model o f rough surfaces that wiU have this effect is
one which consists o f plane facets o f random slope where the random slopes are
generated by a Markov chain (Figure 3.5). Beckmann [6] used this model to obtain
an approximation to the scattered field. The analysis was simplified by assuming
that the reflection are locally specular (this is tm e when the facets are large com
Figure 3.5: Scattering by a surface of large plane facets.
direction (by facets o f the same slope) are summed together with respect to their
phases to form a single resultant wave in that direction. The plane facet approach
is, however, more suited to man-made objects. The facets can be generated deter-
ministically using the object geometry. This method has been used to generate ac
curate scattering predictions for vehicles [34].
3.2
Statistical models
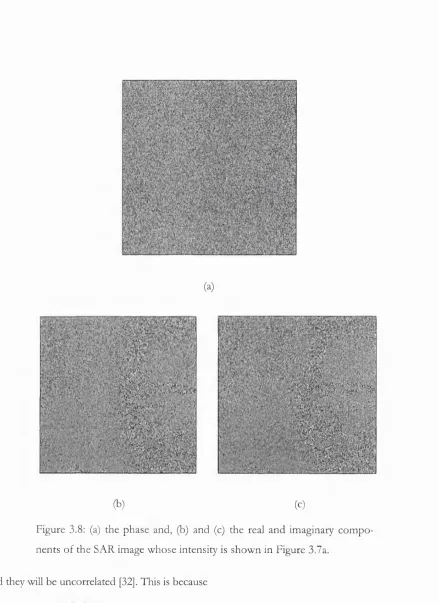
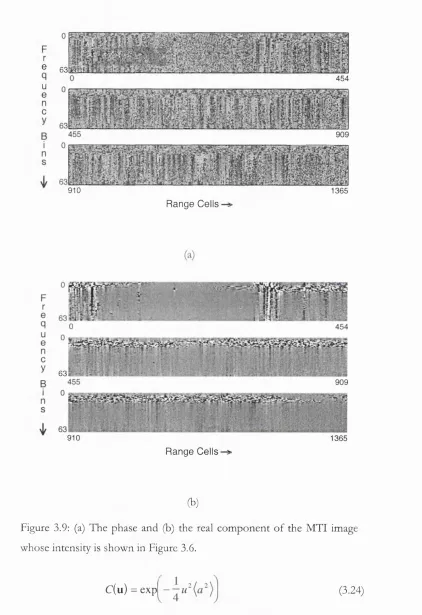
An image generated by a coherent imaging system is affected by coherent interfer
ence between scatterers [32] which causes the detected intensity to fluctuate from
resolution cell to resolution cell. This fluctuation in pixel intensities is evident in
both MTI and SAR images (see Figure 3.6 and Figure 3.7) of land. The observed
intensity fluctuations can be characterised by statistical model without performing
a rigorous solution of the Maxwell equations for the scattering surface.
The statistical model assumes that the received electric field at an observation
point r can be represented as a sum of contributions from elementar)^ scatterers