O R I G I N A L R E S E A R C H
A comparison between auto-scored
apnea-hypopnea index and oxygen desaturation index in
the characterization of positional obstructive
sleep apnea
This article was published in the following Dove Press journal: Nature and Science of Sleep
Daniel J Levendowski 1
Garun S Hamilton2
Erik K St. Louis3
Thomas Penzel4
David Dawson5
Philip R Westbrook1
1Advanced Brain Monitoring, Inc.,
Carlsbad, CA, USA;2Monash Health & School of Clinical Sciences, Monash University, Clayton, VIC, Australia, 3Center for Sleep Medicine, Departments
of Neurology and Medicine, Mayo Clinic College of Medicine and Science, Rochester, MN, USA;4Sleep Medicine Center, Charité Universitätsmedizin Berlin, GmbH, Berlin, Germany; 5Department of Anesthesiology, Bradford
Teaching Hospitals NHS Foundation Trust, West Yorkshire, UK
Objective:Evaluate the concordance between overall and positional oxygen desaturation
indices (ODI) and apnea-hypopnea indices (AHI) according to two different definitions for
positional obstructive sleep apnea (POSA).
Methods: A total of 184 in-home polysomnograms were edited to simulate Level III home sleep apnea tests (HSAT) with the auto-scored AHI and ODI based on recording time. POSA was
determined using 132 records with an AHI≥5 and at least 20 mins of recording time in both
supine and non-supine positions. POSA was defined independently for the AHI and ODI based
on ratios of overall/non-supine event/h≥1.4 (O/NS) and supine/non-supine event/h≥2.0 (S/NS).
Results:Correlation between the AHI and ODI was 0.97 overall, 0.94 for supine, and 0.96
for non-supine recording times (allp<0.001). For most records, differences between the AHI
and ODI were small, with only 14% of the records having a AHI-ODI difference exceeding >5/hr, and 6% exceeding >10 events/hr. The positive and negative percent agreements were uniformly good to excellent across varying clinical POSA cutoffs; percent agreements
(positive, negative) were: AHI≥5=0.99, 0.78; AHI≥10=0.96, 0.89; and AHI≥15=0.96, 0.89.
Cohen’s Kappa scores also showed substantial agreement for overall as well as supine and
non-supine positions across varying clinical cutoffs of the AHI. Frequency of POSA was reproducibly uniform between 59% and 61% for both POSA criteria. When the O/NS and
S/NS definitions conflicted in POSA characterization, O/NS was superior for identifying
patients who might exhibit a greater response to supine restriction positional therapy.
Conclusions: Auto-scored positional oximetry is a clinically viable alternative to an auto-scored Level III HSAT AHI in the characterization of POSA based on a 3% desaturation.
Keywords: obstructive sleep apnea, positional, supine, apnea-hypopnea index, oxygen desaturation index
Plain language summary
In some obstructive sleep apnea (OSA) patients, it is unclear whether position restriction (ie, avoidance of sleeping on the back) is a reasonable therapeutic option. This study compared two approaches for identifying patients with positional OSA (POSA) using automated scoring of home sleep study data without manual editing by a sleep technologist. One approach measured
airflow, oximetry, pulse rate, snoring, and sleep position (yielding apnea-hypopnea index, AHI),
as typically utilized in Type III home sleep apnea tests (HSAT), while the other simplified
approach used only oximetry and sleep position (yielding oxygen desaturation index, ODI). Agreement between AHI and ODI values for classifying POSA severity were excellent. Greatest
Correspondence: Daniel J Levendowski Advanced Brain Monitoring, Inc., 2237 Faraday Avenue Suite 100, Carlsbad, CA 92009, USA
Tel +1 760 720 0099 Email [email protected]
Nature and Science of Sleep
Dove
press
open access to scientific and medical research
Open Access Full Text Article
Nature and Science of Sleep downloaded from https://www.dovepress.com/ by 118.70.13.36 on 24-Aug-2020
differences between the AHI and ODI were observed for non-supine values in the normal and mild OSA range, which did not impact POSA patients likely to achieve a 25% or greater reduction in overall OSA severity with supine position restriction therapy. Automated assessment of oximetry and sleep position was equiva-lent to automated assessment of more complicated signals typical of those acquired during Type III device monitoring in records with technically adequate signal acquisition ie, records with poor quality
airflow or oximetry which require manual editing were
auto-detected and excluded.
Introduction
Laboratory polysomnography (PSG) is considered the gold standard for the diagnosis of obstructive sleep apnea (OSA). PSG includes the electrophysiological channels needed to stage sleep (ie, electroencephalogram, electrooculogram, and electromyogram), cardio-respiratory signals to measure changes in breathing and cardio output (ie, oximetry, pulse, airflow, snoring, and respiratory effort), and auxiliary signals to measure sleep position and leg movements. PSG provides overall, supine, and non-supine apnea-hypopnea indices (AHI) based on sleep time. PSG is categorized as either Type I or II, depending on whether it was conducted as an attended or unattended study.1Type III studies are typically limited channel devices measuring at least four channels (ie, cardio-respiratory signals without the assessment of sleep stage) used in the home as unattended studies that may be self-applied to obtain an AHI typically based on recording time rather than sleep time. Depending on the device and/or software used, a Type III study may include the AHI stratified by sleep position. Type IV devices measure only one or two channels, typically oximetry or airflow and are most com-monly used for OSA screening or assessment of treatment efficacy. When used as diagnostic studies, they perform well in
“ruling in”OSA for patients with a high pre-test probability for OSA, although with lower continuous positive airway pressure (CPAP) adherence, symptom improvement, and phy-sician confidence compared to Type I or III studies.2,3Due to the limited amount of information available to assist with interpretation, Type IV devices are not currently recom-mended for the diagnosis of OSA in the USA.
Pulse oximetry is the most commonly used single channel Type IV device and appears to be superior to airflow alone in the identification of important sleep-dis-ordered breathing.4Oximetry has been used to screen for OSA in surgical patients,5 frail hospitalized elderly,6 those undergoing stroke rehabilitation,7and in children.8,9 It has been recommended for the assessment of
therapeutic response during PAP initiation and is commonly used by dentists to assess oral appliance efficacy.10,11 The advantages of oximetry include its availability, low cost, and relatively simple results that are interpretable by clinicians with limited training.12,13 When compared to the AHI severity determined by PSG, the oxygen desaturation index (ODI) is most accurate using a 3% oxyhemoglobin desaturation in patients with moderate to severe OSA who are overweight or obese.14–16 The agreement between PSG-AHI and Type III-AHI and ODI improves with manual editing,12,17 however many who use Type III devices for screening and/or assessment of therapeutic response use auto-scored indices. This may be a reasonable practice since night-to-night variability in sleep-disordered breathing severity typically exceeds dif-ferences between PSG obtained values and the ODI vs AHI, with or without manual review.12
Positional OSA (POSA) refers to OSA that is most severe in the supine sleep position. Different definitions have been proposed, such as a ratio of the supine/non-supine (S/NS) AHI>2 events/hr.18 The ratio of overall/non-supine AHI (O/NS) is a more useful definition from a treatment perspec-tive, because it provides a greater likelihood that patients identified with POSA will achieve≥50% reduction in overall AHI if supine sleep is avoided.19,20The detection of POSA relies on the accurate assessment of head, neck, or body position, as well as adequate recording time (especially recorded sleep time) in both supine and non-supine positions, to enable reliable comparison of the best and worst sleeping positions. Measuring body position during attended PSG in the sleep laboratory is considered the gold standard to diagnose POSA. However, PSG may potentially complicate the assess-ment of POSA. PSG studies, as commonly performed in the USA, are conducted in a split-night manner. When moderate or severe OSA is identified during thefirst few hours of the study, a CPAP titration is then initiated. As a result of split-night PSG studies, as many as 35% of the patients have less than 20 mins of both supine and non-supine sleep time recom-mended for characterizing POSA.19Further complicating mat-ters, a majority of patients spend more time supine in the lab as compared to in the home,21and laboratory PSG-based supine sleep time has substantially less test–retest reliability than that recorded with a Type II device in the home.22
POSA is increasingly important to recognize as advances in the delivery of position therapy using vibro-tactile feedback have contributed to improved outcomes, and long-term compliance compared to traditional techni-ques (eg, tennis ball t-shirts, restrictive pillows, or
Nature and Science of Sleep downloaded from https://www.dovepress.com/ by 118.70.13.36 on 24-Aug-2020
padding).19,23–25 The characterization of POSA has also evolved, improving the likelihood that clinically important reductions in overall OSA severity will be achieved if supine sleep is avoided.20 Unfortunately, if split night PSG or Type III studies without sleep position monitoring capability are used in the assessment of OSA, clinicians cannot routinely identify which patients might benefit from position therapy alone or in combination with oral appliance therapy.26Therefore, POSA patients may not be considered for important therapeutic options that may have lower cost and improved tolerability compared with nasal CPAP therapy.
The aim of this study was to evaluate the agreement between analysis of more complex auto-scored signals typical of Type III sleep studies, and a simpler option of auto-scored SpO2 signal combined with sleep position for the assessment of POSA. We were also interested in the bearing that these two methods of apnea severity estima-tion had on the opportunity for subsequently successful position restriction therapy.
Methods
A total of 251 consecutively acquired polysomnogram recordings from adults suspected of sleep-disordered breathing between November 1, 2016 and May 31, 2017 at a single clinical practice were retrospectively surveyed and analyzed.
The in-home recordings were made using the Sleep Profiler-PSG2TM (Advanced Brain Monitoring, Carlsbad, CA). The self-applied PSG2 acquired electroencephalogra-phy from three frontopolar electrode sites, airflow using a nasal cannula and pressure transducer, head movement/ position by actigraphy, snoring with an acoustic micro-phone, oxyhemoglobin saturation (SpO2), and pulse rate measured by a wireless wrist oximeter (Nonin Medical, Plymouth, MN, USA), and thorax and abdomen effort by respiratory induced plethysmography. A voice message was delivered to the patient each time SpO2 sensor detached from his/herfinger, and each time≥75 s of continuous low airflow was detected, up to four times per night.
After upload to the Sleep Profiler portal, records were edited so that the AHI and ODI metrics were based on recording time rather than sleep time to simulate a Type III device. The Sleep Profiler automated event detection algo-rithms were then applied to derive an overall, supine and non-supine apnea-hypopnea index (AHI) and ODI. The airflow detection rules were designed to emulate a human-scorers detection of apneas based on >90% reduction in airflow for 10
or more seconds and hypopneas based on >30% reduction in airflow volume. The algorithms applied sliding scale thresh-olds depending on the magnitude of the airflow signal to minimize over-scored event detection during periods with low airflow. Desaturation events used to confirm hypopneas were detected using algorithms applied to the leastfiltered beat-by-beat SpO2 signal (four-beat fast average) with≥3% SpO2 desaturation occurring ≥5 and≤120 s from baseline with ≥1% recovery occurring within 30 s of the nadir. Desaturation events were separately tallied to compute the ODI. The accuracy of the auto-scored event detection and sleep staging algorithms has been previously compared to simultaneously acquire, manually scored laboratory PSG.27
The overall autonomic activation index is derived from the four-beat averagedfinger pulse rate and based on the total number of six or more beats per minute changes compared to the pulse rate 10 s prior and/or 10 s subse-quent to the current second, divided by the hours of recording time.
Apneas and hypopnea events were not assessed during periods with bad airflow (ie, based on 3 min 50% over-lapping windows with extremely low airflow volume and variability). Hypopnea and desaturation events were not assessed during periods marked with no SpO2 signal (ie, oximeter probe either detached from the finger or the Bluetooth connection between the wrist oximeter and the head unit was temporarily interrupted).
To avoid comparison bias, short duration records, ie,
≤4 hrs of recording time, and records with≥20 mins of bad airflow or bad SpO2 were excluded from the analyses. As a result, comparisons between AHI and ODI classifications were made with 184 records (seeTable 1), after 8 records with short duration recording time, 54 records with bad airflow, and 5 records with bad SpO2 were excluded.
Only records with an AHI≥5 with at least 20 mins recording time in both the supine and non-supine positions were included in the assessment of positional obstructive sleep apnea prevalence (POSA) by AHI and ODI. The classification of POSA was applied to the AHI and ODI independently using two ratios, the overall event/h divided by the non-supine events/h (O/NS)≥1.4, and the supine divided by non-supine events/h (S/NS)≥2.0.20 Thus, POSA was determined using 132 records, after exclusion of 52 records; 43 due to AHI<5 events/h, eight with insufficient non-supine time and one with insufficient supine time (Table 1).
Recordings with≥5 events/h differences between the auto-scored AHI and ODI were manually reviewed by an unblinded
Nature and Science of Sleep downloaded from https://www.dovepress.com/ by 118.70.13.36 on 24-Aug-2020
rater to understand possible explanations for the discrepancy. These records were then stratified and tallied by absolute AHI-ODI differences≥5 and≥10 event/h, and important propor-tional differences ([absolute AHI-ODI]/AHI≥50%).
Two-tailed t-tests, Pearson correlations, and Bland-Altman plots were used to assess the concordance between the AHI and ODI metrics. The diagnostic agreement between AHI and ODI values was compared using OSA severities of <5 event/h for the normal range, ≥5 and <15 for mild, ≥15 and <30 for moderate, and ≥30 events/h for severe OSA – for overall, supine and non-supine AHI/ODI. Pearson correlations greater than 0.70 reflected a strong positive relationship. Weighted Cohen’s Kappa scores by and across sleep positions and clinical cutoffs of ≥5, ≥10, and ≥15 events/h were used to assess differences in the ODI vs AHI measures. Kappa scores between 0.81 and 1.00 were characterized as near perfect agreement and from 0.61 to 0.80 substantial agreement. Two-tailed chi-squared tests were used to measure significant differences in the char-acterization of POSA based on the AHI vs ODI.
Results
Differences in AHI and ODI events/h
The characteristics of the patients included in the analyses are presented inTable 1. There were no significant differ-ences for the overall, supine, and non-supine AHI and ODI distributions (Table 2). In the 184 records, the median percentage of supine sleep (applied to both the AHI and ODI) was 33%, with inter-quartile ranges of 20–55%.There were no differences in the mean supine vs non-supine percentage of time snoring >50 dB (24.4±19.8% vs 23.6±20.9%, respectively).
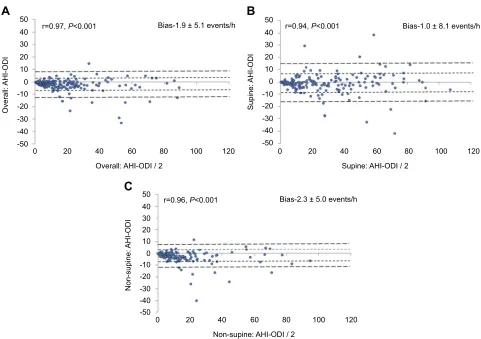
The correlation between each record’s AHI and ODI was 0.97 overall, 0.94 in the supine, and 0.96 in the non-supine positions, respectively (allp<0.001). Bland Altman plots showed a small bias with the ODI exhibiting higher values relative to the AHI, which was most pronounced in the non-supine position (Figure 1).
The correlation between each patient’s AAI and ODI was slightly greater than the association with the AHI (r=0.59 vs 0.56, bothp<0.001, respectively). Associations between the AAI, AHI, and ODI strengthened as OSA severity increased. Of the 184 records included in the AHI vs ODI compar-ison, 26 (14%) had absolute AHI-ODI differences in excess of 5 event/h, 11 (6%) exceeded 10 events/h, and 16 (9%) had proportional differences that exceeded 50% of the AHI (ie, [absolute AHI-ODI]/AHI>50%). By way of compari-son, in the 54 records excluded due to ≥20 mins of bad airflow, 78% had absolute differences≥5 events/h and 41% had differences ≥10 events/h. Only one of the five cases with at least 20 mins of bad oximetry had an absolute difference ≥5 events/h.Figure 2 illustrates the distribution of records with substantial differences by OSA severity. A relatively similar proportion of differences were observed in records with mild and moderate OSA severity. As the OSA severity increased, the number of studies with absolute differences increased while the number of records with important proportional differences (ie, exceeded 50% of the AHI value) decreased. Visual inspection revealed over one-half of the records with important differences (14/26) resulted from missed hypopnea events due to low airflow or apneas unaccompanied by desaturation events, 27% were attributed to spurious desaturation events, and the balance resulted from a combination of airflow and SpO2 issues. There were no differences in body mass index (BMI) between patients with and without important AHI-ODI differences, nor did BMI differentiate those with important differences related to oximetry vs airflow issues.
Table 1Descriptive data for the 184 patient records analyzed for the AHI vs ODI comparisons and the 132 records used for the POSA analysis
Demographic and anthropomorphic
AHI vs ODI comparisons
POSA analysis
Sample size 184 132
Female, % (n) 52 (95) 48 (64)
Age (years), mean ± SD 46±13.7 48±13.0
BMI (kg/m2), mean ± SD 31±7.1 32±7.0 Neck size (cm), mean ± SD 40±4.7 40±4.3
Comorbidities % (n) % (n)
Hypertension 27 (47) 33 (41)
Depression 36 (64) 34 (43)
Restless legs syndrome 18 (31) 19 (24)
Insomnia 14 (24) 14 (18)
Heart disease 6 (11) 8 (10)
Diabetes 6 (11) 8 (10)
Abbreviations:ODI, oxygen desaturation indices; AHI, apnea-hypopnea indices; POSA, positional obstructive sleep apnea.
Table 2 Distributions of sleep-disordered breathing measures across the 184 patient records (mean ± SD)
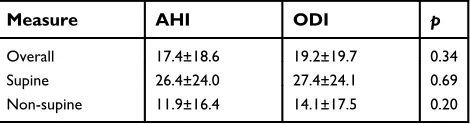
Measure AHI ODI p
Overall 17.4±18.6 19.2±19.7 0.34
Supine 26.4±24.0 27.4±24.1 0.69
Non-supine 11.9±16.4 14.1±17.5 0.20
Nature and Science of Sleep downloaded from https://www.dovepress.com/ by 118.70.13.36 on 24-Aug-2020
The agreements between the auto-scored AHI and ODI for clinical cutoffs of 5, 10, and 15 events/h are presented in Table 3. The positive and negative percent agreements for the overall ODI and AHI were consistent at clinical cutoffs of 10 and 15 event/h. The relatively low negative
percent agreement overall and non-supine for the clinical cutoff AHI≥5 was attributed to the 2.3 event/h bias toward increased ODI values in the non-supine position. Cohen’s Kappa scores indicated near perfect agreement between the AHI and ODI for all comparisons except for supine agreement at clinical cutoff of≥10, and non-supine agree-ments at clinical cutoffs of≥5 and≥15, where there was substantial agreement.
Differences in POSA classi
fi
cation
The frequency of POSA as determined by ODI vs AHI, and by the different definitions of O/NS vs S/NS ratios was similar, ranging from 57% to 61% (allp>0.05). The S/ NS ratios provided 2% greater POSA frequency estimates for both AHI and ODI compared to the O/NS. The S/NS and O/NS ratios both identified 2% more patients with POSA using the AHI vs the ODI (Figure 3). The greatest proportional differences between the O/NS and S/NS were from the detection of POSA in records with moderate and severe OSA. Using the O/NS, POSA was identified by both AHI and ODI in 98% of the records (129/132).
50
A
B
C
r=0.97, P<0.001 Bias-1.9 ± 5.1 events/h 40
30
20
10
0 -10 -20
-30
-40
-50
0 20 40 60
Overall: AHI-ODI / 2
Overall: AHI-ODI
80 100 120
50
r=0.94, P<0.001 Bias-1.0 ± 8.1 events/h 40
30 20 10
0
-10 -20
-30 -40
-50
0 20 40 60
Supine: AHI-ODI / 2
Supine: AHI-ODI
80 100 120
50
r=0.96, P<0.001 Bias-2.3 ± 5.0 events/h 40
30 20 10 0 -10 -20
-30 -40 -50
0 20 40 60
Non-supine: AHI-ODI / 2
Non-supine: AHI-ODI
80 100 120
Figure 1Bland Altman plots comparing the AHI vs ODI for (A) overall, (B) supine and (C) non-supine positions (n=184).
0% 10% 20% 30% 40%
Mild Moderate Severe
Per
c
entage of
records
OSA severity
>5 events/h >10 events/h >50% difference
Figure 2Percentage of 184 records with absolute differences between the overall AHI and ODI were≥5 and≥10 events/h or absolute difference >50% of the AHI, further stratified by those with mild (n=65), moderate (n=45), or severe OSA (n=31).
Nature and Science of Sleep downloaded from https://www.dovepress.com/ by 118.70.13.36 on 24-Aug-2020
POSA was consistently characterized by the S/NS defi ni-tion in 94% of the records (124/132).
There were subtle differences between the S/NS and the O/NS criteria in the identification of patient’s likely to demonstrate a response to subsequent positional therapy. Patients identified with POSA using the O/NS could potentially achieve a median ODI reduction of 48% (IQR 37–72%) vs 54% (IQR 40–75%) with AHI. When the S/NS ratio was used, the median-projected reduction was 46% for ODI (IQR 34–72%) vs 52% (IQR 38–75%) for AHI. In the six records where the AHI-O/NS ratio
identi-fied POSA that was not identified by the AHI-S/NS ratio,
the mean reduction in AHI if supine sleep was avoided was 35.5±4.0%. In the nine records identified as POSA by AHI-S/NS but not by AHI-O/NS, the mean reduction in ODI was 20.5±3.5% (p<0.0001). Conversely, in the five records where the ODI-O/NS identified POSA that the ODI-S/NS had not identified, the mean reduction in ODI if supine sleep was avoided was 30.4±0.04%. In the nine records identified as POSA by the ODI-S/NS but not by ODI-O/NS ratio, the mean reduction in ODI was 17.6 ±2.3% (p<0.0001).
Discussion
This is thefirst study to assess differences in the AHI and ODI severity as it relates to the characterization POSA. We observed near perfect agreement for determination of POSA between the overall and supine AHI vs ODI and substantial agreement in the non-supine values at clinical cutoffs of ≥5 and ≥15 events/h. The non-supine ODI values were slightly greater than the AHI in the range of 5–10 events/h; however, these differences had a limited effect on the determination of POSA frequency, which ranged from 57% to 61%. POSA frequency was 2% lower using the ODI vs AHI, and 2% lower using the O/ NS vs S/NS ratios.
In this study, the AHI was based on results that would be expected from a Type III device, ie, hypopneas
con-firmed with a desaturation and indices based on recording
Table 3Agreement between auto-scored AHI vs ODI stratified by sleep position and clinical cut-off (n=184)
Overall
AHI≥5 95% CI range AHI≥10 95% CI range AHI≥15 95% CI range
Positive % agreement 0.99 0.94 1.00 0.96 0.90 0.99 0.96 0.89 0.99
Negative % agreement 0.78 0.63 0.89 0.89 0.80 0.94 0.89 0.82 0.94
Cohen’sƙ 0.81 0.71 0.91 0.85 0.77 0.92 0.83 0.75 0.91
Supine
AHI≥5 95% CI range AHI≥10 95% CI range AHI≥15 95% CI range
Positive % agreement 0.99 0.96 1.00 0.93 0.87 0.97 0.96 0.90 0.99
Negative % agreement 0.91 0.75 0.98 0.81 0.69 0.90 0.88 0.79 0.94
Cohen’sƙ 0.92 0.85 1.00 0.76 0.65 0.86 0.85 0.77 0.92
Non-supine
AHI≥5 95% CI range AHI≥10 95% CI range AHI≥15 95% CI range
Positive % agreement 0.98 0.93 1.00 0.95 0.87 0.99 1.00 0.91 1.00
Negative % agreement 0.68 0.57 0.78 0.89 0.82 0.94 0.88 0.82 0.93
Cohen’sƙ 0.68 0.57 0.78 0.80 0.71 0.89 0.77 0.66 0.87
Abbreviations:AHI, apnea-hypopnea index based on automated analysis and recording time; CI, confidence interval.
70%
65%
60%
55%
50%
45%
40%
Prevalence of POSA
35%
30%
Overall
AHI O/NS ODI O/NS AHI S/NS ODI S/NS Mild Moderate Severe
Figure 3Distributions of POSA frequency (n=132) based on AHI vs ODI across all records (overall) and with records stratified by OSA severity based using the ratio of the overall/non-supine (O/NS)≥1.4 and the supine/non-supine (S/NS)≥2.0.
Nature and Science of Sleep downloaded from https://www.dovepress.com/ by 118.70.13.36 on 24-Aug-2020
time. Ourfindings are likely highly generalizable to other home sleep testing settings, since the SpO2 values in this study were obtained from an oximeter used by more than 70% of the Type III devices available worldwide. A mini-mum 3% desaturation was applied for the AHI and ODI because it is the American Academy of Sleep Medicine recommended standard,28 and due to its comparative superiority to both a 2% and 4% desaturation criteria.16
There are a number of factors that contribute to a diver-gence between auto-scored AHI and ODI. In this study, all records with clinically important AHI-ODI differences (ie,
≥5 events/h) were inspected to better understand what factors contributed to performance errors as opposed to randomly sampling records to confirm auto-scoring accuracy.4 This study utilized a hypopnea algorithm designed for detection accuracy rather than simply being restrictive to avoid over-scoring.29Over 50% of the cases with important differences between the auto-scored AHI and ODI were attributed to a low airflow signal, likely the result of mouth breathing or the cannula been poorly seated in the nares. In 6 of the 11 records with absolute AHI vs ODI differences >10 events/h, the detection of apneas was compromised by low airflow. However, because severe OSA was detected by both AHI and ODI, a portion of the records with significant differences were not clinically relevant. It is important to note that despite the delivery of voice messages when low airflow was detected, 22% of the records had to be excluded as a result of greater than 20 mins of bad airflow. The number of auto-scored AHI vs ODI differences≥5 events/h would have increased 2.5 fold (from 26 to 68) if the 54 recordsflagged for manual scoring were not excluded.
The measurement of oxygen saturation can also contri-bute to differences in the AHI and ODI. This study avoided variability that results from comparisons from different oximeter brands and filtering characteristics by use of the same oximetry signal.12,30,31 While it is common for the detection of oxygen desaturation events to be derived based on a minimum decrease from baseline (ie, ≥2%, 3% or 4%),12,16,17 the algorithm used for this study required a 1% recovery in combination with other parameters. These rules were designed to improve the discrimination between desaturation events attributed to obstructive breathing from events attributed to oximetry drift. Assuming the described algorithms are applied, the results from this study will be generalizable given the oximeter that was employed in this study is so ubiquitous in clinical practice.
The findings in this study may have a number of important clinical implications. We were able to
demonstrate that ODI performs similar to auto-scored AHI from a Type III device in the detection of POSA. Knowing that ODI is a more robust signal than airflow with less data loss,32 this gives clinicians confidence that simple and easily derived metrics can help guide important clinical decision-making. Given the advances in positional therapy, identification of POSA has become increasingly important. Patients with POSA may be successfully treated with positional therapy as their only treatment.33 Furthermore, if residual POSA following alternative thera-pies can be simply diagnosed during treatment review studies, then there are also occasions where positional therapy may be successfully added in combination.26 Weight loss, for example, frequently improves, but rarely cures OSA and leads to a greater improvement in the non-supine AHI than non-supine AHI34 – opening up positional therapy for a range of patients. Similarly, detecting resi-dual POSA may help dentists guide the titration of oral appliances for the treatment of OSA, identifying when OSA could be further resolved with the addition of posi-tion therapy, rather than risking long-term complicaposi-tions (eg, from excessive mandibular advancement) or accepting less than optimal outcomes.
Certain neurological patient populations in which CPAP are challenging to deploy, or in which adherence to positive airway pressure poses greater than usual chal-lenges, may also be ripe for application of positional therapy approaches, such as post-stroke convalescence in which positional therapy has been shown to reduce OSA severity by 20–46%,35 or in patients with neurodegenera-tive disease who were recently found to have significant associations with the supine sleep position.36 These and other similar settings may be strategic situations for initial positional therapy approaches, provided ample availability of feasible diagnostic strategies to inform its application, such as home sleep apnea testing, or more simply, use of portable overnight oximetry and positional measurement which we show in the current study as reasonably equiva-lent diagnostic methods for POSA. The findings suggest that POSA defined by using the O/NS ratio is more con-sistent in identifying patients who will experience clini-cally important reductions in overall sleep disordered breathing severity as a result of position restriction therapy using either the AHI or ODI, as compared to the S/NS criterion.
Pre-surgical characterization of POSA could also be used to identify patients who should be encouraged to sleep in lateral positions postoperatively when possible, to
Nature and Science of Sleep downloaded from https://www.dovepress.com/ by 118.70.13.36 on 24-Aug-2020
reduce the effects of sleep-disordered breathing during recovery. Lateral positioning has also been shown to decrease the incidence of central sleep apnea,37a condition exacerbated by high dose opiates that are often administered following a surgical procedure.38This may be particularly beneficial in patients who are at increased risk due to discharge prior to the day-three REM rebound.39 Yet to be demonstrated is whether supine avoidance in POSA patients could reduce the incidence of post-surgical readmissions due to reduced complications attributed to untreated OSA.
This study also has several limitations. The comparison between ODI and AHI was conducted on a home PSG system to generate data similar to that acquired during Type III home sleep apnea testing, recruiting subjects with a high pretest probability for OSA and POSA diag-noses, and involved a within subjects design (ie, using the same subjects and recording equipment and strategy). Therefore, the resultant high concordance found between AHI and ODI may not be replicable in alternate settings involving different populations of patients with a lower pretest probability for OSA/POSA, or using alternative home sleep testing recording systems. Additionally, the
findings may be biased by the use of a diagnostic device that delivered voice messages to reduce poor airflow and oximetry, and software that auto-detected airflow and oxi-metry problems that required manual editing. Finally, the differences in the AHI and ODI that could be attributed to sleep time vs recording time, manual vs auto-automated scoring, or laboratory vs in-home use were not explored. These factors, while important, have been previously studied.12,16,17
Conclusions
This study demonstrated that auto-scored positional oxi-metry is a clinically viable alternative to an auto-scored Level III HSAT AHI, when records with periods with poor quality airflow or oximetry, which might require manual editing, are excluded. In this setting, the analysis of oxi-metry using a sophisticated 3% desaturation criteria in combination with sleep position is equivalent to a Level III HSAT in the characterization of POSA.
Abbreviation list
AAI, autonomic activation index; AHI, apnea-hypopnea index; BMI, body mass index; BPM, beats per minute; CPAP, continuous positive airway pressure; HSAT, home sleep apnea test; IQR, inter-quartile range; O/NS, overall divided by non-supine events/h; ODI, oxygen desaturation
index; OSA, obstructive sleep apnea; POSA, positional obstructive sleep apnea; S/NS, supine divided by non-supine events/h; SpO2, peripheral capillary oxygen saturation.
Ethics approval
This study complied with the Declaration of Helsinki with IRB approval for analysis of the deidentified records with-out patient consent obtained from the BioMed IRB San Diego, CA. The approval was based on the described oversight, proposed data analyses, and description of co-authors/sub-investigators provided in Protocol ABM717. The confidentiality of the patient data was maintained throughout the study.
Acknowledgments
The authors wish to thank Marija Stevanovic-Karic for her statistical support, and Ali Maree Davies and Dr Mark Levi from the Levi’s Sleep Clinic, West Gosford, NSW, Australia for their efforts in the acquisition of the PSG2 records. Dr St. Louis received research sup-port from the National Center for Research Resources and the National Center for Advancing Translational Sciences, NIH, through Grant Number 1 UL1 RR024150-01, and the Mayo Clinic Alzheimer’s Disease Research Center Grant Award from the NIA (P50 AG016574). The content is solely the responsi-bility of the authors and does not necessarily represent the official views of the NIH.
Author contributions
All authors made substantial contributions to conception and design, acquisition of data, or analysis and interpreta-tion of data; took part in drafting the article or revising it critically for important intellectual content; gave final approval of the version to be published; and agree to be accountable for all aspects of the work.
Disclosure
Mr Levendowski and Dr Westbrook are shareholders in Advanced Brain Monitoring, Inc. and would benefit fi nan-cially if the intellectual property for the Sleep Profiler, Night Shift, and/or Positional Sleep Assessment System was acquired by a third party. Mr Levendowski and Dr. Westbrook have the following patents issued to Advanced Brain Monitoring: US 8783264, US 9198615, US 9855006, US 8355769 and US 8639313. Dr Hamilton reports they
Nature and Science of Sleep downloaded from https://www.dovepress.com/ by 118.70.13.36 on 24-Aug-2020
have received equipment to support research projects from Resmed, Philips Respironics and Air Liquide Healthcare. Dr St. Louis report grants from NIH NHLBI, NIA, NINDS, Michael J. Fox Foundation and Sunovion, Inc., outside the submitted work. Dr St. Louis is on the Adverse Events Adjudication and Data Safety Monitoring Board for Clinical Trial for Inspire, Inc. Dr Penzel report grants from Itamar, Cidelec, Resmed, Löwenstein Medical and grants and personal fees from Philips/Respironics, during the con-duct of the study; grants from Cidelec, Itamar, Resmed, Löwenstein Medical and grants and personal fees from Philis/Respironics, outside the submitted work. Dr Dawson reports personal fees from consultancy with Philips Respironics, personal fees from Managing Director of OSA Risk Management Ltd and personal fees from being a share-holder in Sleep Doctor Ltd, outside the submitted work. The authors report no other conflicts of interest in this work.
References
1. Standards of Practice Committee of the American Sleep Disorders Association. Practice parameters for the use of portable recording in the assessment of obstructive sleep apnea.Sleep.1994;17:372–377. 2. Douglas JA, Chai-Coetzer CL, McEvoy D, et al. Guidelines for sleep
studies in adults– a position statement of the Australasian Sleep Association.Sleep Medicine.2017;36(1):S2–S22.
3. Chai-Coetzer CL, Antic NA, Hamilton GS, et al. Physician decision making and clinical outcomes with laboratory polysomnography or limited-channel sleep studies for obstructive sleep apnea. A rando-mized trial.Ann Intern Med.2017;166:332–340.
4. Senaratna CV, Lowe A, Perret JL, et al. Comparison of apnoea-hypopnoea index and oxygen desaturation index when indentifying obstructive sleep apnoea using type-4 sleep studies. J Sleep Res.
2018;e12804.
5. Chung F, Liao P, Elsaid H, Islam S, Shapiro C, Sun Y. Oxygen desaturation index from nocturnal oximetry: a sensitive and specific tool to detect sleep-disordered breathing in surgical patients.Anesth Analg.2012;114:993–1000.
6. Maziere S, Pepin JL, Siyanko N, et al. Usefulness of oximetry for sleep apnea screening in frail hospitalized elderly.Jamda.2014;e1–e6. 7. Aaronson JA, van Bezeij T, van Den Aardweg JG, van Bennekom
CAM, Hofman WF. Diagnostic accuracy of nocturnal oximetry for detection of sleep apnea syndrome in stroke rehabilitation. Stroke.
2012;43:2491–2493.
8. Liu JF, Tsai CM, Lin MC, et al. Application of desaturation index in post-surgery follow-up in children with obstructive sleep apnea syn-drome.Eur Arch Otorhinolaryngol.2017;274(1):375–382. 9. Tsai CM, Kang CH, Su MC, Lin HC, Huang EY, Chen CC.
Usefulness of desaturation index for the assessment of obstructive sleep apnea syndrome in children.Int J Pediatr Otorhinolaryngol.
2013;77(8):1286–1290.
10. Koivumaki V, Maasilta P, Bachour A. Oximetry monitoring recom-mended during PAP initiation for sleep apnea in patients with obesity or nocturnal hypoxemia.J Clin Sleep Med.2018;14(11):1859–1863. 11. Loube MD, Strauss AM. Survey of oral appliance practice among dentists treating obstructive sleep apnea patients. Chest. 1997;111 (2):382–386.
12. Dawson A, Loving RT, Gordon RM, et al. Type III home sleep testing versus pulse oximetry: is the respiratory disturbance index better than the oxygen desaturation index to predict the apnoea-hypopnoea index measured during laboratory polyomnography?
BMJ Open.2015;5:e007956.
13. Ayache M, Strohl KP. High interrater reliability of overnight pulse oximetry interpretation among inexperienced physicians using a structured template.J Clin Sleep Med.2018;14(4):541–548. 14. Hang LW, Wang HL, Chen JH, et al. Validation of overnight
oxime-try to diagnose patients with moderate to severe obstructive sleep apnea.BMC Pulm Med.2015;15:24.
15. Ernst G, Bosio M, Salvado A, Dibur E, Nigro C, Borsini E. Difference between apnea-hypopnea index (AHI) and oxygen desa-turation index (ODI): proportional increase associated with degree of obesity.Sleep Breath.2016;20(4):1175–1183.
16. Ling IT, James AL, Hillman DR. Interrelationship between body mass, oxygen desaturation, and apnea-hypopnea indices in a sleep clinic population.Sleep.2012;35(1):89–96.
17. Nigro CA, Dibur E, Mainis S, Grandval S, Nogueira F. Validation of ApneaLink OxTM
for the diagnosis of obstructive sleep apnea.Sleep Breath.2013;17(1):259–266.
18. Cartwright RD. Effect of sleep position on sleep apnea severity.
Sleep.1984;7:110–114.
19. Levendowski DJ, Seagraves S, Popovic D, Westbrook PR. Assessment of a neck-based treatment and monitoring device for positional obstructive sleep apnea.J Clin Sleep Med.2014;10(8):863–871.
20. Levendowski DJ, Oksenberg A, Vicini C, Penzel T, Levi M, Westbrook PR. A systematic comparison of factors that could impact treatment recommendations for patients with Positional Obstructive Sleep Apnea (POSA).Sleep Med.2018;50:145–151.
21. Wimaleswaran H, You S, Buzacott S, et al. Sleeping position during laboratory polysomnography compared to habitual sleep position at home.J Sleep Res.2018;27(S2):17.
22. Levendowski D, Steward D, Woodson BT, Olmstead R, Popovic D, Westbrook P. The impact of obstructive sleep apnea variability mea-sured in-lab versus in-home on sample size calculations. Int Arch Med.2009;2(1):2.
23. Ravesloot MJL, White D, Heinzer R, Oksenberg A, Pepin JL. Efficacy of the new generation of devices for positional therapy for patients with positional obstructive sleep apnea: a systematic review of the literature and meta-analysis.J Clin Sleep Med.2017;13(6):813–824.
24. Levendowski D, Cunnington D, Swieca J, Westbrook P. User com-pliance and behavioral adaptation associated with supine avoidance therapy.Behav Sleep Med.2018;16(1):27–37.
25. de Ruiter MHT, Benoist LBL, de Vries N, de Lange J. Durability of treatment effects of the Sleep Position Trainer versus oral appliance therapy in positional OSA: 12-month follow-up of a randomized controlled trial.Sleep Breath.2018;22(2):441–450.
26. Dieltjens M, Vroegop AV, Verbruggen AE, et al. A promising concept of combination therapy for positional obstructive sleep apnea.Sleep Breath.2015;19(2):637–644.
27. Levendowski DJ, Henninger D, Velimirovic V, et al. Non-inferiority between the overall and REM-related apnea-hypopnea indexes obtained by polysomnography and a forehead worn, auto-scored system.Sleep.2016;S39:A380.
28. Berry RB, Budhiraja R, Bottlieb DJ, et al. Rules for scoring respiratory events in sleep: update on the 2007 AASM manual for scoring of sleep and associated events. J Clin Sleep Med.2012;8 (5):597–619.
29. Erman MK, Stewart D, Einhorn D, Gordon N, Casal E. Validation of the ApneaLink for the screening of sleep apnea: a novel and simple single-channel recording device.J Clin Sleep Med.2007;3:387–392. 30. Bumb T, Twumasi A, Alimokhtari S, et al. Comparison of two home sleep testing devices in different strategies for diagnosis of OSA.
Sleep Breath.2018;22(1):139–147.
Nature and Science of Sleep downloaded from https://www.dovepress.com/ by 118.70.13.36 on 24-Aug-2020
31. Ng Y, Joosten SA, Edwards BA, et al. Oxygen desaturation index differs significantly between types of sleep software.J Clin Sleep Med.2017;13(4):599–605.
32. Gantner D, Ge JY, Li LH, et al. Diagnostic accuracy of a questionnaire and simple home monitoring device in detecting obstructive sleep apnoea in a Chinese population at high cardiovascular risk. Respirology.
2010;15:952–960.
33. Barnes H, Edwards BA, Joosten S, Naughton MT, Hamilton GS, Dabscheck E. Positional modification techniques for supine obstruc-tive sleep apnea: a systematic review and meta-analysis. Sleep Medicine Reviews.2017;36:107–115.
34. Joosten SA, Khoo JK, Edwards BA, et al. Improvement in obstruc-tive sleep apnea with weight loss is dependent on body position during sleep.Sleep.2017;40(5). doi:10.1093/sleep/zsx047
35. Svatikova A, Chervin RD, Wing JJ, Sanchez BN, Migda EM, Brown DL. Positional therapy in ischemic stroke patients with obstructive sleep apnea.Sleep Med.2011;12(3):262–266.
36. Levendowski DJ, Gamaldo C, St. Louis EK, et al. Head position during sleep: potential implications for patients with neurodegenera-tive disease.J Alzheimers Dis.2019;67(2):631–638.
37. Szollosi I, Roebuck T, Thompson B, Naughton MT. Lateral sleeping position reduces severity of central sleep apnea/Cheyne-Stokes respiration.Sleep.2006;29(8):1045–1051.
38. Muza RT. Central sleep apnoea–a clinical review.J Thorac Dis.
2015;7(5):930–937.
39. Vasu TS, Grewal R, Doghramji K. Obstructive sleep apnea syndrome and perioperative complications: a systematic review of the literature.
J Clin Sleep Med.2012;8(2):199–207.
Nature and Science of Sleep
Dove
press
Publish your work in this journal
Nature and Science of Sleep is an international, peer-reviewed, open access journal covering all aspects of sleep science and sleep med-icine, including the neurophysiology and functions of sleep, the genetics of sleep, sleep and society, biological rhythms, dreaming, sleep disorders and therapy, and strategies to optimize healthy sleep.
The manuscript management system is completely online and includes a very quick and fair peer-review system, which is all easy to use. Visit http://www.dovepress.com/testimonials.php to read real quotes from published authors.
Submit your manuscript here:https://www.dovepress.com/nature-and-science-of-sleep-journal
Nature and Science of Sleep downloaded from https://www.dovepress.com/ by 118.70.13.36 on 24-Aug-2020