181
Volume LX 19 Number 4, 2012
SPURIOUS SYNCHRONIZATION OF
BUSINESS CYCLES: DYNAMIC CORRELATION
ANALYSIS OF V4 COUNTRIES
S. Kapounek, J. Poměnková
Received: February 29, 2012
Abstract
KAPOUNEK, S., POMĚNKOVÁ, J.: Spurious synchronization of business cycles – Dynamic correlation analysis of V4 countries. Acta univ. agric. et silvic. Mendel. Brun., 2012, LX, No. 4, pp. 181–188
The purpose of our paper is to defi ne rules for decision of existence spurious synchronization of countries within the currency area. We devote this new methodological approach from an empirical research based on the variability of a dynamic correlation (correlation in frequency domain). We analyze the dynamic correlation in full range and in the business cycle frequencies as well. We also consider lags in economic activity co-movements. Contrary to the standard approach we show its insuffi ciency especially in case of time domain instruments. For this goal GDP values in quarters of the four Visegrad countries and the Eurozone in the period 1997/Q1–2011/Q1 are used.
OCA theory, monetary policy effi ciency, co-movements, Hamming window
The process of European integration, especially the issue of business cycle synchronization is at the forefront of economists’ minds over the past twenty years. The theoretical arguments are founded in the theory of optimal currency areas (OCA theory) which was pioneered by Mundell (1961) and contributed by McKinnon (1963) and Kenen (1969). The traditional version of OCA theory was supplemented by Corden (1972), who argues that joining a currency area is related with loss of autonomous monetary policy and exchange rate control. These arguments followed by new theoretical development of OCA which focuses more on the benefi ts and costs of adopting a common currency. On the basis of the theoretical principles, the costs are minimized and benefi ts maximized with high degree of cyclical and structural synchronization.
There are several methods for measuring the synchronization of business cycles. The most common methods are the unconditional correlation between the two countries in diff erent time periods, the identifi cation of delays various phases of business cycles, volatility of cyclical fl uctuations in economic activity, stability and similarity of unexpected fl uctuations in economic activity or
shock response (Darvas and Szapáry, 2008). Croux et al. (2001) applied dynamic correlation, Koopman and Azevedo (2008) focus on phase correlation, Hardin and Pagan (2006) applied index of cyclical conformity (Concordance Index). Fidrmuc and Korhonen (2006) point out, that the diff erent empirical studies of business cycles synchronization in the Eurozone provide signifi cantly diff erent results. These diff erences are caused by various types of methodological approaches to identify business cycles and its synchronization.
two regions identically. The same change in real output and aggregate prices appears but its causes are diff erent. Can be this situation considered as the symmetric shock? The answer is No. These are two diff erent local shocks with the same or similar eff ects in selected countries. The conclusion about business cycles synchronization could be biased.
The main objective of this paper is to provide methodological approach to identify possibility of spurious synchronization. Finally, the authors specify decision criteria based on the dynamic correlation and its variability in diff erent frequencies. They suppose that co-movements in diff erent frequencies show diff erent correlation. Subsequently, they conclude that variability of co-movements in diff erent frequencies increases costs of losing autonomous monetary policy because shocks aff ect these countries diff erently. The arguments are supported by empirical analysis of V4 countries.
Theoretical background
The authors suppose that variability of dynamic correlation in diff erent frequencies appears with specialization and country-specifi c shocks. The question is, if we can assume the existence of pure local shock in the open economies. There is international trade as the important transmission channel for foreign shocks. And not only the trade but also consumptions, investments, house prices are transmitted through consumer sentiment. Kose et al. (1993) analyzed 60-country sample covering sever regions of the world. The results indicate that a common world factor is an important source of volatility for aggregates in most countries, providing evidence for a world business cycle (Kose et al., 1993). They found that local factors play only a minor role in explaining fl uctuations in economic activity. Aastveit et al. (2011) showed that foreign shocks explain a major share of business cycle fl uctuations (50–70 percent) in Canada, New Zealand, Norway and UK. However, they conclude that local factors explain approximately 20 percent of the variance in domestic variables. Clark and Shin (2000) identifi ed common and country-specifi c shocks in accounting for variation in industrial production in European countries. Consequently, we can assume that local shocks play important role in analysis of synchronization. And, simultaneously, there is probability of asymmetric shocks which reduces the monetary policy effi ciency.
However, the detailed analyses of business cycle fl uctuations are limited by data and econometric tools. The most empirical studies focus on aggregate economic activity. It consists of many components aff ected by exogenous and endogenous forces. Assume that two diff erent macroeconomic shocks reversely aff ect diff erent components in aggregate economic activity. The fi rst has a global character and changes business cycle within the whole currency union. The second country-specifi c shock aff ected only one country. Subsequently, the
business cycle as a consequence of these shocks will not change in this specifi c country. The business cycles synchronization in full range of spectrum is biased.
There is another example. Assume that macroeconomic global, regional and country-specifi c shocks aff ect countries within the currency union. The business cycles in the currency union are signifi cantly co-moved and referred to be synchronized. However, identifi ed co-movements are changing in diff erent frequencies. Then the demand or supply shocks need policy autonomy and costs from adopting a single currency are high. In this case, the business cycle synchronization is spurious.
High variability of correlation in diff erent frequencies could be caused by specialization and concentration as well. In that case, the common monetary policy is not effi cient to stabilize output and unemployment. The explanation was already provided by Kenen (1969) and Krugman (1993) in traditional version of OCA theory. Kenen (1969) assumes that diversifi ed economies with inter-industrial mobility are good candidates to join OCA, because diversifi cation helps them to adjust rapidly to negative external shocks. Diversifi ed economy with diversifi ed export sector is more stable if those shocks are uncorrelated. Krugman (1993) points out that economic integration leads to regional concentration of industries (e.g. automobile plants in Michigan). Subsequently, regional concentration of industry could lead to asymmetric shocks within the currency region.
MATERIAL AND METHODS
Correlation coefficient calculated in time domain and denoted as classical correlation is very popular methods to identify business cycles synchronization. Unfortunately, it measures only direct or indirect linear relationship between time series. The dynamic correlation is alternative approach based on spectral analysis where time series are represented by sine and cosine waves. The results are represented in frequency domain. This methodological approach allows identify the diff erent correlation at diff erent frequencies. Thus, we can identify diff erent types of waves represented by specifi c cycles (investment cycle, changes in stocks, innovations, policy cycles etc.) or/and cyclical movements in economic activity of specifi c sectors in the economy (it is found that characteristic frequencies of business indicators are remarkably stable.
xt = gt+ ct + st+t, t =1, …,n, (1) where gt denotes long-term trend, ct is the cyclical component, st is the seasonal component and t is the irregular component.
Removing trend component can be done in several ways. You can apply fi ltering technique. The choice of corresponding fi lter depends of the aim of the work. Because we are working with the business cycles, the suitable is to can work with band-pass fi lters such as Baxter-King (Baxter and King, 1999), Christiano-Fitzgerald (Christiano and Fitzgerald, 1999) or Hamming Window fi lter (Iacobucci and Noullez, 2005).
The prior to the application of the Hamming Window fi lter (HW) is that the trend has to be removed similar to the Christiano and Fitzgerald fi lter. For this can be used for example high-pass Hodrick-Prescott algorithm (Hodrick and Prescott, 1980).
To make application of HW fi lter we are going to follow these steps. At fi rst we calculate a discrete Fourier transform (DFT) X of the input time series x. This operation transforms the time series from the time domain to the frequency domain
X = DFT{x}. (2)
A er that we apply the Hamming windowed fi lter according to the formula
Y = (W × H)X, (3)
where H represents the frequency transfer function of the ideal fi lter, i.e. the fi lter that fi lters out all the frequency components outside the business cycle band, W corresponds to the selected window function (Iacobucci, 2003) and denotes for a convolution operation. At the end we calculate the fi ltered time series using the Inverse Discrete Fourier Transform (IDFT) of Y. The IDFT transforms the frequency domain time series Y into the time domain series y
y = IDFT{Y}. (4)
For quantifi cation of co-movements between time series we use the dynamic correlation according Croux, Forni and Reichlin (2001). The dynamic correlation measures the similarity of the frequency components of two time series y and z and can be defi ned as:
yz yz z y C S S , (5)
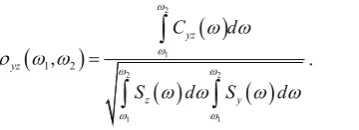
where Cyz is a co-spectrum (the real part of the cross-spectrum) and Sy, Sz are the individual spectra of time series y and z for frequencies . The dynamic correlation values can lie in the interval from −1 to +1. Integrating in the frequency band from 1 to 2 a dynamic correlation coeffi cient arises:
2 1 2 2 1 11, 2
yz
yz
z y
C d
S d S d
. (6)It evaluates the common behavior of the two time series in the given band of frequencies, e.g in the business cycle frequencies (6–32 quarters). For
1= 0, 2 = π the integration is done over the whole defi ned frequency range and thus the dynamic correlation coeffi cients corresponds to the classical correlation coeffi cient.
RESULTS
For empirical analysis we use data set containing seasonally adjusted quarterly values of gross domestic product in constant prices (reference year 2000), millions of national currency in the period 1997/Q1–2011/Q1. The business cycles co-movements is analyzed between V4 countries, Czech Republic (CZ), Hungary (HU), Poland (PL) and Slovakia (SK) and the Eurozone (EA12) and Germany (DE) as the reference currency regions. All data sets were sourced in National accounts system provided by Eurostat (Eurostat, 2011). The transformation of natural logarithms was applied on all time series.
The time domain representation of growth business cycles identifi ed via detrending by application Hamming window fi lter is showed in the Figure 1. The Augmented Dickey-Fuller stationarity test was applied and unit root was rejected at 1% signifi cance level in the all analyzed countries. Obviously, time domain representation of the growth business cycles provides information about the aggregate economic activity movements. We can see negative signifi cant symmetric shock caused by fi nancial crisis in the years 2008–2010. Before these years all selected countries achieved high economic growth. The other detailed information about the specifi c cyclical movements is hidden. The results could be biased by country-specifi c shocks.
To identify possibility of spurious synchronization we apply analysis in frequency domain, especially dynamic correlation. Consequently, the identifi ca-tion of business cycles synchronizaca-tion does not suppose any lag. However, the lagged business cycles are common problem. It is unreal that international trade or consumer sentiment channel is not lagged. Because in reactions among economies exists some lag, we will consider this fact. According to the Table I with respect to the behaving of troughs, it will be taken lag in maximum order two between selected country, Eurozone and Germany. That means calculation of dynamic correlation will be done for EA, Germany at time t, and any chosen country at time t, t−1, t−2.
cycle frequencies are mostly (in 95%) of the ±0.02 maximum. In percentage evaluation, 89% of changes are to 3% of the change the dynamic correlation in full range. This conclusion makes an impression there is no reason to calculate ‘complicated’ dynamic correlation coeffi cient, but classical correlation
coeffi cient should be enough. However, there are signifi cant diff erences in dynamic correlation with the time lags. The coeffi cient of dynamic correlation is lower with lags, especially with lag of order two. This result shows that there are no lagged cyclical co-movements between analyzed countries.
1: Growth business cycles of V4 countries, Germany and EA12
I: The co-movement among countries measured by dynamic correlation
Lag = 0 EA12 DE CZ HU PL SK
EA12 1.0000 0.9447 0.7679 0.8262 0.7483 0.6464 DE 0.9420 1.0000 0.6562 0.6978 0.6442 0.5260 CZ 0.7625 0.6498 1.0000 0.8405 0.5244 0.8125 HU 0.8193 0.6761 0.8405 1.0000 0.5655 0.7878 PL 0.7500 0.6467 0.5221 0.5488 1.0000 0.4781 SK 0.6416 0.5169 0.8328 0.7813 0.4957 1.0000
Lag = 1 EA12 DE CZ HU PL SK
EA12 1.0000 0.9530 0,7666 0.7915 0.7207 0.6835 DE 0.9491 1.0000 0.0688 0.6996 0.6285 0.6019 CZ 0.7463 0.6694 1.0000 0.8623 0.5666 0.8236 HU 0.7739 0.6677 0.8564 1.0000 0.5612 0.7895 PL 0.7264 0.6243 0.5518 0.5474 1.0000 0.4943 SK 0.6677 0.5837 0.8376 0.7837 0.5032 1.0000
Lag=2 EA12 DE CZ HU PL SK
EA12 1.0000 0.9770 0.5766 0.4424 0.4430 0.5636 DE 0.9724 1.0000 0.5277 0.3946 0.3778 0.5445 CZ 0.5598 0.5106 1.0000 0.9107 0.6532 0.8265 HU 0.4308 0.3725 0.9035 1.0000 0.5687 0.7955 PL 0.4682 0.3868 0.6439 0.5561 1.0000 0.5238 SK 0.5550 0.5318 0.8368 0.7936 0.5441 1.0000 Source: own calculation
The most important results of this empirical analysis are presented in Fig. 2 and 3. The lower le triangle presents scaling behavior of dynamic correlation in diff erent frequencies without the lags. We can see that dynamic correlation is changing in the case of Czech Republic and Slovakia. In comparison with lagged time series (order one), the variability did not signifi cantly change in the Czech Republic and Slovakia but increased in Hungary and Poland. The variability of dynamic correlation increased even more with second order lag.
Let us focus now on diff erent frequencies. There is high correlation in low business cycle frequencies. When frequencies decreases to the upper bound of business cycle frequencies (6 quarters), dynamic correlation is going to decrease. This picture is visible for the lag of the order zero, one and order two as well. In frequencies higher then business cycles frequencies (closer to 1 at the x-axis; Fig. 2 and 3) the shape of the dynamic correlation curve looks similar, having slowly decreasing values. In case of Hungary is visible accretive tendency of variability in the cross of lags. Also changes in shape of
2: Dynamic correlation between the Eurozone and selected V4 countries
Note: Lower le triangle presents dynamic correlation without delay and upper right triangle presents dynamic correlation with lag of the order one.
dynamic correlation in business cycle frequencies came up especially for the lag of the order two. For Poland the dynamic of dynamic correlation curve increased simultaneously with lag order. The biggest increase in variability corresponds to the lag of the order two. Slovakia has also increased variability, but opposite to Hungary and Poland the biggest growth is yet for the lag of the order one.
The variability of dynamic correlation in diff erent frequencies is summarized in the Tab. II. According to the theoretical argumentation, there is possibility of spurious synchronization in the Czech Republic. Simultaneously, the mentioned variability decreases in business cycle frequencies. Obviously, the variability of dynamic correlation changes with time lag in all analyzed countries.
Note: Lower le triangle presents full range of frequencies, upper right triangle presents business cycle frequencies.
The Tab. III points out the possible spurious synchronization. There are results of dynamic correlation in full range and business cycles frequencies and its variability. Note that high correlation could be spurious if there is high variability in diff erent frequencies. We can assume that all V4 countries are correlated with the Eurozone and Germany. In case of the Czech Republic the dynamic correlation (in diff erent range of frequencies) is changing. There is possibility of biased results of correlation in time domain. On the contrary, the variability in the case of Poland is very low.
II: The variability of the dynamic correlation
Lag = 0 EA12 DE CZ HU PL SK
EA12 0.0000 0.0002 0.0172 0.0002 0.0000 0.0015 DE 0.0018 0.0000 0.0210 0.0014 0.0001 0.0049 CZ 0.0238 0.0371 0.0000 0.0092 0.2059 0.0024 HU 0.0006 0.0042 0.0100 0.0000 0.0010 0.0023 PL 0.0002 0.0008 0.0212 0.0028 0.0000 0.0177 SK 0.0024 0.0107 0.0018 0.0042 0.0158 0.0000
Lag = 1 EA12 DE CZ HU PL SK
EA12 0.0000 0.0001 0.0080 0.0011 0.0013 0.0020 DE 0.0022 0.0000 0.0070 0.0024 0.0029 0.0042 CZ 0.0329 0.0392 0.0000 0.0043 0.0113 0.0021 HU 0.0055 0.0207 0.0081 0.0000 0.0008 0.0005 PL 0.0017 0.0094 0.0257 0.0031 0.0000 0.0123 SK 0.0161 0.0344 0.0019 0.0028 0.0124 0.0000
Lag = 2 EA12 DE CZ HU PL SK
EA12 0.0000 0.0001 0.0058 0.0051 0.0227 0.0070 DE 0.0018 0.0000 0.0031 0.0060 0.0217 0.0082 CZ 0.0265 0.02327 0.0000 0.0017 0.0027 0.0014 HU 0.0301 0.05439 0.0047 0.0000 0.0009 0.0003 PL 0.0268 0.04244 0.0087 0.0028 0.0000 0.0096 SK 0.0279 0.04665 0.0011 0.0013 0.0078 0.0000 Source: own calculation
Note: Lower le triangle presents full range of frequencies, upper right triangle presents business cycle frequencies.
III: Possibility of spurious synchronization in V4 countries Country or
region
Dynamic Correlation in f.r.
Dynamic Correlation in BC
Dynamic Correlation variability (f.r., Lag=0)
Dynamic Correlation variability (BC, Lag=0)
EA12 DE EA12 DE EA12 DE EA12 DE
EA12 1.0000 0.9447 1.0000 0.9420 0.0000 0.0002 0.0000 0.0002 DE 0.9420 1.0000 0.9447 1.0000 0.0018 0.0000 0.0002 0.0000 CZ 0.7625 0.6498 0.7679 0.6562 0.0238 0.0371 0.0172 0.0210 HU 0.8193 0.6761 0.8262 0.6978 0.0006 0.0042 0.0002 0.0014 PL 0.7500 0.6467 0.7483 0.6442 0.0002 0.0008 0.0000 0.0001 SK 0.6416 0.5169 0.6464 0.5260 0.0024 0.0107 0.0015 0.0049 Source: own calculation
DISCUSSION AND CONCLUSIONS
Actual indicators of business cycle synchronization in time domain do not provide detailed information about the co-movements at diff erent frequencies. Concurrently, the central banks aff ect aggregate economic activity. Synchronization of short, medium and long-term waves is important in the context of the loss of autonomous monetary policy. Dynamic correlation changes (value, variability, variability changes with lags in time domain) provide a new instrument to identify spurious relationship between the economic indicators, especially spurious business cycle synchronization.
On the basis of preceding empirical work we defi ne decision rules in Tab. IV. These criteria help to decide whether synchronization between the business cycles are real or spurious. Denote that dynamic correlation is correlation of two spectra in frequency domain. From this point of view we will distinguish situation, whether variability of dynamic correlation is increasing, decreasing or stable.
Assume a few cases. (1) Two time series are not synchronized, time series have diff erent spectra thus dynamic correlation is insignifi cant. (2) Two time series are synchronized, they have similar shapes of spectra and corresponding dynamic correlation with small variability in diff erent frequencies. In that case the lag between countries does not have signifi cant impact on variability of dynamic correlation. (3) If time series are synchronized in time t (without lag), than imposing lag on country does not have signifi cant impact on spectra shape. In this way dynamic correlation and its variation is not signifi cantly diff erent from the case without lag. We can allow some small changes in variability of dynamic correlation with respect to the lag. (4) When variability of dynamic correlation with respect to the fi rst and consequently second lag caused its decrease, the synchrony arises. When its stay stable, we talk about synchronization.
On the contrary, the spurious synchronization is wrongly inferred co-movements in economic
activity which limit single monetary policy effi ciency in the currency area. In this paper is spurious synchronization based on the idea of signifi cant variability of dynamic correlation in diff erent frequencies. Tab. IV presents basic decision criteria with the monetary policy eff ects. The spurious synchronization is identifi ed if correlation in time domain (full range of frequencies) is signifi cant and positive and at the same time the dynamic correlation variability is high. In that case, exogenous shocks are country-specifi c shocks and common monetary policy effi ciency is limited in the currency union.
The business cycle synchronization in all selected countries, excluding Slovakia, is reduced with the lags. All correlation coeffi cients are statistically signifi cant and presents highly synchronized business cycles. The best synchrony shows Hungary and Poland and the lowest Slovakia. However, the following empirical analysis of dynamic correlation contests the results of time domain instruments. According to the decision criterion, it is important to decide if the variability of spurious correlation in diff erent frequencies is low or high.
There are now exact decision limits. There is possibility to compare the results with Germany, important economy of the Eurozone where we can suppose the endogeneity of European integration process. Using decision rules defi ned in article we found possible spurious synchronization in case of the Czech Republic. In the case of Hungary and Poland we can identify lower dynamic correlation variability in comparison with Germany. The synchronization of Slovakia is discussable. According to the decision rules, there is possibility of spurious synchronization but variability approaches the reference value. The spurious synchronization with the Eurozone was evidently identifi ed in the case of Czech Republic. According to the OCA theory and asymmetric shocks probability, the authors conclude that the single monetary policy is not suitable for this country regardless the correlation (in time domain – in full range of frequencies) is signifi cant and positive.
IV: Decision criteria for identifi cation of spurious synchronization
Correlation Dynamic Correlation Variability Result Single Monetary Policy
not signifi cant low not synchronized not effi cient high not synchronized not effi cient
signifi cant and positive low
business cycles synchronization,
symmetric shocks effi cient high spurious synchronization not effi cient signifi cant and negative low asymmetric shocks not effi cient high spurious synchronization not effi cient
SUMMARY
activity co-movements. The empirical part of the paper is based on the dynamic correlation analysis, especially on the variability of dynamic correlation in diff erent range of frequencies.
The authors defi ne the spurious synchronization as wrongly inferred co-movements in economic activity which limits single monetary policy effi ciency in the currency area. They suppose four situations of synchronized or asynchronized time series with similar or diff erent shapes of spectra. The authors apply a lag in time series too. Finally, they provide decision criteria to identify spurious synchronization of business cycles. According to this criterion they found spurious synchronization in the case of the Czech Republic. The results are discussed with the OCA theory assumptions.
Acknowledgement
The author benefi ted from comments by Jarko Fidrmuc, Karsten Staehr and Antonín Rusek. The results introduced in the paper are supported by the Czech Science Foundation via grant No. P402/11/0570 with the title “Time-frequency approach for the Czech Republic business cycle datting” and by the project CZ.1.07/2.3.00/20.0007 WICOMT of the operational program Education for competitiveness.
REFERENCES
AASTVEIT, K., A. et al., 2011: The world is not enough! Small open economies and regional dependence. Working Paper 2011/16, Norges Bank. BAXTER, R., KING, R., G., 1999: Measuring
Business Cycles: Approximate Band – Pass Filters for Economic Time Series. Review of Economic and Statistics, Vol. 81, No. 4, pp. 575–593.
CLARK, T., SHIN, K., 2000: The Sources of Fluctuations Within and Across Countries. In: HESS, G. D., WINCOOP, E.: Intranational Macroeconomics. Cambridge University Press, 2000. ISBN: 978-0521661638.
CORDEN, W., 1972: Monetary Integration, Essays in International Finance. International Finance, Section No. 93, 1972, Princeton University.
CROUX, C., FORNI, M., REICHLIN, L., 2001: A Measure of Comovement for Economic Variables: Theory and Empirics. The Review of Economics and Statistics, May 2001, 83(2): 232– 241.
DARVAS, Z., SZAPÁRY, G., 2008: Business Cycle Synchronization in the Enlarged EU, Open Econ. Rev., Vol. 19, pp. 1–19.
EUROSTAT, 2011: National Accounts (including GDP) [on-line, cit. 2011-08-01]. Dostupné na <http://epp.eurostat.ec.europa.eu/portal/ page/portal/national_accounts/data/database>. FIDRMUC, J., KORHONEN, I., 2006: Meta-analysis
of the business cycle correlation between the euro area and CEECs. Journal of Comparative Economics, Vol. 34, pp. 518–537.
HARDING, D., PAGAN, A., 2006: Measurement of Business Cycles, Research paper number 966, Melbourne, 2006. ISSN 0819-2642.
HODRICK, R. J., PRESCOTT, E. C., 1980: Post-war U.S. Business Cycles: An Empirical Investigation. Carnegie-Mellon University, Pitsburgh, PA., 24 pp.
CHRISTIANO, L. J., FITZGERALD, T. J., 1999: The band pass fi lter. Working paper 9906, Federal reserve bank of Cleveland.
IACOBUCCI, A., 2005: Spectral Analysis for Economic Time Series. OFCE Working Paper No. 2003-07.
IACOBUCCI, A., NOULLEZ, A., 2005: A Frequency Selective Filter for Short-Length Time Series, Computational Economics, 25, 75–102.
KENEN, P., 1969: The Theory of Optimum Currency Areas: An Eclectic View. In: MUNDELL, R. A., SWOBODA, A. K.: Monetary Problems in the International Economy. University of Chicago Press, Chicago. ISBN: 9780226550664.
KOOPMAN, S. J., AZVEDO, J. V. E., 2008: Measuring Synchronization and Convergence of Business Cycles for the Euro area, UK and US, Oxford Bulletin Of Economics and Statistics, 70, 1 (2008) 0305-9049, pp. 23–51.
KOSE, M. A. et al., 1993: International Business Cycles: World, Region, and Country-Specifi c Factors. The American Economic Review. Vol. 93, No. 4, pp. 1216–1239.
KRUGMAN, P., 1995: What Do We Need to Know About the International Monetary System. In: KENEN, P.: Understanding Interdependence, Princeton University Press, 1995, Princeton, pp. 509–530. McKINNON, R., 1963: Optimum Currency Area.
American Economic Review, September 1963, pp. 717–725.
MONGELLI, F. P., 2002: “New” views on the optimum currency area theory: what is EMU telling us? Working Paper Series 138, European Central Bank. MUNDELL, R. A., 1961: A Theory of Optimum
Currency Areas. The American Economic Review, LI, No. 4 (November 1961), pp. 509–517.
Address