O R I G I N A L R E S E A R C H
Dietary Intake of Infant and Young Children and
Assessment of Dietary Adequacy Indicators in
a Pastoral Setting, Southern Ethiopia
This article was published in the following Dove Press journal: Nutrition and Dietary Supplements
Bekele Megersa
Faculty of Veterinary Medicine, College of Computational and Natural Science, Hawassa University, Hawassa, Ethiopia
Introduction: Pastoral system is undergoing rapid socioeconomic transformation and livelihood shifts that may facilitate dietary transitions. Understanding the feeding practices and dietary intake is vitally important for designing an intervention program that addresses the nutrition needs of children in pastoral areas where scarcity of dietary information exists. Methods:Community-based study of dietary intake and questionnaire survey was conducted in Borana pastoral system of southern Ethiopia. The study aimed at investigating the dietary intake
of under-five children (n=538) and to assess how well dietary diversity score (DDS), milk and
meal frequencies estimate the adequacy of nutrient intake under pastoral context. Recipes and ingredients used to prepare the foods were recorded, and the portion size was estimated to calculate the nutrient contents per 100 grams of the food items. Then, nutrient adequacy ratio (NAR) of a given nutrient and mean adequacy ratio (MAR) were calculated.
Results:The study showed that children had a low level of DDS (2.7) and meal frequency (2.3), but had satisfactory milk frequency (4.3). About 31.2% of the children had met minimum meal frequency while only a few (11.7%) attained the minimum DDS. Dairy (99.8%) was the most consumed food item followed by cereals (83.6%) and legumes (53.5%). Thus, dairy contributed to a higher percentage (>85%) of calcium, vitamin A and Vitamin B2
require-ments. Dairy marketing was found to have significant effects on dietary patterns i.e. has
reduced milk frequency but associated with an increased number of meals per day. Overall, inadequate intakes (NAR < 66%) were observed for Vitamins A, B1, C, folic acid, and Iron. Assessment of dietary adequacy indicators showed that DDS had a greater ROC area (0.71) and better prediction of dietary quality than meal (0.62) and milk (0.50) frequencies, but did not differ from the average of milk and meal frequencies (0.64).
Discussion:Diets of the study children were much below the WHO standards with dairy
and cereals being the major component of child nutrition reflecting a typically low dietary
diversity in pastoral areas. As a result, study subjects had insufficient intakes of several
nutrients, implying the need for supplementing critical micronutrients. As dairy is the main
staple and local commodity its marketing was found to significantly influence the dietary
patterns of children. DDS was found to be the best indicator of dietary adequacy while the averaged frequencies of milk and meal also showed a promising result.
Keywords:children, dairy, dietary diversity, adequacy indicators: nutrients, pastoral
Introduction
Information on feeding practices and dietary intake is vitally important for designing required intervention measures that address the nutrition needs of children in pastoral areas where scarcity of nutrition information exists. Generally, dairy products are the
Correspondence: Bekele Megersa Faculty of Veterinary Medicine, College of Computational and Natural Science, Hawassa University, Hawassa, Ethiopia Email bekelebati@gmail.com
Nutrition and Dietary Supplements
Dove
press
open access to scientific and medical research
Open Access Full Text Article
Nutrition and Dietary Supplements downloaded from https://www.dovepress.com/ by 118.70.13.36 on 25-Aug-2020
major animal source foods in pastoral systems that substan-tially contribute to child nutrition. In addition to being a good source of energy and protein, milk provides several micronutrients and bioactive substances with growth-promoting abilities.1,2As pastoralists have limited access to a variety of food sources due to the unsuitability of the environment for vegetable and fruit production and prevail-ing climatic variability, they are largely dependent on milk and cereal consumption.3–5Dairy is thus a key food item that fulfills the nutritional requirements of pastoral children and contributes to their linear growth and health status. Studies also show that adequate milk intake improves nutri-tional status, cognitive functions and anthropometric mea-surements of children.6–8
Recent accounts show that the Borana pastoral system is undergoing a rapid socio-economic transformation that results in livelihood shifts towards agro-pastoral or settled farming and involvement in non-pastoral income-generating activities as a means of poverty alleviation or in response to increased climate variability and recurrent droughts.9–11 Additionally, the tendency of trading dairy products for food grains and other consumable items may also contribute to the dietary transition towards plant-dominated diets particularly among households closer to markets.12 However, the actual effects of milk selling on dietary intake, whether it is favoring or disfavoring dietary pattern in the pastoral area is not clear, and need further investigation. In general, the combined effects of these factors would speed the rate of dietary transition towards cereal-dominated stable food. Reduced dairy consumption along with consumption of cereal-dominated meals may further compromise the dietary quality and nutritional status of children. Under livelihood transitions, diets of children are not only poor in essential micronutrients and but also contain anti-nutrient factors that reduce the bioa-vailability of some micronutrients. Two studies that com-pared pastoral and settled communities have demonstrated the negative impacts of reduced milk consumption on the nutritional status of children in Kenya13 and Nigeria,14 which suggests the need for investigating dietary intake in the pastoral areas.
Measurements of dietary intake among children often rely on different proxy indicators because no single mea-surement tool can estimate precisely the actual nutrient intake. Among proxy measures used, dietary diversity score (DDS) of seven food groups is the one recommended to assess the nutrient intake of infants and children.15 However, the prevailing low levels of dietary diversity
may constrain DDS as a measure of dietary intake for pastoral areas, where only a few food groups are consumed with dairy products. Additionally, previous studies did not consider meal and milk frequencies as proxy measures of dietary intake. In particular, since dairy is the major staple diet of pastoralists, the use of milk frequency as dietary measurement may provide an alternative proxy indicator. In this study, we explore the dietary intake of children, the contribution of dairy to nutrient intake and assess three proxy indicators (DDS, milk and meal frequencies) in Borana of southern Ethiopia.
Methodology
Study Design and Samplings
A community-based study of dietary intake and question-naire survey was conducted in Borana pastoral system of southern Ethiopia between August and October 2015. Additionally, repeated measurements of dietary diversity, milk intakes and market prices of food items were also conducted for subsample households (n=60) between August 2015 and March 2016. A total of six pastoral associations (PAs), the lowest administrative units, were randomly selected from 18 PAs in Yabello district. Following study site selection and pretest of the question-naire in August 2015, a cluster sampling method was used to sample all eligible households from selected villages who had at least one child within the age range of 6 to 59 months. Every mother of a selected household and her one or more children were recruited for the study.
The sample size was estimated using a presumed popu-lation proportion of minimum meal frequency (42%) report of the Ethiopian demographic and health survey,16 95% confidence level, the marginal error of 5% and design effect (1.5 times), which gives a total of 561 subjects. We stratified the sample size into two major livelihoods as 70% cattle and 30% camel herding based on their propor-tion. Subsequently, a total of 538 children (6–59 months) with complete information were sampled.
Data Collection
Questionnaire survey was used to record socioeconomic variables, household characteristics (family size, educa-tion, polygamy, economic variables), maternal character-istics (age, number of children ever born, education and autonomy in decision-making) and child characteristics (age, sex, birth order, place of delivery), child feeding practices, child health care and illness history, access to
Nutrition and Dietary Supplements downloaded from https://www.dovepress.com/ by 118.70.13.36 on 25-Aug-2020
safe water and sanitary facilities. Dietary data were col-lected on each day of the week by three experienced data collectors with a diploma in clinical nursing.
Dietary data such as dietary intake (amount and dietary diversity), dairy consumption (amount and frequency) and meal frequency were collected using 24 hrs dietary recalls. Mothers or other primary caretakers of children were inter-viewed to assess dietary diversity according to the seven food group model of the WHO guidelines.15 Mothers or primary caregivers were asked to provide information on the frequency and duration of breastfeeding. They were also asked to list and qualitatively describe all the food items consumed by their children during the previous 24 hrs. Then, the actual food samples either purchased from local food vendors or collected from villagers (with payment compensation) were weighed using SF-400 kitchen scale. Before weighing, each mother was requested to estimate the amount consumed or portion size of a specific food item and dairy she fed to her child during each meal session. Additionally, collections of monthly data on dietary diversity and milk consumption (September 2015 to March 2016), and weekly market prices of milk, maize and beans (August 2015 to March 2016) have been performed for 10% samples.
Estimation of Nutrient Intakes
Briefly, the nutrient contents per 100 g of the food items and recipes were calculated using the Food Composition Table of Ethiopia17,18and Nutrisurvey2007 software. The energy and nutrient intake of children were compared with the recom-mended nutrient intake (RNI) according to the Food and Agriculture Organization of the United Nations.19,20The nutri-ent intakes of breastfed children were calculated separately according to average breast milk intake (equivalent to 533 mL per day) and composition as described by Dewey and Brown.21Nutrient adequacy ratio (NAR) of a given nutrient was estimated as a ratio of the actual intake of the nutrient per day to recommended nutrient intake by sex and age group. Nutrient intakes were assessed as inadequate intake if NAR < 66%, (2) fairly adequate intake (NAR: 66% to < 100%), and adequate intake for NAR≥100%.22The mean adequacy ratio (MAR) was calculated as the sum of all NARs divided by the number of nutrients by truncating NAR of each nutrient at 100%.23Then, the median of nutrient adequacy ratio (NAR) was calculated and used as a composite indicator for micro-nutrient adequacy (cutoff point) to evaluate the proxy indica-tors. Accordingly, the considered indicators, milk frequency, meal frequency, and their averages were compared with the dietary diversity score.
Data Analysis
Different socio-economic variables, dietary diversity score meal frequency, milk frequency were descriptively summarized as a proportion or mean. Wilcoxon rank-sum test was used to assess the effects of dairy market-ing practices on dietary intakes (DDS, milk and meal frequencies) of the study children. The nutrient adequacy ratio of consumed food items was summarized by selected nutrients. The relative contribution of dairy to energy and each micro-nutrient intake was estimated. The dietary intake indicators were plotted with mean nutrient adequacy ratio (MAR) using Lowess curve. The receiver operating characteristic curve (ROC) was used to assess the sensitivity and specificity of the three indicators in estimating the median nutrient adequacy ratio (at 70% cutoff point). The equality of ROC areas of milk and meal frequencies, and their averages were compared with DDS as“gold standard”using Stata soft-ware version 14.2 (College Station, TX, USA).
Ethical Considerations
Following the submission of proposal and questionnaire formats, the study was approved by the Ethical Committee of the Health Bureau of South Regional Sate. Permission was also received from the Borana zone health depart-ment. Informed verbal consent was obtained from each mother or caretaker of children after informing them about the purpose, benefit, and confidentiality of the infor-mation. Participants were told that their participation in the study is voluntary and that they can withdraw at any time; they were given the opportunity to ask study-related ques-tions. Thus, this study was conducted in accordance with the declaration of Helsinki.
Results
Table 1 presents a summary of socioeconomic variables and characteristics of study children. About 62% of the households were Borana (cattle based livelihood) and the remaining proportion was Gabra who rely on camel pro-duction. Households had an average family size of seven individuals, and 11% of them were polygamous. Besides livestock production, households also engaged in crop cultivation (88%) and non-pastoral activities (25%). A significant percent of the households had a toilet (62%), at least a mobile phone (66%) and a radio (35%) per family. Households need to walk on average over an hour to nearby health institutions and water points,
Nutrition and Dietary Supplements downloaded from https://www.dovepress.com/ by 118.70.13.36 on 25-Aug-2020
and about 2 hrs or more to the closest market. The average age of mothers or caretakers was 29 years (19–65), they had a low level of literacy (12%) and meager participation in decision-making on household resources (18%). Mothers gave birth to five children on average, of which 30% were <5. Most of the mothers (83%) were visited by health extension agents and received advice on general hygienic and sanitary practices as well as child feeding practices.
The study children consist of 270 boys and 268 girls with an average age of 32.7 months. About 86% of chil-dren aged 6–23 months were breastfeeding and 29.3% of them had exclusive breastfeeding until 6 months of age. A few children (1%) started complementary foods at 6 months of age and 44% of them received complementary foods from 6 to 8 months while others started at later ages. Most of the children were vaccinated (97%) and received vitamin A supplement (88%) prior to the survey.
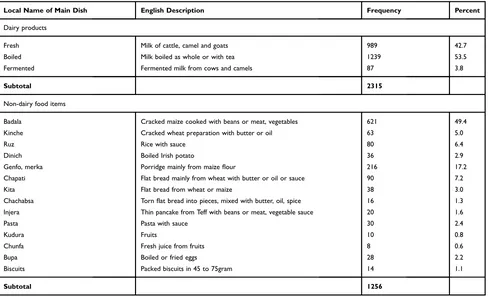
Table 2presents summary of consumed dairy products and various meal preparations. Most of the children con-sumed fresh milk (43%) and boiled (53%), while few of them (3.8%) fed fermented milk. Considerable proportion of children especially above 12 months of age consumed milk-tea (22%) which is assumed to contain anti-nutrient factor that may interfere with absorption of calcium and
Table 1 Socio-Economic Variables, Mother and Child Characteristics
Description of Variables ‡Percent (%)/Average
Child and mother characteristics
Age of children in months 32.7
Child sex: (female=0, male=1) 50.2
Exclusive breastfeeding (no=0, yes=1) 29.1
Complementary foods (6–8MON) 44.0
Mother age (years) 29.4
Mother education: (no=0, yes=1) 12.5
Polygamy: (no=0, yes=1) 10.0
Decision-making: (no=0, yes=1) 17.6
Number of children ever born 4.6
Household characteristics
Ethnic: (Gabra=0, Borana=1) 61.7
Family size 6.6
Lactating animals in TLU 2.5
Chicken rearing: (no=0, yes=1) 50.3
Number of livestock species 3.4
Milk selling: (no=0, yes=1) 39.2
Off-farm incomes: (no=0, yes=1) 24.7
Crop cultivation: (no=0, yes=1) 87.9
Own toilet: (no=0, yes=1) 61.9
Own radio: (no=0, yes=1) 35.3
Own mobile: (no=0, yes=1) 66.7
Note: ‡Percent is for category 1; quantitative variables were averaged. TLU tropical livestock unit equivalent to 250 kg.
Table 2Types Dairy Products and Food Preparations That Consumed by Children During Meal Sessions
Local Name of Main Dish English Description Frequency Percent
Dairy products
Fresh Milk of cattle, camel and goats 989 42.7
Boiled Milk boiled as whole or with tea 1239 53.5
Fermented Fermented milk from cows and camels 87 3.8
Subtotal 2315
Non-dairy food items
Badala Cracked maize cooked with beans or meat, vegetables 621 49.4
Kinche Cracked wheat preparation with butter or oil 63 5.0
Ruz Rice with sauce 80 6.4
Dinich Boiled Irish potato 36 2.9
Genfo, merka Porridge mainly from maizeflour 216 17.2
Chapati Flat bread mainly from wheat with butter or oil or sauce 90 7.2
Kita Flat bread from wheat or maize 38 3.0
Chachabsa Tornflat bread into pieces, mixed with butter, oil, spice 16 1.3
Injera Thin pancake from Teff with beans or meat, vegetable sauce 20 1.6
Pasta Pasta with sauce 30 2.4
Kudura Fruits 10 0.8
Chunfa Fresh juice from fruits 8 0.6
Bupa Boiled or fried eggs 28 2.2
Biscuits Packed biscuits in 45 to 75gram 14 1.1
Subtotal 1256
Nutrition and Dietary Supplements downloaded from https://www.dovepress.com/ by 118.70.13.36 on 25-Aug-2020
iron. The most commonly consumed local food prepara-tions were Badala (49.4%) followed by porridge (17.2%), chapatti (7.2%), rice (6.4%), kinche (5%), and kita (3%). Additionally, about 7% and 18% of the children ate dif-ferent foods prepared with meat and vegetables.
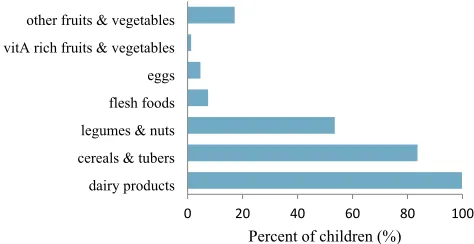
Figure 1presents percent of study children by seven food group consumption. Dairy was consumed by nearly all chil-dren (99.8%) across the age groups while consumption of cereals (83.6%) and legumes (53.5%) have increased with age groups. But a few children consumed animal source foods other than dairy such as meat (7.4%) and eggs (4.5%) while none of them atefish or chicken. Vitamin A-rich fruits and vegetables were the least consumed food groups. Considerable proportion (34.8%) of the children had the lowest dietary diversity intake (1–2 food groups). About half of the children (53.5%) consumed 3 food groups while few of them (11.7%) ate a relatively more diverse diet (4 to 5 food groups). In general, dietary diversity was found to be very low (2.7 out of 7 food groups) and highly variable with 33% coefficient of variation (CV). The average daily milk and meal frequencies were 4.3 (CV: 28%) and 2.3 (CV: 47%) times per day, respectively. The majority of the children (>90%) had milk frequency of four and above, while only a few children (11.7%) received the minimum dietary diversity of four and above food groups, and some of them (31.2%) met the minimum meal frequency.
About 39% of the households sold about 10–50% of the milk they produce with a higher proportion (62%) selling camel milk . Dairy marketing is mainly used to meet some
financial requirements for purchasing food grains and other consumable commodities.Table 3shows the effects of milk selling practices by households on the dietary intakes of study children. Milk selling had significantly reduced average daily milk intakes (4.2) by children when compared to those who do not sell (4.4). As a result, lower proportion of children (36.5%) from milk-selling groups had four and above milk intake compared to their counterparts (63.4%). But meal frequency was significantly higher for milk selling than other groups with much higher proportion of children in milk-selling group (64.2%) had three and above meals per day compared to others (35.8%). There were no differences for DDS and average milk and meal frequencies by milk off-take. DDS and meal frequency showed an increasing trend with age of children, while daily milk consumption was decreasing.
Figure 2showsfluctuations of DDS, and milk consump-tion with market prices of milk and food grains. DDS and milk intakes increased at the end of short rainy season in November and declined afterwards. Market price of milk also showed moderate seasonal fluctuation being higher during September and October and lower in November and December whereas no much variation in maize and beans. This slight increase in DDS and dairy consumption was found to coincide with decline in market prices. But as the study area received good rain during the survey period, muchfluctuation could not be observed. Larger proportion of camel keepers sold milk at local and cross border markets (e.g., Moyale town, northern Kenya), while cattle milk was mainly sold locally during the wet season. The higher price
fluctuation of cattle milk also reflects high variability in their seasonal production and supply.
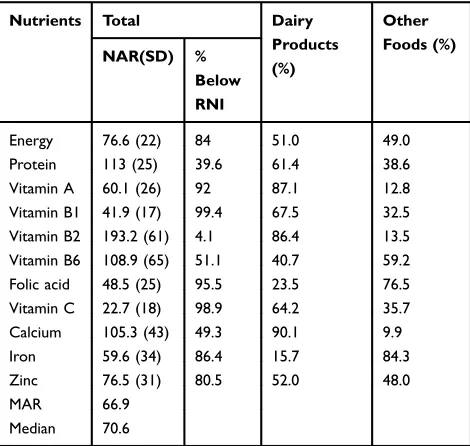
Table 4is a summary of nutrient adequacy ratio (NAR) in percent, and contributions of milk and other food sources to nutrient requirements. The overall mean ade-quacy ratio (MAR) and median of NARs were calculated
0 20 40 60 80 100
dairy products cereals & tubers legumes & nuts flesh foods eggs vitA rich fruits & vegetables other fruits & vegetables
Percent of children (%)
Figure 1Percent of study subjects by food group consumption.
Table 3Effects of Dairy Marketing Practices on Dietary Patterns of 538 Children
Dietary Intake Indicators None-Milk Selling (61%) Milk Selling (39%) Z value P-value
Mean (SD) Median (Range) Mean (SD) Median (Range)
Dietary diversity score 2.7(0.86) 3(4) 2.6(0.88) 3(4) 1.05 0.2961
Milk frequency 4.4(1.10) 5(6) 4.2(1.20) 4(7) 2.39 0.0167
Meal frequency 2.3(1.07) 3(4) 2.4(1.114) 3(5) −2.52 0.0119
Average of milk-meal frequencies 3.3(0.60) 3.5 (3.5) 3.3(059) 3 (3) 0.75 0.4507
Note:SD: standard deviation was used for means and range was used with median.
Nutrition and Dietary Supplements downloaded from https://www.dovepress.com/ by 118.70.13.36 on 25-Aug-2020
to be 66.9% (range: 21.4–96%) and 70.6% (range: 14.5 to 100), respectively. About 10% of the children had MAR below 50% while 62% and 28% of them were between 50% and 75%, and above 75%, respectively. The study children had attained the required nutrient adequacy ratio (NAR) on average for protein, vitamins B2, B6 and cal-cium, while intake of zinc was fair. But inadequate intakes (NAR <66%) were observed for Vitamins A, B1, C, folic acid, and Iron. Thus, majority of the children (over 85%) did not meet their nutrient requirements for energy, critical micronutrients including vitamins A, B1, folic acid and C, and iron and zinc. Dairy products had contributed substan-tially (>85%) to calcium, vitamin A and Vitamin B2 requirements, but had the lowest content of iron, folic acid and vitamin C.
Figure 3depicts the relationship between median MAR versus individual dietary intake indicators, and their sensi-tivity and specificity at 70.6% cutoff point (median) of NAR. Results of individual indicators showed that DDS of four and above food groups can estimate over 80% of MAR, while four times and more daily intake of milk and meal seem to predict about 70% of the MAR. As indicated byTable 5, DDS had a significantly greater ROC area (0.71) compared to meal (0.62) and milk (0.50) frequencies and the average of milk and meal (0.64). The sensitivity and specificity of the three indicators showed that DDS three and above provided better predictions of MAR with 80.8% sensitivity and 45.8% specificity, and 60% correct classifi -cations compared to meal three times a day and above having 73.0% sensitivity and 47.8% specificity, and 58.0% correct classification. But milk frequency performed the lowest predication (sn=49.3%, sp=48.9% and 49.1 correct classification) at a relatively higher frequency of four and above per day. Averaged milk and meal frequencies above three (3.5) had AUC of 64%, with comparable sn=63, sp=55% and 58% correct classification compared to DDS.
Discussion
Diets of study children were characteristically dominated by high intake of dairy products in form of fresh whole milk, fermented and boiled milk, and cereal base dishes such as locally called Badala (cracked maize cooked with beans and vegetables). Accordingly, suboptimal dietary intake was observed with diets much below the WHO recommended minimum diversity and meal frequency.15 Previous studies in pastoral communities also reported low dietary diversity with dairy and cereals being the major food groups.3,5,24,25 Similarly, such low levels of dietary diversity scores have been previously reported from dif-ferent parts of Ethiopia: 2.2 by Arimond and Ruel,26 2.2 by Beyene et al27 and 2.1–2.3 by Wondafrash et al.28 Hirvonen29 also compared dietary diversity in Ethiopia
0 1 2 3 4 5 6
Sep Oct Nov Dec Jan Feb Mar
DDS/ Milk frequency
(No)
DDS milk freq
0 2 4 6 8 10 12 14
Jul Aug Sept Oct Nov Dec Jan Feb Mar
Price in
Birr
per kg
bean maize
camel_milk cow_milk
Figure 2Relationship between milk frequency and dietary diversity and market prices of food items (plotted prices were for 0.5 kg milk and 1 kg maize and bean).
Table 4The Nutrient Adequacy Ratio (%) and Contributions of Milk and Other Food Sources to Energy and Other Micro-Nutrient of Study Children
Nutrients Total Dairy
Products (%)
Other Foods (%) NAR(SD) %
Below RNI
Energy 76.6 (22) 84 51.0 49.0
Protein 113 (25) 39.6 61.4 38.6
Vitamin A 60.1 (26) 92 87.1 12.8
Vitamin B1 41.9 (17) 99.4 67.5 32.5
Vitamin B2 193.2 (61) 4.1 86.4 13.5
Vitamin B6 108.9 (65) 51.1 40.7 59.2
Folic acid 48.5 (25) 95.5 23.5 76.5
Vitamin C 22.7 (18) 98.9 64.2 35.7
Calcium 105.3 (43) 49.3 90.1 9.9
Iron 59.6 (34) 86.4 15.7 84.3
Zinc 76.5 (31) 80.5 52.0 48.0
MAR 66.9
Median 70.6
Abbreviations:RNI, recommended nutrient intake; MAR, mean nutrient ade-quacy ratio; NAR, nutrient adeade-quacy ratio (%).
Nutrition and Dietary Supplements downloaded from https://www.dovepress.com/ by 118.70.13.36 on 25-Aug-2020
with other sub-Saharan countries and found Ethiopian children to consume one of the least diverse diets in the continent, especially in rural settings. Observed low diet-ary diversity can be linked to the limited access of pastor-alists to a variety of food groups, and the unsuitability of the arid environment for growing fruit and vegetables. Low intake of animal-source foods (non-dairy) could be explained by the fact that animals are rarely slaughtered for meat consumption (other than for ceremonial
purposes), while unfamiliarity with some food items such as chicken, eggs, and unavailability of fish in the area might have reduced their consumption. Low level of for-mal education and awareness among mothers on the nutri-tional quality of foods,30 growing climatic variability (recurrent droughts) and related food insecurity10 also contribute to low dietary diversity.
Seasonal patterns of dietary diversity, dairy intake and marketing food items of sub-populations suggested some degree fluctuations with market prices of two main food items (dairy and maize). Dietary intakes found to increase at the end of the short rainy season in November, which could be regarded as harvest period when food crops such as maize and beans as well as vegetables can be consumed from their own farms. Additionally, increased milk production can be expected as the area received good rain during the study period. This also might increase the market supply of farm produce and dairy products, and subsequently, reduces the price of milk and maize as observed in November and Lowess curve
A
B
C
D
of DDS, milk & meal with MAR Sn and Sp of DDS with milk frequency
Sn and Sp of DDS with meal Sn and Sp of DDS with average meal-milk
0.0 0.2 0.4 0.6 0.8 1.0 1.2
1 2 3 4 5 6 7 8 9
Sp & Sn
number of DDS and milk frequeancy
dds_sp dds_sn milk_sp milk_sn
0.0 0.2 0.4 0.6 0.8 1.0 1.2
1 2 3 4 5 6 7 8 9
Sp & Sn
number of meals and food groups dds_sp dds_sn meal_sp meal_sn
0.0 0.2 0.4 0.6 0.8 1.0 1.2
1 2 3 4 5 6 7 8 9
Sp & Sn
average of meal & milk, and DDS
dds_sp
dds_sn
mm_sp
mm_sp
Figure 3Dietary adequacy indicators with MAR (A), and their sensitivity and specificity curves at median nutrient adequacy ratio using dietary diversity score (B–D).
Table 5Comparison of the Four Indicators Using ROC Curve
Dietary Indicators AUC SE Χ2 df Pr>chi2
DDS (reference) 0.71 0.02
Milk frequency 0.50 0.02 41.7 1.0 0.000
Meal frequency 0.62 0.02 4.8 1.0 0.035
Averaged milk meal frequency
0.64 0.02 2.9 1.0 0.074
Abbreviation:AUC, area under curve.
Nutrition and Dietary Supplements downloaded from https://www.dovepress.com/ by 118.70.13.36 on 25-Aug-2020
December. In pastoral areas, milk for home consumption is actually prone to dry seasonal short supply and increasing off-take for cash income or trading for food grains. The closer the households to market center the more tendencies they sell milk and ultimately reduce its proportion in diets.12,31The association of milk marketing with a reduced number of milk intakes per day and increased meal frequen-cies signify that households exchange dairy products of high-value animal-source protein with starch or energy-rich cereals. This would reduce the share of dairy products (the major animal-source foods) in their diets and can compro-mise their dietary quality, the adverse effects of which need further investigation. Exchange of dairy products with food grains can be beneficial with sufficient supply and high exchange value.12 Accordingly, retaining the optimum amount of milk for children’s consumption and seeking alternative income-generating sources would contribute to improved child nutrition in the study area. Additionally, promoting consumption of chicken and eggs is also another option that augments nutrient intake, since over half of the households were rearing backyard chickens mainly for sell-ing eggs.
Results showed that dairy remains an integral part of the diets of the children as consumed by nearly all study subjects. Dairy contributed to higher intakes of energy, calcium, and vitamin A, vitamin B2, vitamin B1, Zinc and protein, but found to be poor in vitamin C and iron contents. A similar observation was also made in Kenya where milk provided higher proportions of vitamins A, B12, and C intakes by pastoral children.24 As access to diverse food sources is so limited in this study area, people largely depend on dairy consumption that partly compensates for the prevailing low dietary diversity in the area. Thus, milk can be regarded as a universal food item that can fulfill the nutritional require-ments of pastoral children and ensures their linear growth and good health. Studies also show that adequate milk intake improves nutritional status, cognitive functions and anthropo-metric measurements of children.6–8 Besides being a good source of energy and essential micronutrients, milk provides several micronutrients and bioactive substances having growth-promoting factors that bring about taller stature.1,2 The taller and slender stature that enabled pastoralists to survive in arid environments is indeed evolved from the long-term effects of dairy intakes.
In addition to being poor sources of some essential micro-nutrients, consumed food items also contain com-pounds that may inhibit the absorption and bioavailability of some micronutrients. For instance, cereals such as maize
meals are the most commonly consumed diet, contain phy-tate that may inhibit vitamin A or iron absorption.32 Similarly, about 22% of study children consumed milk boiled with tea, which is assumed to contain phenolic acid that may interfere with iron absorption. High consumption of dairy products, mostly cow milk contains a high level of casein, calcium and phosphorous that may interfere with non-heme iron absorption, leading to the risk for iron defi -ciency anemia. Thus, observed low intake of iron and vita-min C could be linked to a higher intake of cow milk, which might be a poor source of these micronutrients. Cow milk also assumed to reduce the absorption of these scarce micronutrients and worsening their bioavailability.33,34 Hence, providing supplements that are rich in iron, or iron-fortified food, and promoting the intake of camel milk and consumption of locally available vitamin C-rich fruits and vegetables are recommended measures to combat the micronutrient shortfall in the study area.
Assessment of different dietary intake indicators showed that dietary diversity above three food groups provided a higher mean adequacy ratio compared to milk and meal frequencies. As a result, DDS was found to be the best pre-dictor of dietary quality, though the average of milk and meal frequencies provided a fair estimate of mean adequacy ratio. The average of meal and milk frequencies can be considered as taking meal preparation with dairy products during meal sessions. As dietary diversity within pastoralist populations is very low, Villa et al5defined their dietary diversity in their study as“if an individual consumed three meals of maize, one helping of beans, and two servings of milk, the dietary diver-sity count would be three”. With this analogy, the average of meal and milk above three frequencies may be equivalent to the consumption of at least three cereals, one bean meal, and two or three dairy products per day. This can be considered as a simple tool to estimate the average dietary intake for pastoral areas such as during quick dietary surveys.
The limitation of frequency-based indicators is that they do not show the extent of dietary diversity (i.e. the same food group can be frequently consumed) or intake of nutrient-dense food groups such as animal-source foods that substantially contribute to dietary quality. Increase frequency also does not necessarily indicate an increase in quantity, when a small amount of a food item consumed at a time such as in the case of infants and young children below 2 years. For instance, infants had the highest fre-quency of dairy intake with likely intake of small quanti-ties at a time. In general, DDS is still the best proxy indicator of dietary intake, even for pastoral settings
Nutrition and Dietary Supplements downloaded from https://www.dovepress.com/ by 118.70.13.36 on 25-Aug-2020
where food variety is so limited. This observation also supports reports of previous studies in which dietary diver-sity score has been reported as good dietary quality indi-cators in different areas.28,35,36
Conclusion
The study results demonstrate that the diets of the study children were less diverse and much below the WHO stan-dards. Dairy remains an integral part of children’s diets and contributed to a higher proportion of energy, protein, and other micronutrients. Apart from being the main staple food, dairy products are the alternative local commodity that can be exchanged with food grains, which explain the significant influence of dairy marketing on the dietary patterns of chil-dren. In general, study children had an adequate intake of protein, vitamins B2, B6, and calcium, while inadequate (NAR <66%) intakes of vitamin A, B1, C, folic acid, and Iron were observed. Assessment of proxy indicators revealed DDS to be the best proxy indicator of dietary intake, fol-lowed by average of milk and meal frequencies.
Acknowledgment
This study was funded by the UKAID in collaboration with Tufts University. Financial supports and contribution mothers and caretakers of study children, staffs of Yabello health centers who involved in data collection and IMMANA coordinating team deserve grateful appreciation.
Funding
A postdoctoral research fellowship funded by UKAID from the UK government.
Disclosure
The author reports no conflict of interest in this work.
References
1. Hoppe C, Mølgaard C, Michaelsen KF. Cow’s milk and linear growth in industrialized and developing countries. Annu Rev Nutr. 2006; 26:131–173. doi:10.1146/annurev.nutr.26.010506.103757
2. Raikos V, Dassios T. Health-promoting properties of bioactive pep-tides derived from milk proteins in infant food: a review.Dairy Sci Technol.2014;94(2):91–101. doi:10.1007/s13594-013-0152-3 3. Sadler K, Kerven C, Calo M, Manske M, Catley A. The fat and the
lean: review of production and use of milk by pastoralists. Pastoralism.2010;1(2):291–324. doi:10.3362/2041-7136.2010.016 4. Mengistu G, Moges T, Samuel A, Baye K. Energy and nutrient intake
of infants and young children in pastoralist communities of Ethiopia. Nutrition.2017;41:1–6. doi:10.1016/j.nut.2017.02.012
5. Villa KM, Barrett CB, Just DR. Whose fast and whose feast? Intra-household asymmetries in dietary diversity response among East African pastoralists. Am J Agric Econ. 2011;93:1062–1081. doi:10.1093/ajae/aar038
6. Thi D, Lien K, Thi B, et al. Impact of milk consumption on perfor-mance and health of primary school children in rural Vietnam.Asia Pac J Clin Nutr.2009;18(3):326–334.
7. Rahmani K, Djazayeri A, Ibrahimhabibi M, et al. Effects of daily milk supplementation on improving the physical and mental function as well as school performance among children: results from a school feeding program.J Res Med Sci.2011;16(4):469–476.
8. Dror DK, Allen LH. The importance of milk and other animal-source foods for children in low-income countries. Food Nutri Bull.
2011;32:227–243.
9. Desta S, Coppock DL. Pastoralism under pressure: tracking system change in Southern Ethiopia. Hum Ecol. 2004;32(4):465–486. doi:10.1023/B:HUEC.0000043516.56037.6b
10. Megersa B, Markemann A, Angassa A, Valle Zárate A. The role of livestock diversification in ensuring household food security under a changing climate in Borana, Ethiopia. Food Secur. 2014;6 (1):15–28. doi:10.1007/s12571-013-0314-4
11. Tache B, Oba G. Is poverty driving Borana Herders in Southern Ethiopia to crop cultivation? Hum Ecol. 2010;38:639–649. doi:10.1007/s10745-010-9349-8
12. Holden SJ, Coppock DL, Assefa M. Pastoral dairy marketing and house-hold wealth interactions and their implications for calves and humans in Ethiopia.Hum Ecol.1991;19(1):35–59. doi:10.1007/BF00888976 13. Fratkin E, Roth EA, Nathan MA. Pastoral sedentarization and its effects
on children’s diet, health, and growth among Rendille of Northern Kenya. Hum Ecol.2004;32(5):531–559. doi:10.1007/s10745-004-6096-8 14. Ekpo UF, Omotayo AM, Dipeolu MA. Prevalence of malnutrition
among settled pastoral Fulani children in Southwest Nigeria.BMC Res Notes.2008;1:7. doi:10.1186/1756-0500-1-7
15. WHO. Indicators for Assessing Infant and Young Child Feeding Practices;2010.
16. DHS. Ethiopian Demographic and Health Survey. Addis Ababa, Ethiopia: Central Statistical Agency;2011. Available from: http:// Www.Measuredhs.Com;2011. Accessed January 23, 2020.
17. EHNI.Ethiopian Traditional Recipes. 1st ed. Addis Ababa: Ethiopian Health and Nutrition Institute (EHNI);1980.
18. EHNRU. Food Composition Table for Use in Africa.1968;1:2012. doi10.1016/s0022-3182(69)80022-1
19. FAO/WHO/UNU J. Human energy requirements. Scientific back-ground papers from the Joint FAO/WHO/UNU Expert Consultation. October 17-24, 2001. Rome, Italy. Public Health Nutr. 2005;8 (7A):929–1228. doi10.1079/phn2005778
20. WHO FAO. Vitamin and mineral requirements in human nutrition, Second edition.Jt FAO/WHO Expert Consult Hum Vitam Miner Requir.1998;1–362.
21. Dewey KG, Brown KH. Special issue based on a world health organization expert consultation on complementary feeding.Food Nutr Bull.2003;24(1):1–141.
22. Singh A, Gupta V, Ghosh A, Lock K, Ghosh-jerath S. Quantitative estimates of dietary intake with special emphasis on snacking pattern and nutritional status of free living adults in urban slums of Delhi: impact of nutrition transition.BMC Nutri.2015;1:1–11. doi:10.1186/ s40795-015-0018-6
23. Hatløy A, Torheim LE, Oshaug A. Food variety - a good indicator of nutritional adequacy of the diet? A case study from an urban area in Mali, West Africa. Eur J Clin Nutr. 1998;52(12):891–898. doi:10.1038/sj.ejcn.1600662
24. Iannotti L, Lesorogol C, Animal milk sustains micronutrient nutrition and child anthropometry among pastoralists in Samburu, Kenya.Am J Phys Anthropol.2014;155(1):66–76. doi:10.1002/ajpa.v155.1 25. Lindtjørn B, Alemu T, Bjorvatn B. Dietary pattern and state of nutrition
among children in drought-prone areas of southern Ethiopia.Ann Trop Paediatr.1993;13(1):21–32. doi:10.1080/02724936.1993.11747621 26. Arimond M, Ruel MT. Dietary diversity is associated with child
nutri-tional status: evidence from 11 demographic and health surveys.J Nutr.
2018;134(10):2579–2585. doi:10.1093/jn/134.10.2579
Nutrition and Dietary Supplements downloaded from https://www.dovepress.com/ by 118.70.13.36 on 25-Aug-2020
27. Beyene M, Worku AG, Wassie MM. Dietary diversity, meal fre-quency and associated factors among infant and young children in Northwest Ethiopia: a cross-sectional study. BMC Public Health.
2015;15(1):1007. doi:10.1186/s12889-015-2333-x
28. Wondafrash M, Huybregts L, Lachat C, Bouckaert KP, Kolsteren P. Dietary diversity predicts dietary quality regardless of season in 6– 12-month-old infants in south-west Ethiopia Dietary diversity score and micronutrient density. Public Health Nutr. 2016;(14):1–10. doi:10.1017/S1368980016000525
29. Hirvonen K. Rural–urban differences in children’s dietary diversity in Ethiopia: a poisson decomposition analysis.Econ Lett.2016;147:12–15. doi:10.1016/j.econlet.2016.08.003
30. Hirvonen K, Hoddinott J, Minten B, Stifel D. Children’s diets, nutri-tion knowledge, and access to markets.World Dev.2017;95:303–315. doi:10.1016/j.worlddev.2017.02.031
31. Kebede S, Animut, G., & Zemedu, L.The Contribution of Camel Milk to Pastoralist Livelihoods in Ethiopia. An Economic Assessment in Somali Regional State. London; 2015. http://pubs.iied.org/ 10122IIED. Accessed January 23, 2020.
32. Onyango AW. Dietary diversity, child nutrition and health in con-temporary African communities. Comp Biochem Physiol - A Mol Integr Physiol. 2003;136(1):61–69. doi:10.1016/S1095-6433(03) 00071-0
33. Oliveira MAA, Osório MM. Cow’s milk consumption and iron defi -ciency anemia in children. J Pediatr (Rio J).2005;81(5):361–367. doi:10.2223/jped.1386
34. Ziegler EE. Consumption of cow’s milk as a cause of iron defi -ciency in infants and toddlers.Nutr Rev.2011;69:37–42. doi:10.1111/ j.1753-4887.2011.00431.x
35. Torheim LE, Ouattara F, Diarra MM, et al. Nutrient adequacy and dietary diversity in rural Mali: association and determinants. Eur J Clin Nutr.2004;58(4):594–604. doi:10.1038/sj.ejcn.1601853 36. Steyn NP, Nel JH, Nantel G, Kennedy G, Labadarios D. Food variety
and dietary diversity scores in children: are they good indicators of dietary adequacy?Public Health Nutr.2006;9(5):644–650. doi:10.10 79/PHN2005912
Nutrition and Dietary Supplements
Dove
press
Publish your work in this journal
Nutrition and Dietary Supplements is an international, peer-reviewed, open access journal focusing on research into nutritional requirements in health and disease, impact on metabolism and the identification and optimal use of dietary strategies and supplements necessary for normal growth and development. The journal welcomes submitted papers covering original research, basic science,
clinical & epidemiological studies, reviews and evaluations, guide-lines, expert opinion and commentary, case reports and extended reports. The manuscript management system is completely online and includes a very quick and fair peer-review system, which is all easy to use. Visit http://www.dovepress.com/testimonials.php to read real quotes from published authors.
Submit your manuscript here:https://www.dovepress.com/nutrition-and-dietary-supplements-journal
Nutrition and Dietary Supplements downloaded from https://www.dovepress.com/ by 118.70.13.36 on 25-Aug-2020