A Novel Method Of Cyber Threat Detection Using
Feature Extraction
Soumya.T.R, S. Revathy
Abstract : Cyber threat event detection is the method that ensures safety of the public when there is occurrence of serious events. Social media is a platform used for the purpose of social wellness, utilized as an information source for the hackers. Twitter-one of the social media is a web application of micro blogging type has become popular serving several hundred million users. Detection of real world cyber threat event that threatens the social security and safety or causes interruption to the social order is made possible by the exploitation of user generated data, which is a rich source of data. In this paper, threat event is detected by the two types of feature extraction namely temporal feature and textual feature. Based on the features extracted, investigation of the cyber threat event is performed over time. Firstly, identification of the cyber threat event is done regardless of the user’s influence. Secondly, the temporal feature plays an important role in the detection of the threat event therefore cannot be ignored. Thirdly, the overall performance of the detection of cyber threat event is improved using the textual features. This approach is a novel method for the detection of the cyber threat event for the real world data from social media.
Keywords : Threat event detection, Feature extraction, Cyber threat event
—————————— ——————————
1. INTRODUCTION
In the current era, social media acts as a fast tool for news broadcasting, expressing the opinions and also for people interaction. Twitter is the popular tool allowing the users to tweet short message limited up to 140 characters which is used for discussing topics of current real-world events in various fields. Detection of such events is a crucial concept as it involves gathering of data for the management of the event. Its common tendency of the public to comment on events happening currently, which captured their attention rapidly both locally & globally such as sports, weather report, attacks by the terrorist etc. User commenting publically on social media is a serious challenge for the security and safety of the user and also interruption of social order, hence such cyber threat in social media has to be identified especially destructive threat which causes problem. Important challenge is to differentiate indefinite tweets about the daily routine monotonous activities from that of the topics that are of current interest of the public so that officials who manage and ensure public safety can do their work better. Therefore the motivation of this paper is to understand the feature of the tweets reporting on troublesome events and also it is necessary to detect the velocity of arrival of tweets.
Identifying tweets that are destructive is the major objective of the proposed method which is based on feature extraction involving both the features namely temporal features and textual features. Minimum of 400 million tweets are posted in Twitter per day, hence to reduce the overheads that occurs during computation, the threat event detecting algorithm should perform less number of operations for real time events. Experiments on feature selection can be undertaken for identifying the signal and patterns of the threat event based on their features as it provides better machine classification and accurate clustering. The two types of features that are considered in the feature selection experiment are the temporal features and the textual features.
Temporal features indicate how fast the information is diffused which highlights the tweet quality posted by the users at various times. Temporal features are the major factors that indicate the volume of tweet about a particular event. To identify the threat event, key words that are tweeted more frequently are clustered over a range of time
window. This improves the clustering efficiency of the system.
Textual features indicate the content of the text posted in the Twitter. Different textual features are analyzed for selecting the best contributor which are ranked in order to remove features that are irrelevant and cause higher computational cost. Some of such features are near- duplicate measure where high similarity occurs between two tweets, retweet ratio which indicates spreading of information to other users, Mention ratio which indicates the users that are most mentioned such as celebrities, hashtag ratio – the ratio of hashtag tweets to total tweet in a particular timeframe.
Distinguishing the threat generating data from other data and its identification is discussed in [1] with various types of destructive threats. This paper focuses on selection of optimized features for increasing the performance of the algorithm for event classification. Textual dimensions and time dimensions improves the event detection quality that is suitable for microblog data –Twitter. Temporal analysis is done in depth for the information related to the events such as public interaction, public opinion etc.
2. EXISTING METHODS
Research on detection of threat event, monitoring along with tracking has attracted many scholars. Different techniques for identifying the threat event are discussed in the survey paper [2] which indicates various methods for the detection. This paper focuses on the experiments for selection of features for the enhancing the accuracy of the detection of threat event. It includes the process of extraction of temporal & textual features and its application for task of data mining.
2.1 Methods based on temporal features
2.2 Methods based on Textual feature
Information diffusion for the challenges of data mining [8, 13], mining of opinion [9, 14], detection of spam & spammers [18] and identification of regular user [10, 11, 12, 8, 19] are discussed. The model of [7] identifies users of Twitter that are most influenced. Model based on features and tree kernel are investigated in [14] for classifying the sentiments. Cong considers the popularity of Hashtag [8] which demonstrates that the context features are efficient than the content features for the prediction of Hashtag popularity.
3. FRAMEWORK OF PROPOSED THREAT
EVENT DETECTION
An event that can be destructive can be defined by its textual and temporal features. Such events can be related to the local region or even national or international level. Identification of such events and for prompt reaction before it is spread to wide number of users is necessary. Bursty spike of data causes increase in volume of data at a particular time. The routine of ordinary event is interrupted by the threat event with discontinuity of the security. An event causing threat is characterized by the textual & temporal features. This event causing threat can be such as when a factory plans to shut down due to a fire accident then the companies related to it will be involved to protect themselves from losses. Hence continuous monitoring of social media such as twitter for the identification of anomalies allows the companies even the government to take prior actions such that such information does not create damage to the society in a wider way which acts as the motivation for identifying the destructive threats from the normal messages. But monitoring the tweets by human is not possible as the amount of tweets per day received is very high. The framework of the proposed method is shown in Fig. 1 which clearly explains the step by step process for identification of worthy events in Twitter. The process involves collection of series of data from a particular location for a predefined window of time frame. The framework consist of five steps namely collection of data, pre-processing, differentiation of events and non-events, process of online clustering, identification of destructive events with its summary
Fig.1. Framework of Event detection for Twitter
4. PROPOSED ALGORITHM:
Classification of non-events from events indicated in the above framework is done by the following algorithm which discards unwanted features thereby removes unwanted
table1. Let ‘N’ be the actual number of features with actual feature set be Q = {Fj, j= 1,.., N }. Dissimilarities between the
features Fj and Fk is represented by D(Fj, Fk), greater the
value of D, more the dissimilarities between the features. Let dij represents the dissimilarities between the feature Fj and
its nearest ith neighbor feature in the reduced subset of features S.
Table1: Notations used in the algorithm
Representation Explanation
N Actual number of features
Q = {Fj, j= 1,.., N } Actual feature set
D(Fj, Fk) Dissimilarities between the features Fj and Fk
dij Dissimilarities between the feature Fj and its nearest ith neighbor feature
Following are the steps of the algorithm:
Step 1: Initial value of ‘i’ is chosen as i ≤ N-1. The reduced feature subset S is initialized as the actual feature set Q. Step 2: Computation of dij is performed for each feature Fj ϵ
S
Step 3: Feature Fj’ is found for which dij is minimum. This
feature is retained in S and the nearest feature ‘i’ is discarded of Fj’.
Let ε = di j’
Step 4: If i >cardinality (S) -1: i = cardinality(S) – 1 Step 5: If i=1, then Jump to step 8
Step 6: While dij’ > ε, then
a) i = i-1, dij’ = inf Fj ϵ S dij
b) If i = 1, Goto step 8 End While
Step 7: Goto step 2
Step 8: Feature set S is returned as the reduced feature set
Hence features that are irrelevant for the detection of the threat event are excluded by the above algorithm and required reduced feature set is obtained. This greatly reduces the computation overload reducing the cost. Once irrelevant features are eliminated, events are clustered based on the field of the event by the clustering algorithm, therby identifying the threat events.
5. EXPERIMENTAL EVALUATION:
5.1. F-Measure
average value of 80.8 is obtained as the F-measure for the proposed work which is a considerable value indicating that the work is 80.8 % accurate.
Fig.2. F-measure values of online clustering technique
Matrix Evaluation
Efficiency of the classifiers is evaluated based on the features such as F-measure, accuracy, recall & precision. Precision indicates closeness of the measured values even though they are wrong i.e false negatives. The measure of false negative is indicated by recall. Mean of precision & recall is the F- measure. Percentage of correctly identified tweets to that of total tweets is represented by accuracy. False positive indicates identification of an event in class A when it is actually of class B. True positive indicates identification of an event in class A when it is exactly of class A only.
5.2 Temporal features
Analysis of the temporal features of the proposed algorithm based on the accuracy of the prediction of event along with its run time is done to obtain its efficiency. For different values of time windows, accuracy & run time are obtained which is shown in Fig. 3 & Fig. 4.
Fig.3. Accuracy for Various Time windows
\
Fig.4.Clustering time for Various Time windows
The above results shows that one hour time frame requires less time for clustering than for one minute time frame, while produces 2nd best accuracy, hence it is suggested that the recent tweet predict the threat event better than the older ones but not so early as 1 minute too.
5.3 Textual features
Each feature is individually investigated to obtain the discriminative power for classifying the destructive threat event to show individual feature separately such that the lowest destructive feature can be eliminated for reducing the computational load to be performed for evaluating the result. The ROC curve is shown in Fig.5 for each of the feature. These curves are obtained from the values of the result with respect to the F-measure and variation between the temporal feature and the F-measure, as temporal feature is considered as the basic concept behind this experiment.
Fig.5 ROC Curves Obtained for Individual Features
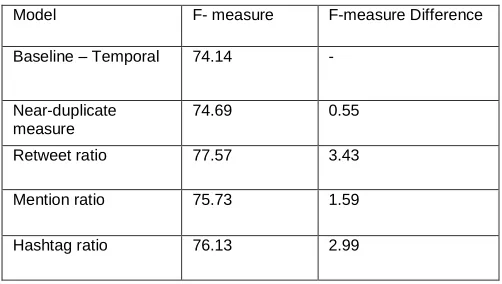
Table2. Comparison of Textual features based on F-measure
Model F- measure F-measure Difference
Baseline – Temporal 74.14 -
Near-duplicate measure
74.69 0.55
Retweet ratio 77.57 3.43
Mention ratio 75.73 1.59
Hashtag ratio 76.13 2.99
Performance of different models is compared in Fig.6 using unigram model which forms the baseline of textual features. Firstly the temporal model makes use of the setting of 1 hour. Secondly textual features are used to represent textual model, thirdly optimal features are alone are implemented for the textual model, fourth model implemented as a combination of both textual and temporal model. The final model combines the optimal features of the textual model and the temporal model.
Fig. 6 Result of Different model for Identification of
Destructive Threat using F-measure
The performance is significantly better compared to the baseline for all the models proposed whose results are demonstrated in Fig. 6. Proposed temporal model performs better than the textual model with a score of performance of 7.64% & 4.20 % better than the textual features. Optimal features leads to high value of F-measure. The variations are reliable while combining both temporal and textual features. Ultimately combination of optimal textual & temporal features leads to better performance which in turn leads to better identification of threat events.
6. CONCLUSION
This paper presented a wide analysis of different features that are related to data posted in Twitter and clearly showed
obtained from the experiments shows that the optimal textual features along with the temporal features provides better result than just textual features. The proposed method can be used in the development of a system that creates social awareness to enrich decision making in fields such as management of crisis, information intelligence bureau & police force. The future work involves inclusion of other features such as social network & spacial features and to compare the results with temporal and textual features, also validation can be done for the proposed framework with the conventional methods such as labeled Dirichlet allocation method.
REFERENCES
[1] Alsaedi, N., Burnap, P. and Rana, O. 2014. A Combined Classification-Clustering Framework for Identifying Disruptive Events. Proceedings of 7th ASE International Conference on Social Computing (SocialCom 2014), pp. 1–10.
[2] Atefeh, F. and Khreich, W. 2013. A Survey of techniques for event detection in twitter. Computational Intelligence 0(0).
[3] Frank, J.R., Kleiman-weiner, M., Roberts, D. a, Niu, F., Ce, Z., Christopher, R. and Soboroff, I. 2012. Building an Entity-Centric Stream Filtering Test Collection for TREC 2012. TREC.
[4] Ji, H. and Grishman, R. 2011. Knowledge Base Population : Successful Approaches and Challenges. Acl, pp. 1148–1158.
[5] Kanhabua, N. and Nørvåg, K. 2010. Determining time of queries for re-ranking search results. In Proc. ECDL, pp. 261–272.
[6] Radinsky, K., Agichtein, E., Gabrilovich, E. and Markovitch, S. 2011. A word at a time: computing word relatedness using temporal semantic analysis. Proceedings of the WWW’11, pp. 337–346.
[7] Georgescu, M., Pham, D.D., Kanhabua, N., Zerr, S., Siersdorfer, S. and Nejdl, W. 2013. Temporal Summarization of Event-related Updates in Wikipedia. WWW Companion, pp. 281–284.
[8] Ma, Z., Sun, A. and Cong, G. 2013. On predicting the popularity of newly emerging hashtags in twitter. Journal of the American Society for Information Science and Technology 64(7), pp.1399-1410.
[9] Thelwall, M., Buckley, K. and Paltoglou, G. 2011. Sentiment in Twitter events. Journal of the American Society for Information Science and Technology 62(2), pp. 406–418.
[10] Backstrom, L., Kleinberg, J., Lee, L. and Danescu-niculescu-mizil, C. 2013. Characterizing and Curating Conversation Threads : Wsdm, pp. 13–22.
[11] Hecht, B., Hong, L., Suh, B. and Chi, E. 2011. Tweets from Justin Bieber’s heart: the dynamics of the location field in user profiles. Proceedings of the SIGCHI Conference on Human Factors in Computing Systems (CHI ’11), pp. 237–246.
[12] Cha, M., Haddadi, H., Benevenuto, F. and Gummadi, P. 2010. Measuring User Influence in Twitter: The Million Follower Fallacy. ICWSM.
data. Proceedings of the ACL 2011 Workshop on Languages in Social Media, pp. 30–38.
[15] James, A. 2002. Introduction to topic detection and tracking. In Topic detection and tracking: event-based information organization, pp. 1–16.
[16] Gabrilovich, E., Dumais, S. and Horvitz, E. 2004. Newsjunkie: providing personalized newsfeeds via analysis of information novelty. WWW ’13, pp. 482– 490. WWW ’14.
[17] Elsas, J.L. and Dumais, S.T. 2010. Leveraging temporal dynamics of document content in relevance ranking. WSDM ’10.
[18] Lee, K., Caverlee, J. and Webb, S. 2010. Uncovering social spammers: social honeypots+ machine learning. SIGIR ’33.
[19] Petrovic, S., Osborne, M. and Lavrenko, V. 2011. RT to Win! Predicting Message Propagation in Twitter. ICWSM.
[20] Dou, W., Wang, X., Skau, D., Ribarsky, W. and Zhou, M.X. 2012. LeadLine: Interactive visual analysis of text data through event identification. (VAST 2012), pp. 93– 102.
[21] Becker, H., Naaman, M. and Gravano, L. 2011. Beyond Trending Topics: Real- Event Identification on Twitter. ICWSM, pp. 1–17.
[22] Burnap, P., Williams, M.L., Sloan, L., Rana, O., Housley, W., Edwards, A., Knight, V., Procter, R. and Voss, A. 2014. Tweeting the terror: modelling the social media reaction to the Woolwich terrorist attack. Social Network Analysis and Mining 4, p. 206.
[25] Mitra, P., Murthy, C. a and Pal, S.K. 2002. Unsupervised Feature Selection Using Feature Similarity. IEEE Transactions on Pattern Analysis and Machine Intelligence PAMI 24(3), pp. 301–312.
[26] Takahashi, T. and Igata, N. 2012. Rumor detection on twitter. SCIS ‘6 and ISIS ‘13, pp. 452–457.
[27] Tsur, O. and Rappoport, A. 2012. What ’ s in a Hashtag ? Content based Prediction of the Spread of Ideas in Microblogging Communities. WSDM’12. pp. 16–23. [28] Fawcett, T. 2006. An introduction to ROC analysis.
Pattern Recognition Letters 27(8), pp. 861–874. [29] Sarma, T.H., Viswanath, P. and Reddy, B.E. 2013.
Single pass kernel k -means clustering method. 38(June), pp. 407–419.