Driver distraction by advertising: genuine risk or urban myth?
B. Wallace
Drivers operate in an increasingly complex visual envir-onment, and yet there has been little recent research on the effects this might have on driving ability and accident rates. This paper is based on research carried out for the Scottish Executive’s Central Research Unit on the subject of external-to-vehicle driver distraction. A literature review/meta-analysis was carried out with a view to answering the following questions: is there a serious risk to safe driving caused by features in the external environ-ment, and if there is, what can be done about it? Review of the existing literature suggests that, although the subject is under-researched, there is evidence that in some cases overcomplex visual fields can distract drivers and that it is unlikely that existing guidelines and legislation ade-quately regulate this. Theoretical explanations for the phenomenon are offered and areas for future research highlighted.
1. INTRODUCTION
As we enter the twenty-first century, the driving task is more complex than ever before. Not only are there far more potential distractions available within the car (e.g. mobile phones, radio, cassette players, CD players, GPS devices) but theexternal
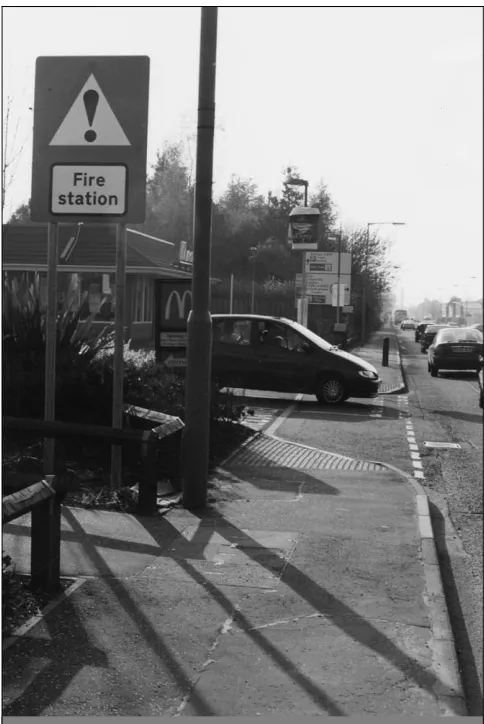
environment has also become far more complex. There are more cars on the road. Moreover, the visual environment is also more complex, with a proliferation of signs, billboards, adverts, shop fronts, and even ‘public art installations’ (see Fig. 1). Given this situation, it is important to ask the questions: does the increasingly complex visual environment raise the risk of driver distraction, and if so, what specific aspects of it are most
likely to be distracting? Contemporary advertisements, for example, are increasingly eye-catching, provocative and ‘explicit’. Does this have an effect on driving capability, and if so, what can we do about it?
2. THE EVIDENCE: ‘REAL WORLD’ STUDIES
External-to-vehicle driver distraction first became an important issue in the United States following the Second World War. The new postwar prosperity (leading to a vast increase in car ownership and an expansion of the road system), coupled with the increased prevalence of neon signs and flashing billboards, led to concerns that drivers would become increasingly unable to concentrate on the driving task.
2.1. Michigan study
The first serious research on this subject was the Michigan study, carried out in the early 1950s by McMonagle.1In this study, McMonagle selected a 70-mile stretch of rural road and catalogued all visible road and roadside features. For statistical purposes the road was then divided into 1000 ft sections with a marker planted by the side of the road to mark the section breaks. For three years local police logged the distance between any accident and one of these markers. McMonagle classified all the accidents in his database in terms of their distance from one of the markers. This was correlated to the number of accidents in a 1000 ft section and the number of various roadside features in that section.
He discovered that road sections which contained intersections seemed to have more accidents than those that did not, so for the purposes of analysis he divided the road into sections which contained intersections and sections that did not.
The conclusion of McMonagle’s study has been supported by almost every subsequent study: accidents are correlated with
road complexity.Straight roads where traffic can flow easily are safer than congested roads with many intersections, taverns, and gas stations. Intersections in particular seemed to be associated with higher accident rates, especially when there were advertising signs close by. McMonagle failed to discover a correlation between advertising signs on their own and accident rates, but the cross-correlations with intersections was suf-ficient to provoke more research.
2.2. Minnesota rural trunk highway
The next major study was carried out on 510 miles of highway Proceedings of the Institution of
Civil Engineers Municipal Engineer 156 September 2003 Issue ME3 Pages 185^190
Paper 13389 Received 02/06/2003 Accepted 24/09/2003
Keywords:
safety & hazards/roads & highways/
Brendan Wallace Research Fellow, Centre for Applied Social Psychology, Glasgow
in Minnesota by Staffeld, again in the early 1950s.2Again the road was divided into sections, and every offroad object (including advertising signs) was noted and stored in a database. Accident rates for sections with advertising billboards were compared with those without billboards, and this time a significant correlation was discovered,especiallyat intersec-tions. Another interesting fact was that (non-advertising-related) accident rates which occurred at bends were higher when the curves were preceded by a long stretch of road than by a short stretch of road.
Aside from this, the Minnesota study’s main findings bore out the findings of the Michigan study above: roads which tended to be have high-speed traffic, low to medium traffic volume, low complexity (i.e. few intersections) and few advertising signs tended to have fewer accidents than roads which did not.
2.3. Iowa study
Another study undertaken at the same time was the Iowa study of 1951, undertaken by Rusch.3This time, the whole state of Iowa was used (instead of just individual highways). It was divided into four geographical sections and these were classed according to the amount of advertising and number of billboards they contained. It was discovered that Area A (where 90% of the advertisements were located) had the highest accident rate. Rusch therefore concluded that there were was a positive correlation between accident rates and advertising billboards.
Of all these studies, Rusch’s is the most problematic. First, it is not clear from his written report how the areas were classified into ‘high advertising level’ and ‘low advertising level’. Second, and more important (because we know from earlier studies that the more businesses and shops beside a road the higher the accident rate), the presence of shops does not seem to have been controlled for. In other words, he found that shops and advertising seem to correlate with high accident rates, but made no effort to separate out these variables. Is it shops that are the most important variable in terms of predicting accidents? Or billboards? Or both together?
2.4. Problems with these studies
Of course critics were not slow to point out the main flaw with all these studies: they were only correlational studies. As every statistician knows,correlation does not imply causation, for the obvious reason that there may be an unknown causal factor, which is causing the variable being studied. For example, in the summer, when the weather is hot, people are more inclined to wear T-shirts. Also, because of pollen counts, more people are likely to suffer from hayfever. Therefore, if a graph is drawn with ‘percentage of population wearing T-shirts’ and ‘percen-tage of population suffering from hayfever’ there will be a correlation. However, it should not therefore be concluded that wearing a T-shirt causes hayfever, as there is a ‘hidden causal factor’ (in this case, pollen counts).
None of these studiesprovethat advertising causes accidents. For example, we know that roads with shops tend to have higher accident rates than roads without shops. Not only do the shops provide distraction, but people stop and buy things, and it is the pulling out from the kerb, parking, the ‘stop–start’ of busy city driving that is most strongly associated with
accidents. This problem with the analysis is particularly acute in the Iowa study (for reasons given above) but should be borne in mind with all the studies.
Another problem is the influence of traffic flow on accident rates. It’s fairly apparent that the more traffic there is on a road, the more accidents there will be (although the relationship is not linear). Unfortunately, studies carried out in the 1960s still tended to be of a correlational nature. It was not until Ady’s study in 19674(see section 2.8) that a different methodology was tried.
2.5. Madigan^Hyland
The firm Madigan–Hyland carried out one of the more controversial studies on driver distraction in 1961. Two years’ worth of data on accidents, which took place on 1118 miles of the New York State Thruway, were collated and analysed. Again, the Thruway accident data were analysed, with accidents being divided up into two main categories: accidents where drivers could have seen an advertisement and accidents where they could not have done. Only accidents specifically classified by the state trooper as ‘driver inattention’ were included in the analysis (25% of all accidents in the database). Although 13·1% of the highway had a high proportion of visible advertising, 32·6% of the 1550 accidents attributed to driver inattention occurred in that percentage of its length. Annually, 1·7 accidents occurred per mile in the ‘high advertising’ areas, whereas only 0·5 accidents occurred per mile in the ‘low advertising’ areas.
Traffic volume was controlled for by classifying the highway into three areas: ‘high’, ‘medium’ and ‘low’ traffic flow. In all three categories accidents were higher in sections of the highway with a high number of advertising billboards.5
2.6. Problems with Madigan^Hyland
Considering its somewhat ‘rough and ready’ methodology, perhaps it is not surprising that this was one of the most controversial of all driver distraction studies. In fact one critic of the study ended up describing their approach as ‘erroneous’ and ‘immature’!6On the other hand, the study must be viewed in the context of the other studies above. Moreover, data from accidents at intersections were omitted (despite the fact that the other studies showed these were the most likely areas to have advertising-related accidents) on the grounds that there were too many other potential causal factors that would function as confounders. So while this study is hardly definitive, it is another piece of evidence that advertising does have an effect on accident rates.
2.7. New Jersey Garden State Parkway
accident rates and the number of billboards, either by correlations of the ‘billboard’ sections of the road, or else by correlations of individual billboards with accidents.
Unsurprisingly, Blanche’s study was criticised.8However, the key point is that the Garden State Parkway is a multi-lane motorway, with few if any intersections. Since the studies above found that intersections were particularly likely to be associated with advertising-related accidents, it seems unsur-prising that no correlations were found. The effect of billboards on accidents is, it seems, situation-specific; that is, the effect will be specific to the juxtaposition of features at any particular location.
2.8. The Ady study
The key problem with all of the above studies, to reiterate, is that they are all correlational. One of the few exceptions was carried out by Ronald Ady in 1967.4This was a ‘before and after’ study, in which nine advertising signs were selected for their potential for distraction (that is, they were large, illuminated, and information-rich (i.e. containing some com-plex message). Accident rates were collated for the year before and after the signs were erected; however, as Ady classified the data by month, he discovered that only three of the signs had adequate police accident data for the study. An equivalent area of road on the same highway was used as a control.
Ady discovered that two signs showed no effect (in terms of raised accident rates after the sign was erected). One sign, however,didshow an effect at the 5% significance level. Ady pointed out that the distracting sign was positioned at the corner of a sharp bend, and that it was the most conspicuous sign (it was lit by bright white lights, later removed at the insistence of the police, worried by the rising accident rate).
Ady concluded that whereas it was not necessarily the case that all advertising billboards caused accidents, it was possible that some signs in some situations might cause accidents. After all, some signs are large, some are small, some are brightly lit, some are not: it would be counter-intuitive if all signs had the same impact on accident rates. Moreover, it also seems likely that thecontentof the sign plays a part in how ‘distracting’ it may be.
2.9. The Austin, Texas study
Finally, Holohan carried out a number of studies in the mid-1970s in Austin, Texas.9Sixty intersections of roughly the same size that had had at least one accident over the previous year were selected. Observers were sent into the field and told to categorise every sign visible from the approach to the intersection. Then (after traffic volume had been controlled for) correlations were calculated between accident rates and sites with a large number of signs in the immediate vicinity. Holohan discovered that there was a correlation, and that the larger the sign, the larger the effect.
2.10. Conclusion
The main conclusion to be drawn from these studies is that there seems to be a correlation between accident rates and advertising billboardsat intersections or junctions.The only study that showed no effect (Blanche7) was on a road that contained few or no intersections (a motorway). The other
conclusion (from the Ady study4) is that there is a possible link between accident rates and signs after long stretches of road, on sharp bends. The key point is that even if all these studies had shown perfect correlations, this would not prove causation. Experiments are the best way to prove causation. And so it is at experiments on driver distraction that we should next look.
3. THE EVIDENCE: EXPERIMENTS
The two major experiments that have tested the driver distraction hypothesis were carried out in Australia. Whereas with the ‘correlational’ studies the main problem was ‘correla-tion does not imply causality’, with experimental studies the key problem is ‘ecological validity’: that is, the degree to which these experiments reflect real driver behaviour. Given that these experiments took place in the mid-1970s (when computer technology was a lot less sophisticated than it is now), this is what physicists term a ‘non-trivial’ problem.
3.1. Johnston and Cole
Subjects were given a joystick and told to watch photographs which flashed up on a screen. At various intervals, arrows appeared pointing right or left. The task was for subjects to move the joystick in the direction of the arrow, while being ‘distracted’ by various adverts that were flashed on the screen at the same time. Small spots of light also appeared at random, in response to which subjects were to press a button. Johnston and Cole discovered that performance in both these tasks decreased (in terms of time to response) as more adverts appeared to distract them. The effect was small, but on the other hand, the experiment only used average scores: it is possible that some adverts were a lot more distracted than others.10
3.2. Holohan
As a companion study to his field study (discussed above), Holohan, together with colleagues, also carried out lab experi-ments in the late 1970s. Subjects faced a screen on which slides showed various combinations of advertisements. Occasionally a red stop sign would appear. When it did so, subjects had to press the ‘target present’ button: when it was missing subjects had to press the ‘target missing’ button. Holohanet al. discovered that response time slowed as more and more adverts appeared on the slides. The key factor seemed to be proximity: the closer the advertisements were to the stop sign, the longer it took for the subjects to press the ‘target present’ button. Colour and number of advertisements also had an effect.11
presence of signs/billboards,particularly at junctions or inter-sections.
The one major exception to this is the Ady study,4which showed an effect caused by an isolated sign on a bend after a long stretch of road. The one study that did not seem to include many (or any) intersections and which had a high volume of traffic and few if any bends (Blanche7) showednoeffect on accident rates. The question is: are there psychological theories that can help us make sense of these findings?
5. THEORY
Theories of distraction derive from psychological theories of
attention. There are a number of theories of attention, but most of them derive from Hebb’s theory of arousal. Hebb argued that there was a relationship between arousal (a psychological term meaning roughly to be excited or interested), and ‘cue function’ or ability to perform activities.12Human beings seek a balance between being under-aroused (bored) and over-aroused (stressed) for the ‘optimal level of response and learning’ (Fig. 2). It was the Canadian psychologist D. E. Berlyne who noted that
information can alter arousal: that is, when human beings are bored they seek out information (go to see a movie, read a book, watch TV) to raise their arousal level. On the other hand, when they are ‘stressed’ (over-aroused) they will attempt to remove the information with which that they cannot deal. In other words, the brain functions as a thermostat or control mechanism, attempting to self-regulate by modulating arousal.
Berlyne also noted what Pavlov had discovered at the turn of the twentieth century about the orientation reaction (OR), an involuntary response to new stimuli. He carried out numerous experiments to show that the OR was related to this search for arousal: the less aroused (the more bored) subjects were, the more likely they were to be distracted by the OR.13
It should also be noted that current research has identified two main modes of visual perception. ‘Focal’ vision is what one might term ‘search mode’. This is ‘narrow focus’, and specific. ‘Ambient’ vision, on the other hand, is the ‘default’ state, when the driver is not looking at anything in particular. Attention is
‘broad’, and the driver is more likely to notice objects at the periphery of the visual field. It can be argued that ‘focal’ vision is more likely to be associated with high arousal, and ‘ambient’ vision with low arousal.14
5.1. Contemporary experiments on distraction
Most of the important psychological theory on attention is well established. Nevertheless, work done in the last ten years on the specific questions of perception and attention have helped to fill in much of the gaps in our knowledge and made the whole subject far more rigorous. So for example, Mack and Rock carried out experiments in which subjects performed a visual search task in the centre of the computer screen, while distracters appeared on the edges of the screen.15Unless they were told that the distracters had appeared, subjects had no recollection of having seen them. Understandably, Mack and Rock inferred from this that if subjects were in ‘focal’ or ‘search mode’ (that is, paying attention with high levels of arousal) then it was impossible to distract them with visual stimuli. However, Theeuwes carried out the same experiments but this time measuredresponse timesas well as gathering verbal reports. He discovered that even if subjects did not state that they had seen the distracter, their response time to the task was slowed when the distracter appeared. Subjects were distracted unconsciously, and, therefore, automatically.16
It seems, therefore, that distraction is possible even when subjects ‘do not want’ to be distracted. And this of course bears out Pavlov’s point: the orientation reaction to unexpected stimuli can overwhelm our attempts to suppress it.
Another finding relevant here (again dealing with visual search strategies) is that if the subject is searching for something specific (that is, they know where and what it is), the distraction effect is likely to be small and of short duration. However, if they do not know what they are looking for (or if the searched-for object is not there at all), distraction effects can be much more serious. This is strengthened further by the number and kind of distracters: the more visual ‘clutter’ there is, the more likely subjects are to be distracted and fail to notice important safety signs17(see Figs 3 and 4 for examples of this).
6. DISCUSSION OF THEORY
These theories provide the basis for a theoretical framework to discuss the results of the field studies and Johnston and Cole’s10 and Holohan’s experiments.11Theory predicts that drivers can be distracted from their driving task at any point. However, this is most likely to occur in a situation where they are searching for something (especially if they do now know what they are searching for) and there is a great deal of ‘clutter’ in their field of view. This was borne out in the Johnston and Cole10and the Holohan11experiments. In both of these it was found that the subject’s task efficiencies were reduced when they were distracted by high numbers of advertisements while searching the visual field for, for example, an arrow or a stop sign. And the field studies showed that the highest correlations between accident rates and advertisements occurred at junctions. But it is at junctions and intersections that drivers are most likely to be engaging in visual search (i.e. focal mode): looking for signs telling them if/when they should turn off (or whether they are allowed to), traffic signals, stop signs, keep left /right signs, and so on.
Performance arousal High
Low
Low (distress)
Optimum (eustress)
High (distress)
Boredom from understimulation
Optimum stress load
Conditions perceived as
stressful
Distress from overstimulation
This leaves the Ady study,4with its discovery of the sign that seemed to cause accidents on the bend. The immediate context of this was a stretch of road where drivers were simply ‘driving’ normally: in other words, they were in ambient visual mode, in conditions of low arousal. It should be noted that there is much evidence for the existence of ‘highway hypnosis’, where drivers ‘fall asleep with their eyes open’, and either drift off the road, or fail to notice when the car ahead puts on its brake lights and stops. What seems to happen (to use the Hebbsian framework) is that in conditions of extremely low information, and therefore arousal, drivers ‘go into a trance’ thereby increasing the possibility of an accident.
Moreover, it seems that drivers can become ‘absorbed’ in simple stimuli. In conditions of low information, they can become as if ‘transfixed’ by the lights of the car ahead, the flashing blue light of a police car parked by the side of the road, or, possibly, an advertisement (Fig. 5). This is known as ‘phototaxis’ or ‘the fascination phenomenon’.18
It is possible that something like this happened in the Ady study. After a long, monotonous stretch of road, the driver became ‘absorbed’ in the advertisement (which, being large and bright, had been visible for some time), and simply failed to notice the sharpness of the bend, leading to an accident.
7. CONCLUSION
Many cities and states already have statutes regulating roadside advertising. However, to quote Holohan
‘Most cities have ordinances regulating the extent to which advertis-ing can distract a driver’s attention, yet they are often couched in ambiguous terminology, and are based on policy makers’ hunches rather than on actual safety evidence’.
The reader can hardly have failed to notice that most of the studies on driver distraction took place over 20 years ago. However, what is surprising is that, coupled with more up-to-date research on vision, it is possible to draw some conclusions on the effect of driver distraction and billboards/signs.
Fig. 3. Junction cluttered by signs and advertising
Fig. 4. Turn-off cluttered by signs
(a) The effect is real. However, it is situation-specific. Many billboards and signs may have no measurable impact on road safety, but there is overwhelming evidence that, at least in some situations, signs and billboards can be a threat to road safety.
(b) Almost all studies agree that too much ‘visual clutter’ at or near intersections and junctions can interfere with drivers’ visual search strategies and lead to accidents.
(c) It is probable (although it has not yet been proven), that drivers can be distracted by ‘phototaxis’: isolated, illumi-nated signs and billboards by the side of the road in an information-poor (‘boring’) driving environment. More research is urgently needed to discover the real risk of this phenomenon.
(d) Despite the risks to drivers the whole subject is under-researched. But both technology and theory have moved on since the 1970s. Virtual reality technology has pro-gressed to the point that convincing representations of the driving experience are far easier to create, thus dealing with the charge of lack of ‘ecological validity’. Moreover, there now exists a large body of research on visual processing that helps to create a new framework for visual perception. It is vitally important that new research is undertaken to integrate the theory and practice, and broaden the field such that other variables (type of car, personality of driver, type of road, light conditions) can be taken into account in terms of creating a predictive model of driver distraction.
REFERENCES
1. MCCMONAGLEONAGLEA. Traffic accidents and roadside features.
Highway Research Board Bulletin, 1952,55, 38–48. 2. STAFFELDTAFFELDP. Accidents related to access points and
adver-tising signs in study.Traffic Quarterly, 1953,7, No. 11, 59–
74.
3. RUSCHUSCHW. Highway accident rates as related to roadside business and advertising.Highway Research Board Bulle-tin,30, 46–50, 1951.
4. ADYDYR. An investigation of the relationship between illuminated advertising signs and expressway accidents.
Traffic Safety Research Review, 1967,3, 9–11.
5. NEUBURGEREUBURGER??. Billboards and the high accident rate.
Congressional Record (Senate), March 25 1963,109, 4839–
4840.
6. CHAMPIONHAMPIONC. Illuminated advertising signs, their effect on traffic and the environment.IES Lighting Review, 1971,10, 131–135.
7. BLANCHELANCHEJ. The roadside distraction. Traffic Safety,10, 24–
37.
8. WACHTELACHTELJ. and NETHERTONETHERTONR.Safety and Environmental Design Considerations in the Use of Commercial Electronic Variable-message Signage. Federal Highway Administra-tion, Washington, DC, 1980, FHWA-RD-80-051. 9. HOLOHANOLOHANC. Psychological Analysis of Degree of Safety in
Traffic Environment Design.Council for Advanced Trans-portation Studies, Texas, 1979.
10. JOHNSTONOHNSTONA. and COLEOLEB. Investigations of Distraction by Irrelevant Information.Australian Road Research, 1976,6, No. 3, 3–22.
11. HOLOHANOLOHANC., CULLERULLERR. and WILCOXILCOXB. Effects of visual distraction on reaction time in a simulated traffic environ-ment.Human Factors, 1978,20, No. 4, 409–413.
12. HEBBEBBD. Drives and the C.N.S. (central nervous system).
Psychological Review, 1955,16, 143–154.
13. BERLYNEERLYNED. E.Conflict, Arousal and Curiosity, McGraw-Hill, New York, 1960.
14. ANDRENDREJ., OWENSWENSD. and HARVEYARVEYL.Visual Perception: The
Influence of H.W. Liebowitz. American Psychological Association, Washington DC, 2003.
15. MACKACKA. and ROCKOCKI.Inattentional Blindness. MIT Press, London, 1998.
16. THEEUWESHEEUWESJ. and GODJINODJINR. Attention and oculomotor capture. InAttraction, Distraction and Action: Multiple Perspectives on Attention capture(FOLKOLKC. and GIBSONIBSONB. (eds)). Elsevier, Amsterdam, 2001, pp. 121–150.
17. HUGHESUGHESP. and COLEOLEB. Search and attention conspicuity of road traffic control devicesAustralian Road Research Board,14, No. 1, 1–9.
18. CHARLESHARLESM. CRANKRANKJ. and FALCONEALCONED.A Search for Evidence of the Fascination Phenomenon in Roadside Accidents.
AAA Foundation for Traffic Safety, Washington DC, 1990.