Design of Frequency Tracking Loop for
Satellite-Based AIS
Shexiang Ma
Key Laboratory of Computer Vision and System, Ministry of Education, Tianjin Key Laboratory of Intelligence Coputing and Novel Software Technology, Tianjin University of Technology, Tianjin 300384, China
Email: [email protected]
Yaping Feng
Key Laboratory of Computer Vision and System, Ministry of Education, Tianjin Key Laboratory of Intelligence Coputing and Novel Software Technology, Tianjin University of Technology, Tianjin 300384, China
Email: [email protected]
Abstract—Due to a wide range of Doppler frequency shift and low SNR existing in the AIS transmission, it is difficult to decode correctly in Satellite-based AIS receiver. In order to solve the problem, a new design of PLL is proposed based on the theory of conventional PLL. The new design is aided by ML estimating. In the algorithm, frequency offsets are reduced to the fast capture zone after compensations to received AIS signals and then the phase locked loop start to track surplus frequency offsets. The simulation results indicate that the algorithm requiring the symbol number of fast capture is less than 256(the number of AIS frame symbols) when the SNR is 1dB and tracking precision is within 2 Hz. And it can be used under conditions of low SNR with large frequency offsets.
Index Terms—Satellite-based AIS; Doppler frequency shifts; low SNR; phase locked loop
I. INTRODUCTION
Satellite-based Automatic Identification System (AIS) receives terminal signals through the satellite and feedbacks the information to monitoring centers of the shore to achieve the purpose of monitoring ships in the large range. However, influenced by the distance and electromagnetic interference, electromagnetic wave decay is larger and the Signal Noise Ratio (SNR) of the received AIS signal is low on the one hand, while on the other hand, great range of Doppler frequency shifts caused by the satellite motion has a significant impact on the AIS signals whose bandwidth are only a few thousand hertz (Hz). Because of that Doppler frequency shift of large range can easily lead to error decoding of the received signals in very low SNR, so frequency offsets must be compensated before decoding.
AIS signals are modulated by GMSK and the wireless channel can be approximated to Gauss white noise
(AWGN) channel from berths to the satellite. For frequency offsets estimation, there are many estimation methods[1-4] such as blind estimation[1], data aided estimation[2] and so on. The research of blind estimation is less because its obvious SNR threshold and estimation precision is low under the low SNR environment. The common algorithms are Kay algorithm and Kim algorithm [5]. As to data aided estimation, there are a lot of researches. In 1985, Steven A.Tretter proposed a approximate estimate algorithm [6] to change the frequency offsets estimation problem into frequency offsets estimation based on complex sequences phase, however it has the SNR threshold and it can only be applied to the high SNR conditions. In 1989, Kay raised a difference phase estimation method [7] on the basis of Steven A.Tretter, but the estimation accuracy is strongly influenced by noise and the algorithm is no longer applicable under the condition of low SNR with phase hopping. In 1995, M.Lulse and R.Reggiannini present a L&R algorithm [8] whose mean square error is close to Cramer Rao Bound (CRB) on Maximum Likelihood (ML) estimation basis, but its estimation range is limited. In 2007, Hua Fu put forward the ML algorithm [9-10] which joint amplitude and phase information. Because this algorithm can not only get the frequency estimated value, but also obtain the phase estimated value, it is the ideal algorithm and mean square error of frequency offset estimation is closed to CRB. However, fewer pilot symbols will lead to the estimation accuracy declining. When the Phase Locked Loop (PLL) is used for phase tracking process, large Doppler frequency shifts will reduce the capture speed and phase locked loop can not be finished capturing within a limited time. With the frequency lock loop[11] help, phase locked loop has a faster capture speed, but it is not suitable in the low SNR because the frequency discriminator requires that input SNR cannot be less than 7dB.
In order to solve the above problems, characteristic sequences (training sequences, start flag and end flag) in AIS frame are viewed as a pilot in this paper. The preliminary estimation of Doppler frequency offsets is Manuscript received November 10, 2013; revised April 10, 2014;
completed through ML algorithm and phase is tracked by the PLL. This method can satisfy the requirements of tracking precision and capture time in the low SNR circumstance simultaneously.
II. ANALYSIS OF PHASE LOCKED LOOP PARAMETERS In engineering applications, the PLL is almost working on time synchronization state and loop designs meet the requirement of tracking precision, however, the noise and interference will increase the loop capture difficulties, reduce the tracking performance and make the loop output phase produce random jitter. In the following, we start to analyze the influence of noise on the circuit performance.
i
θ Ud
o
θ
m
Δ
u
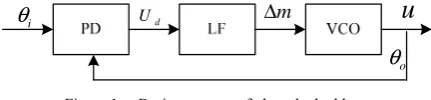
Figure 1. Basic structure of phase locked loop
PLL which is composed by phase discriminator (PD), a loop filter (LF) and a voltage controlled oscillator (VCO) is a negative feedback control system and its principle is shown in Fig.1 where LF is a active proportional integral filter and its parameters[12] are as follows
The transfer function of LF is
( )
21 1 s F s s τ τ +
= (1) The system transfer function is
( )
(
2)
22 2 2
1 2 1 2 2 n n n n
K s w s w
H s
s sK K s w s w
τ ξ
τ τ ξ
+ +
= =
+ + + + (2)
where, K is the loop gain, wn is the loop natural frequency,ξ is the loop damping coefficient and it meets the optimal value based on Wiener theory [13]. They are related to circuit parameters τ1and τ2
1
n
w = K τ
(3)
(
2 2)
K 1ξ = τ τ (4)
The digital domain transfer function 1 1
1−z− corresponds to analog integrator transfer function 1
swith the impulse invariance. Taking into account that feedback operational results will be produced at least one symbol time delay when the digital loop hardware is implemented, the system transfer function of the NCO is 11
1 z
z
−
−
− . The digital phase-locked loop structure is as shown in Fig.2.
o θ i θ d K 2
1 1 1
C C z− + − 1 1 1o K z z − − − e θ
Figure 2. Digital phase-locked loop structureThe mathematical expression of digital loop is
( )
0(
(
1)
2)
1(
0 1 2)
1 2
0 1 2 0 1
1+ 2 1
d d
d d
K K c c z K K c z H z
K K c c z K K c z
− − − − + − = + − + − ⎡ ⎤
⎣ ⎦ (5)
Whenw Tn b >1, parameter sets of the impulse response is easy to shock while the bilinear transformation can still work stably. Therefore, bilinear transformation is used to achieve conversion from analog phase locked loop
domain to the digital domain. When
(
)
(
)
1 1 2 1 1 b T z s z − − − = + ,
the result of equation (2) is
( )
(
2 22) (
2 2222 1)
(
1 2(
2)
22 2)
24 2 4
4 4 + 2 8 4 4
n b n b n b n b n b
n b n b n b n b n b
w T w T w T z w T w T z H z
w T w T w T z w T w T z
ξ ξ ξ ξ − − − − + + + − = + + − + − + (6) Considering the result of (7) is approximately equal to (8), the loop filter parameters are:
1 2 2
8 1
4 4
n b
o d n b n b
w T C
K K w T w T
ξ ξ =
+ + (7)
2 2
2 2 2
4 1
4 4
n b
o d n b n b
w T C
K K ξw T w T =
+ + (8)
where, Kd is the phase detector gain, Ko is the
numerically controlled oscillator gain, , Tb is the symbol
period,
Phase locked loop for noise suppression ability can be reflected by loop SNR and the definition is
i
L i L
B
S S
N N B
⎛ ⎞ ⎛ ⎞
=
⎜ ⎟ ⎜ ⎟
⎝ ⎠ ⎝ ⎠ (9)
in (3),
(
S N/)
iis the input SNR,(
/)
LS N is loop SNR,
i
B is the bandwidth of input signals, BLis the bandwidth of loop noise.
The bandwidth of loop noiseBLrelates to the loop
damping coefficient ξ and the natural frequency wn
2 (1 4 )
8 n L w B ξ ξ +
= (10)
For a given target, the corresponding loop SNR can be calculated and the upper limit of loop natural frequency can be inferred in the low SNR from (9) and (10):
1 2 8 1 4 n i L i S S w B N N ξ ξ − ⎛ ⎞ ⎛ ⎞
≤ + ⎜ ⎟ ⎜⎝ ⎠ ⎝ ⎟⎠ (11)
In order to make PLL work stably, loop SNR
(
S N/)
Lmust be more than 13dB from reference [13]. Fast capture zone [12] of the ideal two order loop is
2
L n
w ξw
Δ = (12)
When input frequency offsets Δwogreater than fast
capture zoneΔwL,the loop proceeds to capture frequency
first and then capture phase, that is to say, the loop reduces frequency offsets to fast capture zones through cycle-skipping and then captures phase quickly. The loop capturing time [14] is
2 2 3
p o n
Ⅲ. DESIGN OF ML AIDED PHASE LOCKED LOOP FOR GMSK
A. Matched Filter for GMSK Signals
Composed of AIS frame structure, binary message sequences are encoded by NRZI and are modulated by GMSK. After that the corresponding complex envelope signal [15] can be expressed as
( )
j ( )ts t =eΨ (14)
where,
( )
2 i(
b)
i
t πε a q t iT
Ψ =
∑
−( )
t( )
q t g τ τd
−∞
=
∫
( )
21 2ln 2 211 2 1
2 ln 2 2
b b
b b
B L
g t Q t T
T
B L
Q t T
T
π
π
⎧ ⎡ ⎛ + ⎞⎤⎫
= ⎨ ⎢ ⎜⎝ − ⎟⎠⎥⎬
⎣ ⎦
⎩ ⎭
⎧ ⎡ ⎛ − ⎞⎤⎫
− ⎨ ⎢ ⎜⎝ + ⎟⎠⎥⎬
⎣ ⎦
⎩ ⎭
( )
1 2/22 t
Q t eτ dτ
π
∞ −
=
∫
( )
tΨ is the information-bearing phase, Tbis the symbol
period,
a
{ }
a
i are the data symbols 1 or -1 in this case,and ε determines the rate of change in the symbol interval and its value is 0.5 for GMSK, g t
( )
is the frequency response which is equal to the response of a rectangular pulse with unit amplitude, q t( )
is phase response, L is an integer number called correlation length and indicates the symbol duration of the phase transition (ISI).GMSK (continuous phase modulation) signals whose correlation length isL can be divided into2L−1digital PAM signals with Laurent algorithm and its mathematical expression [16-17] is as follows
( )
1 ,(
)
0
Q
k n k b
k n
s t b c t nT
−
=
=
∑∑
− (15)However, when GMSK signals are decomposed, most of the energy is concentrated in the main pulse c t0
( )
, thus, ignoring other pulse ck( )
t1
1 L 1
k= …2 − − , its expression is
( )
0,n 0(
b)
n
s t ≈
∑
b c t−nT (16)where,
0
0,
n m m
j a
n
b e
πε =
⎧ ⎫
⎪ ⎪
⎨ ⎬
⎪ ⎪
⎩ ∑ ⎭
=
( )
1(
)
0
0
L
b i
c t λ t iT
−
=
=
∏
+For AIS,BTb=0.4,L=3is considered.
AIS signals received by the satellite are with low SNR. In order to filter out noise, improve SNR and obtain large gains to the greatest degree, signal frequency offset estimation process need to go through the matched filter. The principle of matched filter is introduced in the following.
Matched filter which filter characteristics are consistent with signal characteristics is a linear filter. The ratio of filter output between signal power and the noise average power is the maximum and the transfer function is equal to signal spectrum conjugate. Based on matched filter features and GMSK signal characteristics, only
( )
0c t is taken as a matched filter impulse response for GMSK signals, c t0
( )
waveforms is shown as follows.Time (t Tb)
0 0.5 1 1.5 2 2.5 3 3.5 4 0
0.1 0.2 0.3 0.4 0.5 0.6 0.7 0.8 0.9 1
Figure 3. Matched filter impulse response
/
I Q
sgn( )I
sgn( )Q I
Q sgn
d
U
( )
r n
( )
j n
e−θ
1
C
2
C
( )
1 r n
( )
K n( )
m n
Δ
( )
u n NCOML ( )
0
ˆ ˆ 2 d b j f nT
e− π +ϕ
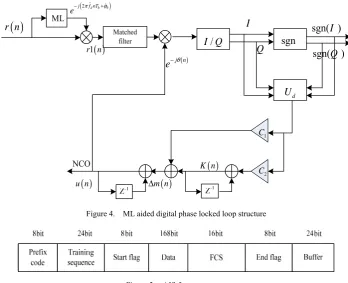
Figure 4. ML aided digital phase locked loop structure
Figure 5. AIS frame structure Frequency offsets estimated by ML is completed with
the help of characteristic sequences in AIS signals, where the AIS frame structure [18] is shown in Fig.5. According to the actual requirements of frequency offset estimation precision, the characteristic sequence selected as pilot signals can be the training sequences, start flag, end flag and their combination forms. The end flag is not continuous with the training sequences and the start flag. They are all dispersed (interval) in the AIS frame and the information symbols separated is usually 184 symbols.
Removed the carrier, the received AIS signal vector (assuming the time synchronization) can be expressed as
[ ]
j2 f nTd br= + = ∗v w s h e π +w (17) where,
(
1 2, ,)
T N
r= r r ……r
(
1, ,2)
T N
v= v v ……v
(
1, ,2)
T N
s= s s ……s
(
0, ,1)
T L
h= h h ……h
(
1, ,2)
T N
w= w w ……w
Nis the number of received symbols,
s
is the GMSKsignals with Eb being the energy per bit, Doppler frequency offset is fd which range from (-3.8)kHz to
(+3.8)kHz, h is the system impulse response, ϕ0 is
signal initial phase, wis the complex Gauss white noise whose expected value is μ=0 and power spectrum density is No/ 2.
Receivers need to decide which sending sequence is with a minimum probability of error, that is to say, it
needs to calculate conditional probability P v r
[ ]
icalled posteriori probability for each possible sequences and the sequence with maximum probability is considered to be the sending sequence. By Bayesian equation
[ ]
R[ ] [ ]
[ ]
i i if r v P v P v r
f r
= (18)
where, f r
[ ]
is the one-dimensional probability density function of r,P v[ ]
i is the probability of signal with i being the possible number, maximum a posteriori (MAP) and ML decision process is of equivalent forvihaving equal probability , the receiver has to calculate the conditional probability fR
[ ]
r vi . Transmitting andreceiving signals are discrete sequences and exist in the same vector space from reference [19]. When transmitting signal isvi, the mathematical expectation of
signal space component rncan be obtained by vector
calculation
E R v
[
n i]
=E v[
in+Wn]
=vin+E W[ ]
n =vin (19)Capital letters are used to denote a random variable, and then the variance can be obtained
(
)
2(
)
2 22o
n in i in n in n
N E⎣⎡ R −v v⎤⎦=E⎣⎡ v +W −v ⎦⎤=E W⎣⎡ ⎦⎤ =
Multidimensional conditional probability r r1 2…rN
on the condition vis
[
]
(
)
2
1 2 1
exp
N n in o
N i
n
o
r v N
f r r r v
N π
=
⎡− − ⎤
⎣ ⎦
= ∏
N is the length of the sequencer and the equation
[
1 2 N i]
f r r…r v is only related to
(
)
21 N n in n r v = −
∑
. Toensure f r r
[
1 2…rN vi]
is the maximum value,(
)
21 N n in n r v = −
∑
shall take minimum value.In (17), handfdare unknown. In order to estimate those two variables, 24bits training sequences, 8bits start flag and 8bits end flag are viewed as characteristic sequences and then ML estimation is done to make the estimation signals be closest to rin (17). i corresponds to the frequency offset fd and with AWGN the cost
function Λcan be expressed as
( ) 2
2
2 2
1 1 =0
d b
N N L
j f n l T
n in n l n l
n n l
r v r v r h s−e π −
= =
Λ = − =
∑
− =∑
−∑
(22)where,N=40
To satisfyΛminimum, ˆγcan be written as
{ } { } ( ) , , 2 2 1 =0
ˆ arg min arg min d b
fdh fdh
N L
j f n l T
n l n l
n l
r h s e
γ γ π γ γ γ = = − − = = Λ =
∑
−∑
(23) In order to estimate ˆγ, functionsΛhas to be partialderivatives ofhand let the partial derivative is 0 at the same time, then
2
1 =0
0
N L
n l n l
n l
r h u
h = −
∂ − =
∂
∑
∑
(24)where, j2 fd( )n l Tb
n l n l
u
−=
s e
− π −Equation (24) can be sorted as
[
]
1 =0 0 0,...,
N K
n l n l n l
n l
u− r h u− l L
=
⎛ ⎞
− = ∈
⎜ ⎟
⎝ ⎠
∑
∑
(25)Equation(25)can be easily expressed with matrix A h⋅ =bwhere the individual elementsA andbare as shown in (26). The system impulse response
is 1
( ) ( )
d d
h=A− f ⋅b f . Pilot signal vector modulated can be expressed as v= ∗u hwithu=
(
u u1, ,2 ……uN)
Tandthen we can obtain the valueΛ.
[
]
[
]
[
]
1 , 1 0,...,0,... , 0,... N
m n m n
n
N
m k n m n k
n
b u r m L
A u u m L k L
∗ − = ∗ − − = = ∈ = ∈ ∈
∑
∑
(26)This process is repeated for all frequencies in the range. Among the possible values of
f
d , the one thatminimizes Λis the frequency offset estimation result
f
ˆ
d.Hence,ˆ=A 1
( ) ( )
ˆ ˆd d
h − f ⋅b f , γˆ=
{ }
f hˆ ˆd, .Considering the impact of Gauss filter on the signal of the generalized channel, channel length is L+1. For
AWGN channel, the channel length is 1.
A,b,hˆandvare simplified into a number and then the initial phase estimation result is
( )
0 ˆ
ˆ arg h
ϕ = (27)
Frequency offset
f
ˆ
d and phase ϕˆ0 estimated by MLare compensated to the received AIS signals
[ ]
{
2}
(2 ˆ ˆ0)1 j f nTd b j f nTd b
r = s h e∗ π +w e− π +ϕ (28) Passing through the matched filter, the ideal signal phase information has not be changed and just the distributions of signal energy are more centralized. In view of only the phase information is useful to the tracking loop, therefore, the following theoretical derivation is based on the equation (28).
According to the derivation of QPSK signal phase characteristics in reference [20], phase characteristics of GMSK signal are derived. By probability theory, random variables variance is proportional to the signal amplitude square and variance is equal to AWGN power spectral
density in value, that is
( )
( )
2 obs n E
N
w n = . r1in (28) is proportional tor2in (29) .
( )
( )+2 0 ( ( ))2 2 j n fnTb j n
r n = Re ⎡⎣ϕ πΔ +Δϕ⎤⎦+e Φ (29) where, ϕ
( )
n is GMSK signals phase, Δ =f fd −fˆd ,0 0 ˆ0
ϕ ϕ ϕ
Δ = − , Φ
( )
n is complex AWGN phase whose mathematical expectation isμ=0and power spectrum phase density is 1, SNR is0 b E R N = . NCO output signal is
( )
j ( )nu n =e−θ (30)
The result of multiplying compensated signals by the NCO output signals is
[ ( ) 2 0 ( )] [ ( ) ( )]
( ) 2( ) ( ) 2 j n fnTb n j n n
z n =r n u n = Re ϕ + Δπ +Δ −ϕ θ +e Φ −θ (31)
Denote θe( ) 2n = Δπ fnTb+ Δ −ϕ θ0 ( )n , the above
equation can be simplified as
[ ( ) ( )] [ ( ) ( )]
( ) 2 j n en j n n
z n = Re ϕ +θ +e Φ −θ (32)
If the sampling rate is optimal and reserving sampling point is in the middle of symbol, GMSK can be approximately regarded as OQPSK and the corresponding phase is
( )
,3 5 7, ,4 4 4 4
n π π π π
ϕ = during
GMSK discrete process. Thus,sin ( )
(
)
2, 22 2
n
ϕ ∈⎧⎪⎨ − ⎫⎪⎬
⎪ ⎪
⎩ ⎭,
(
)
2 2cos ( ) ,
2 2
n
ϕ ∈⎧⎪⎨ − ⎫⎪⎬
⎪ ⎪
⎩ ⎭ can be obtained. Take
2 cos( ( ))=
2
n
ϕ , sin ( ) =
(
)
22
n
ϕ for example, the real part and imaginary part of z n( ) respectively are
[
]
[
]
[
]
Im( ( )) cos( ( ))+sin( ( )) sin[ ( )e e ( )]
Q= z n = R θ n θ n + Φ n −θ n (33)
Due toE w
[ ]
=0, E e⎣⎡ j(Φ( )n−θ( )n)⎤⎦=0is obtained. Definition1:F(
θe( )n)
=E sgn Q I[
( ) −sgn I Q( )]
(34)where, sgn is a piecewise function
Definition2:
(
( )
)
(
)
( )
'( ) 0
e
d e
F n
U n
F θ
θ = (35) Because the derivative of sgn function does not exist, we can use erf function instead of sgn function
( )
(
)
( )
{
(
( )
)
(
(
( )
)
)
}
( )
{
(
( )
)
(
(
( )
)
)
}
'
' 1
0 1
0
d e e e
e e
U n n erf a n
F
a n erf n
F
θ β θ θ
θ β θ
=
−
(36)
where,
( )
(
e n)
R(
cos( ( )) sin( ( ))e n e n)
α θ = θ + θ
( )
(
e n)
R(
cos( ( )) sin( ( ))e n e n)
β θ = θ − θ
( )
( )
' 0 2 4 R
F R erf R
π
⎛ ⎞
= ⎜⎜ − ⎟⎟
⎝ ⎠
When ( ) 3 5 7
4 4 4
n π π π
ϕ = , , , the results of Ud( ( ))θe n are the same.
Assuming that loop middle variables isK n
( )
, thus numerically controlled oscillator output phase isθ( )n = Δm n( )+θ(n−1) (37)
where,
1
( ) d( )e ( )
m n C U θ K n
Δ = +
and
( )
2( ) d( e ) ( 1)
K n =C U θ n +K n− IV SIMULATION RESULTS
As we know that when the radian is odd timesπ 4, phase shiftϕhas a worst effect on signal.
M
is AISsignal symbol length of 256. The symbol period isTb =1/Rb and the symbol rate isRb =9600bps. In
order to make sure the signal demodulation has a little performance degradation,it requires = 2 1
4 2
o b
f MT π
ϕ πΔ < × ,
namely 600
256
o
f
Δ < , Δ = Δ − Δfo fˆ f , Δfˆ is the tracking
frequency offset andΔf is the signal frequency offset. During tracking loop design, phase locked loop is a very important part and phase characteristics of the detector is directly related to the performance of PLL. In the low SNR, the equivalent phase characteristics are not only related to the phase error but also are affected by the SNR of the input signals. By equation (27), equivalent phase discriminators curve in different SNR is shown in Fig.6
( ) (/ ) e n rad
θ π
()
()
/
de
Un
ra
d
θ
-0.5 0 0.5 1 1.5 2
-0.8 -0.6 -0.4 -0.2 0 0.2 0.4 0.6
R=100 R=10 R=1
/ =100
b o
E N
/ =10
b o
E N
/ =1
b o
E N
Figure 6 Phase characteristic curve
In Fig.6, the solid lines describe Eb /No =100dB
phase characteristics, dotted lines stand for
/ 10
b o
E N = dB phase characteristics and dashed lines represent Eb/No =1dB phase characteristics. What can
be seen visually from the fig.6 is that the SNR is lower, the linear range of phase characteristic is narrower and loop locked is slower. In low SNR, due to the deterioration of demodulation performance with SNR decreasing, it requires the loop noise bandwidth smaller than the input signal bandwidthBL<Bi.The smallerBL,
the loop to eliminating the noise is more ability.
Loop SNR can affect phase locked loop tracking accuracy and capture time (lock speed) relates to loop SNR, frequency offsets and input SNR. Taking that minimum loop SNR is 13dB, the damping coefficient ξis 2 / 2and the data rate is 9600bps as an example, PLL capture time is calculated under different frequency and input SNR according to (9), (10), (11), and (13). It is shown in Tab.1
As we can see from Tab.1, with the input SNR decreasing or the frequency offset increasing, loop lock time will be changed to some extent. Take the minimum input SNR 1dB and frequency offset 1500Hz for example, capture time is 42.01 ms(more than 26.67ms) with a traditional phase-locked loop. The more frequency offsets, the more capture time. That is what the AIS system can not tolerate. In order to reduce the capture time, ML aided is used to reduce large Doppler frequency offsets to fast capture zone and then phase locked loop starts to track surplus frequency.
In the experiments, the normalized 3dB bandwidth is
0.4
BT = and the symbol rate is Rb =9600bps .The parameter L=3 is referred to the correlation length.
Doppler frequency shifts are 2000Hz and 3000Hz respectively. AIS datas in the frame assumed without filling datas are of 168bits and input SNR is 1dB~10dB. Let Δfo is 2 Hz, that is to say, when the absolute value is
TABLE I.
PHASE LOCKED LOOP CAPTURE TIME
3800 3000 2500 2000 1500 1000 100 10
1 269.6 168.0 116.7 74.69 42.01 18.67 1.867
×
10-1 1.867×
10-3 2 136.8 85.23 59.19 37.88 21.31 9.470 9.470×
10-2 9.470×
10-4 3 67.42 42.02 29.18 18.68 10.50 4.669 4.669×
10-2 4.669×
10-4 4 34.03 21.21 14.73 9.427 5.303 2.357 2.357×
10-2 2.357×
10-4 5 17.05 10.63 7.383 4.723 2.661 1.181 1.181×
10-2 1.181×
10-4 6 8.551 5.332 3.700 2.368 1.331 0.5921 5.921×
10-3 5.921×
10-5 7 4.281 2.674 1.854 1.187 0.6672 0.2973 2.973×
10-3 2.973×
10-5 8 2.146 1.341 0.9290 0.5947 0.3341 0.1493 1.493×
10-3 1.493×
10-5 9 1.077 0.6702 0.4659 0.2981 0.1683 0.07523 7.523×
10-4 7.523×
10-6 10 0.5383 0.3355 0.2331 0.1491 0.08421 0.03732 3.732×
10-4 3.732×
10-6 The cost function Λof frequency offset estimationerror curve is as shown in Fig. 7~ Fig. 8. Fig. 9~ Fig. 10 shows the tracking phase locked loop curve under different conditions.
-4000 -3000 -2000 -1000 0 1000 2000 3000 4000 20
25 30 35 40 45 50 55 60
Figure 7. Calculation of the cost function in all Doppler range for a signal withEb No=8.5dBandfd =2000Hz
1 2 3 4 5 6 7 8 9 10
0 1 2 3 4 5 6 7 8
( )
b o
E N dB
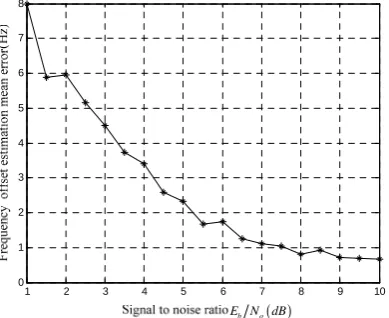
Figure 8. Mean error of ML estimation versus the SNR
Tra
ck
in
g fre
qu
en
cy
o
ffse
t(Hz)
0 50 100 150 200 250 300 350 400 450 500 1992
1994 1996 1998 2000 2002
0 50 100 150 200 250 300 350 400 450 500 1990
1995 2000 2005
(S N/ )L=22dB 1998Hz
2002Hz
(S N/ )L=24dB 1998Hz
2002Hz
Figure 9. Loop tracking results when frequency offset is 2000Hz
Tr
ackin
g fr
equency of
fset(Hz)
Symbol numbers
0 50 100 150 200 250 300 350 400 450 500 2992
2994 2996 2998 3000 3002
0 50 100 150 200 250 300 350 400 450 500 2990
2995 3000 3005
(S N/ )L=22dB
(S N/ )L=24dB 2998Hz
2998Hz
3002Hz
3002Hz
Figure 10. Loop tracking results when frequency offset is 3000Hz It has been observed that the cost function value for the whole frequency range has several minima, representing different frequency candidates, as shown in Fig.7.The smallest one does not always correspond to the Doppler frequency we are looking for. For this reason, the three frequencies that produce the smallest minima are (S/N)i(dB)
tp(ms)
considered. It can be seen from Fig.8 that the estimation error of frequency offsets increases versus the input SNR decreasing. When the SNR is larger than 5dB, the error is within Δ =fo 2Hz and it can meet the requirements of
coherent demodulation. However, when SNR is less than or equal to 5dB, the error is greater than Δ =fo 2Hzand
frequency offsets need to estimate further. From Fig.9 we can obtain that when frequency offset is Δ =f 2000Hz
[
]
ˆ 1998Hz,2002Hz
f
Δ ∈ and input SNR is
(
S N)
i =1dB ,(
)
22L
S N = dB requiring number of symbols is about 150 and
(
S N)
L =24dB requiring number of symbols within the range from 250 to 300. In Fig.10, when frequency offset is Δ =f 3000Hz[
]
ˆ 2998Hz,3002Hz
f
Δ ∈ and input SNR is
(
S N)
i =1dB(
S N)
L =22dBcapture time is less than 150 symbolsand
(
S N)
L =24dB capture time is more than 150 symbols. Fig.9~ Fig.10 show that when we use tracking loops to track frequency offsets based on the ML algorithm and set tracking error is less thanΔ =fo 2Hz,capture time of(
S N)
L =22dBis lessthan
(
S N)
L=24dB. But its anti-noise performance is poor. Tracking time is no longer affected by frequency offsets but the error of ML preliminary estimating frequency offsets. To ensure that the required tracking time is short, the estimation error must be as small as possible.VCONCLUSIONS
Frequency offset estimation methods in AWGN channel are analyzed firstly, and then a method of estimating frequency offsets precisely is proposed. The method is aided by ML algorithm and can be used under conditions of low SNR with large frequency offsets. Simulation results show that the method requiring symbol number of fast capture is less than 256(the number of AIS frame symbols) when the low SNR is 1dB and tracking precision is within 2 Hz. It can satisfy the requirements of AIS signals demodulation.
ACKNOWLEDGMENT
This work was supported in part by a grant from the National Natural Science Foundation of China (No.61371108).
REFERENCES
[1] Ahmed Masmoudi, Faouzi Bellili, Sofiène Affes and Alex Stéphenne, “Closed-Form Expression for the Exact Cramér-Rao Bound of Timing Recovery Estimators from MSK Transmissions,” IEEE Vehicular Technology Conference(VTC Spring),2011,7(3), pp.1-5.
[2] P. K. Dash, Shazia Hasan, “A Fast Recursive Algorithm for the Estimation of Frequency, Amplitude, and Phase of
Noisy Sinusoid” IEEE Transactions on Industrial Electronics,2011.10(58),pp.4847-4856.
[3] Zhihui Liu, Lihua Fu, Shizhong Zhang, “Subspace Approach for Frequency Estimation of Superimposed Exponential signals in Multiplicative and Additive Noise”. Journal of Software,2013,pp:1671-1677.
[4] Yunlv Hong, Di He, “An Improved Doppler Frequency Offset Estimation Algorithm of OFDM System under High-speed Movement Environment”. Journal of Computers, 2013,pp:3192-3195.
[5] Daeyoung Kim, Madihally J, Narasimha and Donald C.CoX, “An Improved Non-Data-Aided Carrier Frequeney Offset Estimator for PSK Packets” Global Telecommunications Conference,1996,(2), pp:1345-1347. [6] S.Tretter, “Estimating the frequency of a noisy sinusoid by
linear regression” IEEE Transactions on Information Theory,1985,31(6), pp. 832-835.
[7] Kay, “A fast and accurate single frequeney estimator” IEEE Transactions on Acoustics,Speech and Signal Processing,1989,37(12), pp. 1987-1990.
[8] Luise M, Reggiannini R, “Carrier Frequeney Recovery in All-Digital Modems for Burst-Mode Transmission” IEEE Transactions on Communications.1995, pp. 1169- 1178. [9] Hua Fu, Pooi Yuen Kam, “MAP/ML Estimation of the
Frequency and Phase of a Single Sinusoid in Noise” IEEE Transactions on Proeessing, 2007,55(3), pp. 834-845. [10]Marian Jurado Gallardo ,Ulrieh Sorge, “Coherent
Receiver for AIS Satellite Detection” IEEE the 4th International Symposium on Communications. Control and Signal Proessing,2010, pp. l-4.
[11]Shuai Tao, Liu Huijie, “The Design of DPLL for Low SNR Signals with Large Frequency Offset” Journal of Electronics and Information Technology, 2005,27 (8): 1-5. [12]Zhang Juesheng, Zheng Jiyu, Wan Xinping. PLL. Xi'an:
Xi'an Electronic and Science University Press, 1992, pp.5-6, 20-30.
[13]Sakai Y, Sugamoto M, Nakatani E, Mizutori A, “Experiment on Phase Sensitive Amplification of BPSK Signal Using Phase-Lock Costas Loop Circuit” OptoElectronics and Communications Conference held jointly with 2013 International Conference on Photonics in Switching(OECC/PS),2013,pp.1-2.
[14]Chi-Sheng Lin, Ting-Hsu, Chin-Ling Wey. “An Effective Phase Detector for Phase-Locked Loops with Wide Capture Range and Fast Acquisition Time.”Proceedings of 2010 IEEE Internationnal Symposium on Circuits and Systems(ISCAS),2010,pp.1843-1846.
[15]U.Mengali and A.N.D’Andrea, Synchronization Techni- ques for Digital Receivers, Ed New York: Plenum Press,1997,pp.28-29,149
[16]G. Kawas Kaleh, “Differential detection of partial response continuous phase modulation with index 0.5,” Veh. Technol. Conf, San-Francisco, CA, Apr. 1989, pp. 115-121 (to appear in the IEEE Trans. Commun)
[17]G. Kawas Kaleh, “Simple coherent receivers for partial response continuous phase modulation,” IEEE J. Select. Areas Commun.vol. 9, pp. 1427-1436, Dec. 1989
[18]GBT20068-2, Technical Requirements for Automatic Identification System (AIS).
[19]Chang Xiaodan, “Research and Simulation of Viterbi Equalization Algorithm” Tianjin: Nankai University, 2002 [20]Sampaioneto R, Perforance J M, “Analysis of All digital
Shexiang Ma was born in Qingyang,
Gansu Province, China, in July 1962. He received the D.E. degree from Xi'an Jiaotong University, China, in 2002. His major is image processing and signal processing.
He is now a professor in Tianjin University of Technology. He has published many papers such as signal reconstruction from multiscale edges using spline function interpolation(Wa, Bellingham: Optical Engineering, 2001), Error concealment of video based on motion estimation(Orlando, Florida: Speech and Signal Processing, 2002), Variable depth embedded compression coding for natural images(IEICE Trans. Commun,2001) and so on. His research direction is communications and signal processing.
Yaping Feng was born in Liaocheng, Shandong Province,