www.pharmascholars.com
99
Original Article
CODEN: IJPNL6
DESIGN, DEVELOPMENT AND DISSOLUTION ENHANCEMENT OF SIMVASTATIN
WITH POLOXAMER 407 BY KNEADING METHOD
1
Taranjit kaur,
2Harpreet Singh*
1
Department of Pharmaceutics, ASBASJSMCOP, Bela Ropar, Punjab, India
2
St. Soldier Institute of Pharmacy, jalandhar, Punjab, India
*Corresponding author e-mail: [email protected]
Received on: 24-05-2016; Revised on: 01-06-2017; Accepted on: 14-06-2017
ABSTRACT
The aim of the present study was to enhance the solubility and dissolution rate of Simvastatin (SIM) under the frame of improved bioavailability and dissolution rate. Solid dispersion of SIM was prepared by using LBG, PXM407 as carrier in different ratios through Kneading method. A 32 full factorial design was applied systematically and effect the influence of the individual and combined effect of independent variables (X1) ratio and (X2) concentration of surfactants on the dependent variables percent dissolution efficiency at 60 min (%DE 60) and yield percent. The solid dispersions and optimized formula was characterised on the basis of drug content analysis, %yield and in vitro
dissolution study, Differential scanning calorimetry, Scanning transmission microscopy, X-ray diffraction and IR spectroscopy was performed to identify the physicochemical interaction between drug, carrier and other formulation constituents. Results showed that significantly better dissolution rate of solid dispersion SIM with PXM407 in the ratio of 1:8. This study could be very much helpful for better bioavailability and dissolution rate of poorly water soluble drug avoiding first pass metabolism.
KEYWORDS: Simvastatin, Dissolution rate, Poloxamer407, Kneading method
INTRODUCTION Oral drug delivery system is the
most convenient and simplest way of administering drugs and its greater stability, accuracy and easy production of solid oral dosage forms have many advantages over other types of different oral dosage forms. Therefore, most of the new chemical entities (NCE) are intended and used as a solid dosage form which originates an effective and reproducible in vivo plasma concentration after oral administration. Moreover, most promising NCEs, despites their high permeability, are generally only absorbed in the upper small intestine, absorption being reduced significantly after the ileum, showing, therefore, that there is a small absorption window. Solid dispersions are one of the most successful strategies that give better drug release of poorly soluble drugs. These can be defined as molecular mixtures of poorly water soluble drugs in hydrophilic carriers, which present a drug release profile that is driven by the polymer properties.
Simvastatin having BCS class II drug which is having high permeability, low solubility and low bioavailability and is a 2,2-Dimethylbutanoic acid (1S,3R,7S,8S,8aR)-1,2,3,7,8,8ahexahydro–3,7–
dimethyl–8-[2-[(2R,4R)-tetrahydro–4 hydroxy–6–oxo– 2Hpyran–2yl]ethyl]-1–naphthalenyl ester and used to treat Hypercholestremia Dyslipidemia.[1,2,3,4] Locust Bean Gum is a white crystalline powder and obtained from the endosperm of seed of the carob (locust) tree Ceratonia siliqua, Family Leguminase.[5,6] Surfactants are molecules having different polar and nonpolar regions and used for solubilising the drug and may also lower the surface tension that increases the solubility of drug in given organic solvent and surfactants using like Poloxamer 407 is a polyethylene oxide-polypropylene oxide- polyethylene oxide triblock co-polymer of non-ionic surfactant which is used as a solubilising agent and also enhances the solubility and dissolution rate of
International Journal of Pharmacy
www.pharmascholars.com
100
poorly water insoluble drugs have been investigated individually, no reporting studies are available on their combined use for enhancing the solubility and dissolution rate of poorly soluble drugs.[7,8,9,11]
MATERIAL AND METHODS
Material: Simvastatin received as a gift sample from
Dr. Reddys’ Pharmaceuticals’ Ltd. Poloxamer 407 used as a surfactant and solubility enhancer received as a gift sample from Sigma Aldrich Chem P Ltd. Mumbai and ethanol, methanol, magnesium state, talc, lactose, disodium hydrogen orthophosphate and potassium dihydrogen orthophosphate were purchased from Loba Chemicals Mumbai, India.
Methods
Physiochemical Characterisation of Pure Drug Solubility Determination of Pure drug by UV Spectroscopy Method
1. Solubility study of Pure drug
The solubility studies of Simvastatin carried out in different solvent systems and excess amount of drug was added in 10ml of each solvent in screw capped vials and kept in a water bath shaker at body temperature and shaken for 24hours until the equilibrium was attained and prepared samples were filtered and analysed by UV spectrophotometer.
2. Physical appearance and melting point
determination of pure drug
The pure drug Simvastatin sample was analysed by its organoleptic properties to prove the authenticity of the sample. Melting point of pure sample was analysed by Capillary method and in this method the capillary tube one side of the capillary was closed by heating and the other side drug was filled and took the capillary tube into the melting point apparatus and temperature was noticed when the solid drug melts into the liquid form and the melting point was noticed and compared with literature value.
3. Drug excipients compatibility studies
When the solid dispersions were designed and the compatibility of drug and polymer used within the systems and conform that drug was not interacting with the polymer under experimental conditions (40±5oC and 75±5% RH) for two weeks. The physical mixture 1:8 of drug and modified locust bean gum was prepared and the physical mixture was mixed thoroughly, sieved (size no. 60) and filled in dried vials and the vials were examined at regular intervals for discoloration, liquefaction and clump formation and the FTIR spectra of physical mixture was observed.
4. Preparation of standard curve of Pure drug in
Methanol
50mg of Simvastatin was dissolved in 100 ml of methanol; 50ml of this solution was taken and diluted to 100ml again with methanol to prepare a stock solution of 250µg/ml as a stock solution, aliquots of
0.1ml, 0.2ml, 0.3ml, 0.4ml, 0.5ml, 0.6ml and 0.8ml were transferred to 10ml volumetric flask and volume was made up to 10ml with methanol. The absorbance of these solutions was measured at 238nm using methanol as blank.
Characterisation of Locust Bean Gum into Modified Locust Bean Gum
1. Swelling index
One gram of LBG powder was accurately weighed and transferred to a 100 ml stoppered graduated cylinder. The initial bulk volume of 1 gm of locust bean gum was noted and distilled water was added in sufficient quantity to produce and make up the volume upto 100 ml and stored at room temperature and the sediment volume of the swollen mass was measured after 24 hour. The swelling index was calculated as:
Swelling index = V2-V1/V1 *100
(1) V1 initial volume of material before hydration
V2 volume of hydrated material.
2. Photo microscopic study
Photo microscopic image of LBG and MLBG were taken at ×450 magnifications
by photo microscope (Motic digital microscope, Japan).
Preparation of Binary System by Kneading Method
Physical mixtures were accurately weighed of SIM with MLBG: Poloxamer407 in drug: polymer ratio of 1:2, 1:5, and 1:8 for 5 min using glass mortar and pestle and physical mixture was triturated by using a small volume of ethanol-water solution to give a thick paste and kneaded for 30 min respectively, dried at 45oC in an oven and dried mass was pulverized, passed through 60 mesh sieve size, weighed and transferred into airtight container and stored for further use.
Characterisation of Solid dispersions Drug Content
Pure drug and solid dispersions equivalent to 10 mg weighed and dissolved in a suitable amount of solvent (methanol 25ml), filtered the solution and diluted and used as solvent and drug content was analyzed by UV at 238nm spectrophotometer.
Percentage yield
Percentage yield according to be calculated as the final weight of solid dispersions and the total weight of drug and carrier used by using the formula and determine its calculated value.
%Yield=(a/b+c)*100 (2)
Invitro drug release studies[3]
www.pharmascholars.com
101
dissolution media phosphate buffer pH6.8 at speed of 100 rpm at temperature of 37±0.5oC. Samples were collected periodically and replaced with 10ml of freshly prepared dissolution medium and collected samples were filtered and analysed at 239.5nm using UV-visible spectrophotometer against phosphate buffer pH6.8 used as blank.
Experimental Design[10,12]
The 32 full factorial design was applied systematically to study the influence of the individual and combined effect of independent variables (X1) and
concentration of surfactants (X2) on the dependent
variables percent dissolution efficiency for 60min(%DE 60) and percent yield. In this design, two
factors are evaluated each at three levels and experimental trials were performed at all nine possible combinations in the prepared solid dispersions. Statistical model incorporating interactive and polynomial terms is used to evaluate the response.
Y= b0 + b1X1 + b2 X2+ b12 X1X2 + b11(X1)2+ b22(X2)2
(3)
Where, Y is the dependent variable
b0 is the arithmetic mean response of the nine runs
b1 is the estimated coefficient for the factor X1.
The main effects (X1 and X2) represent the average
result of changing one factor at a time from its low to high value. The interaction terms (X1 X2) show how
the response changes when two factors are simultaneously changed. The polynomial terms ((X1)2and (X2)2) were included to investigate
nonlinearity.
Characterization of the Prepared Solid Dispersions
1. Infrared spectroscopy
Infrared spectroscopy (IR) determines the solid state of the drug, polymer and optimized solid dispersions in the carrier regardless of the state of the carrier. The absence of any significant change in the IR spectral pattern of drug & polymer physical mixture indicated the absence of any interaction between the drug and the polymer. The spectra were scanned over a frequency range of 4,000–400 cm−1.
2. X- Ray diffraction studies
The X-ray diffractometry usually employed in the pharmaceutical field to characterized the pure drug, polymer and solid dispersion. The powder X-ray diffraction is used for detection of crystalline phases in mixed system. The crystallinity parts give sharp
narrow diffraction peaks and the amorphous component gives a very broad peak.
3. Differential scanning calorimetry (DSC)
This technique used to determine the crystallinity nature of pure drug and optimized solid dispersions by quantifying the heat associated with fusion of the material and increasing the temperature of an amorphous solid Glass transition may occur. As the temperature increases the sample eventually reaches its melting temperature (Tm). The melting process results in an endothermic peak in the DSC curve. As the temperature increases, an amorphous solid will become less viscous. At some point the molecules may obtain enough freedom of motion to spontaneously arrange themselves into a crystalline form. This is known as the crystallization temperature (Tc).
4. Scanning electron microscopy (SEM)
Samples of pure drug (SIM), MLBG and the optimized solid dispersion were mounted onto the stubs by using double-sided adhesive tape and then coated with a thin layer of gold palladium alloy (150–200A°). The scanning electron microscope was operated at an acceleration voltage of 20 KV, working distance (12– 14 mm).
From the above design the optimized solid dispersion was selected and prepared the capsule dosage form by using excipients and characterised by invitro
dissolution studies, Disintegration time and content uniformity.
Stability Studies of Prepared dosage form
The accelerated stability studies of the capsule dosage form in amber coloured screw capped bottles and checked as per ICH guidelines at 40±2ºC and 75± 5% RH for one month. The dissolution profile considered as similar when f2 lies between 50-100. The dissolution profile of Capsule dosage formulation before and after stability testing were compared using a similarity factor (f2) which is calculated from the following formula:
ƒ2 = 50 log{[1+(1/n)Ʃt=1 n(Rt-Tt)2]-0.5100} (4)
Where, n is the dissolution time and Rj and Tj are the reference and test dissolution values at time t.
Physiochemical Characterisation of Pure Drug Solubility study of pure drug
The solubility studies of Simvastatin was determined in different solvents as shown in given Table 1. respectively.
Table 1 Solubility of Simvastatin in different solvents
S. No. Solvents Solubility (µg/ml)
1. Distilled water 1.49±0.16
2. Methanol 2.05±0.04
3. HCL buffer pH1.2 1.01±0.05
www.pharmascholars.com
102
Physical appearance and melting point
determination of pure drug
The pure drug sample was analyzed by its various organoleptic, properties and possesses similar white crystalline powder and texture as given in officials (Indian pharmacopoeia). The melting point of procured sample was found to be 137.2.0± 1ºC and similar with its literature value.
Drug excipients compatibility studies
Drug-Excipient compatibility studies were revealed that there was no discoloration, liquefaction and clump formation and the characteristic peaks of the drug in the IR spectrum were retained in the physical mixture and no significant shift in the peaks corresponding to the drug was observed on storage and the drug: carrier ratio was compatible with each other.
Fig.1 FTIR spectra of physical mixture of simvastatin and MLBG
Preparation of standard curve of Pure drug in
Methanol:The plot of different concentrations of pure
drug was found to be linear in concentration range of 2.5 to 15µg/ml at 238nm in methanol .
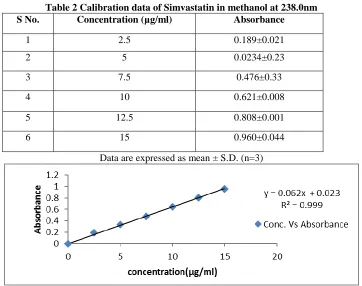
Table 2 Calibration data of Simvastatin in methanol at 238.0nm
S No. Concentration (µg/ml) Absorbance
1 2.5 0.189±0.021
2 5 0.0234±0.23
3 7.5 0.476±0.33
4 10 0.621±0.008
5 12.5 0.808±0.001
6 15 0.960±0.044
Data are expressed as mean ± S.D. (n=3)
Fig.2 standard curve of Simvastatin in methanol Characterisation of Locust Bean Gum into
Modified Locust Bean Gum
The swelling index of the MLBG was significantly found to be 1659.5 and becomes lower when compared with LBG was significantly found to be 1649.5 due to the volatile acetyl content of MLBG as significantly expressed less than that of LBG. Due to swelling nature of carrier, the extensive surface of the carrier
increased during dissolution rate of deposited drug was markedly enhanced. The pH value of LBG (1%w/v) was 5.9 and pH value of MLBG (1%w/v) was 5.37.
Photo microscopic study
The photo microscopic study of LBG powder and after heating for 2hr and formed into dry MLBG powder form and its changes occur as shown in the given
images.
www.pharmascholars.com
103
Characterisation of Solid dispersions Drug Content and % Yield
The percent yield and drug content of pure drug and different solid dispersions were determined and drug content value ranges between 96.53±0.0.1-95.32±0.02 and % yield value ranges between 72.6±0.09-83.0±0.075% and decreases at the higher concentrations due to the difficulty in sieving at higher polymer: surfactants ratios. Low values of standard
deviation in percent yield and drug content indicated that drug was uniformly distributed in all solid dispersions and all the formulations showed uniformity and reproducibility of the results obtained.
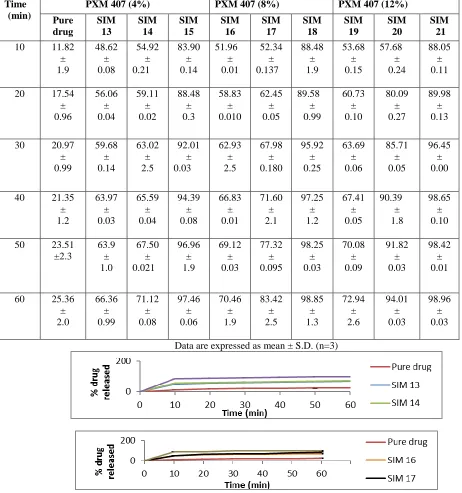
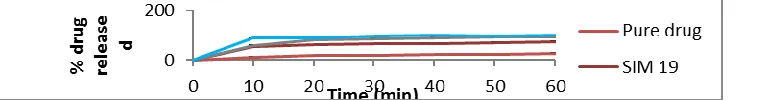
Invitro drug release studies
The In vitro release of pure drug and different solid dispersions were determined and plotted the graph between % drug released vs time as shown below:
Table 3 Drug release profile of pure drug and different solid dispersions with Poloxamer 407 (4%, 8%, 12%)
Mean Percent Released ± Standard Deviation
Time (min)
PXM 407 (4%) PXM 407 (8%) PXM 407 (12%)
Pure drug SIM 13 SIM 14 SIM 15 SIM 16 SIM 17 SIM 18 SIM 19 SIM 20 SIM 21
10 11.82 ± 1.9 48.62 ± 0.08 54.92 ± 0.21 83.90 ± 0.14 51.96 ± 0.01 52.34 ± 0.137 88.48 ± 1.9 53.68 ± 0.15 57.68 ± 0.24 88.05 ± 0.11
20 17.54 ± 0.96 56.06 ± 0.04 59.11 ± 0.02 88.48 ± 0.3 58.83 ± 0.010 62.45 ± 0.05 89.58 ± 0.99 60.73 ± 0.10 80.09 ± 0.27 89.98 ± 0.13
30 20.97 ± 0.99 59.68 ± 0.14 63.02 ± 2.5 92.01 ± 0.03 62.93 ± 2.5 67.98 ± 0.180 95.92 ± 0.25 63.69 ± 0.06 85.71 ± 0.05 96.45 ± 0.00
40 21.35 ± 1.2 63.97 ± 0.03 65.59 ± 0.04 94.39 ± 0.08 66.83 ± 0.01 71.60 ± 2.1 97.25 ± 1.2 67.41 ± 0.05 90.39 ± 1.8 98.65 ± 0.10
50 23.51 ±2.3 63.9 ± 1.0 67.50 ± 0.021 96.96 ± 1.9 69.12 ± 0.03 77.32 ± 0.095 98.25 ± 0.03 70.08 ± 0.09 91.82 ± 0.03 98.42 ± 0.01
60 25.36 ± 2.0 66.36 ± 0.99 71.12 ± 0.08 97.46 ± 0.06 70.46 ± 1.9 83.42 ± 2.5 98.85 ± 1.3 72.94 ± 2.6 94.01 ± 0.03 98.96 ± 0.03
www.pharmascholars.com
104
Fig.4 In vitro dissolution profile of %pure drug released vs time solid dispersions with Poloxamer 407 (4%, 8%, 12%)
Experimental Design
The solid dispersions were prepared and experimental design applied on these preparations and after applying the design and select the optimized value on the basis
of dissolution study and % yield and determine the results of Regression analysis, Analysis of variance and validation of results of checking updates.
Table 4 Composition of Factorial Design Batches with Poloxamer 407
X1
drug to polymer ratio, X2 concentration of surfactants Poloxamer 407 %DE60 dissolution efficiency at 60 min.
Table 5 Result of Regression Analysis
According to p value, full model or reduced model can be selected, so in the present study, full model having both significant and non significant p values was used in obtaining dependent variables because the fitness of full model to the system is better than reduced model.
Table 7 The Results of Analysis of Variance Variables levels in coded
Batch code X1
(Ratio)
X2
(Concentration)
%DE60±SD %Yield± SD
SIM 13 -1 -1 54.85±0.254 75.2±0.09
SIM 16 -1 0 57.84±0.007 76.2±0.01
SIM 19 -1 +1 58.67±0.405 84.2±0.41
SIM 14 0 -1 57.62±0.429 85.4±0.41
SIM 17 0 0 63.81±1.54 86.5±0.35
SIM 20 0 +1 68.57±4.10 87.5±0.05
SIM 15 +1 -1 84.08±0.874 85.1±0.02
SIM 18 +1 0 87.59±0.047 84.2±0.41
SIM 21 +1 +1 92.89±0.198 83.1±0.07
Coefficients estimates
Response b0 b1 b2 b12 b11 b22 R2
%DE 60 63.45 15.59 3.93 1.25 9.26 -0.18 0.9952
p value - 0.0002 0.0103 0.2309 0.0043 0.8882 -
% yield 86.42 3.85 0.47 -1.18 -6.18 0.067 0.9936
p value - 0.0006 0.1558 0.0304 0.0007 0.8863 -
Response df SS MS F R2
%DE 60 Regression
Error
5 1729.37 345.87 124.76 0.9952
3 8.32 2.77 - -
% yield Regression
Error
5 172.24 34.45 93.78 0.9936
www.pharmascholars.com
105
The equation can be generated by putting values of coefficients in following equation in terms of coded factors.
Dissolution efficiency Y = 64.02+ 15.59X1 + 4.35 X2+ 1.25 X1X2 +
8.41(X1)2+ 0.24 (X2)2
% Yield
Y = 86.42+3.85X1 + 0.47X2-1.18X1X2 -6.18(X1)20.067
(X2)2
\Positive sign of the term indicates positive (additive) effect, while negative sign indicates negative (antagonistic) effect of the factor on the response and can be concluded from the equations that X1 (drug:
polymer ratio) shows the larger positive effect than term X2 (concentration of surfactant Poloxamer 407)
on percentage dissolution efficiency at 60min and yield percent.
Equations were used to calculate percentage relative error between predicted values and experimental values of each response and percentage relative error obtained from checkpoint batches was in the range of 1.7to 0.35. Low values of the relative error show that for both factors, there is a reasonable agreement of predicted values and experimental values. This proves the validity of model and confirms the effects of drug: polymer ratio and the concentration of surfactant PXM 407on percentage dissolution efficiency at 60 min and yield percent.
% Relative error = [(Predicted value- experimental value) / predicted value]*100 Eq. 6.1
Table 8 Validation of Model Obtained Using Experimental and Predicted results of checking update
Design-Expert® Software Factor Coding: Actual DE
Design Points 92.89
54.85
X1 = A: Ratio X2 = B: Conc.
-1.00 -0.50 0.00 0.50 1.00
-1.00 -0.50 0.00 0.50 1.00 %DE60 A: Ratio B: C on c.
60 70 80
90
Design-Expert® Software Factor Coding: Actual Yield
Design Points 87.5
75.2
X1 = A: Ratio X2 = B: Conc.
-1.00 -0.50 0.00 0.50 1.00
-1.00 -0.50 0.00 0.50 1.00 %Yield A: Ratio B: C on c. 76
78 80 82 84
84
86
86
Fig. 5 Contour plots with Poloxamer 407showing a) percentage dissolution
efficiency at 60min b) percentage yield.
Des ign-Ex pert® Software Fac tor Coding: Ac tual DE
Des ign points above predic ted value
Des ign points below predic ted value
92.89
54.85
X1 = A: Ratio X2 = B: Conc .
-1.00 -0.50 0.00 0.50 1.00 -1.00 -0.50 0.00 0.50 1.00 50 60 70 80 90 100 % DE 60 A: Ratio
B: Co nc.
Design-Expert® Software Factor Coding: Actual Yield
Design points above predicted value
Design points below predicted value
87.5
75.2
X1 = A: Ratio X2 = B: Conc.
-1.00 -0.50 0.00 0.50 1.00 -1.00 -0.50 0.00 0.50 1.00 74 76 78 80 82 84 86 88 % Yi eld A: Ratio B: Conc.
Fig.6 Response surface plots with Poloxamer 407 showing a) percentage dissolution efficiency at 60min b) Percentage yield.
The contour lines indicates that the higher the polymer concentration and increasing the concentration of Poloxamer 407 and more significant value in the dissolution enhancement. However, for yield percent, decrease at higher polymer ratio was observed, which may be attributed to difficulty of sieving when higher polymer ratio was used.
Batch code
Variables %DE60
Predicted %DE60 ± SD Exp %Rel. error %Yield Predicted %Yield ± SD Exp. %Rel. Error
X 1 X 2
PXM 407 1
-1 +1 59.62 58.56 ± 0.60
1.7 78.09 77.43
± 0.63
0.84
PXM 407 2
+1 -1 82.94 82.79 ± 0.48
0.18 84.86 85.16 ± 0.20
www.pharmascholars.com
106
Characterization of the Prepared Solid Dispersions Infrared spectroscopy
Infrared spectra of pure drug, Poloxamer 407 and optimized solid dispersion as shown in the given
figures and exhibited significant decrease in intensity of O-H stretching vibrations which may be due to
intermolecular hydrogen bonding in the optimized solid dispersions. The spectra peaks of drug were almost unchanged in the optimized solid dispersions which indicate that the overall symmetry of molecule was not affected.
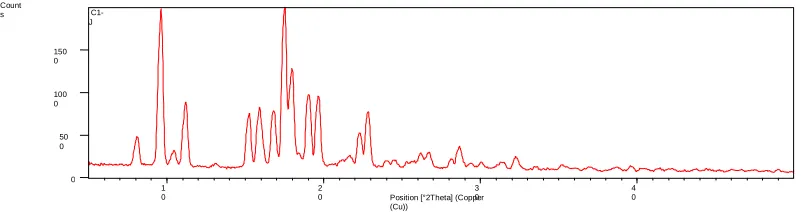
Fig 7 FTIR spectra pure drug, Poloxamer 407 and optimized formulation X- Ray diffraction studies
The X-ray diffraction studies of pure drug, modified locust bean gum and optimized solid dispersions and the characteristics diffraction peaks of simvastatin present peaks at (2θ) 9.63o, 11.24o, 15.90o, 16.889o,
17.56o, 18.04o, 19.74o, 22.84o, 28.68o, 33.51o, 35.17o, and 38.73o indicate the crystalline nature of the drug and Poloxamer 407 shows sharp peaks at 19.28o,
23.40o, 23.60o, 26.33o and optimized solid dispersion shows sharp peaks at 17o, 19o and 23o and shows that with reduced peak height area were observed, that indicates the reduced in the crystallinity nature of the simvastatin as some of the drug converted into the amorphous form in the solid dispersion.
RC S AI F PU, Ch andig arh
Sp ec trum Name: T aranjit Kaur-1 .s p Des c riptio n: C-1
Date Created: tu e may 0 1 12:40:38 20 12 India Stand ard Time (GMT +5 :3 0)
4000. 0 3600 3200 2800 2400 2000 1800 1600 1400 1200 1000 800 600 400. 0
15. 0 20 25 30 35 40 45 50 55 60 65 70 75 79. 8 cm -1 %T
3 5 5 1 .4 8
3 0 1 2 .1 8
2 9 6 9 .5 7 2 9 5 6 .1 5 2 9 3 0 .3 3
2 8 7 2 .7 2
1 6 9 8 .3 8 1 4 6 7 .2 4
1 3 9 0 .9 71 3 6 8 .8 7 1 3 4 9 .2 1
1 3 1 0 .4 2
1 2 6 8 .3 2 1 2 2 6 .0 6
1 1 6 5 .5 1 1 1 1 6 .8 6
1 0 7 2 .4 7 1 0 5 5 .5 4
1 0 4 4 .6 7 1 0 1 1 .7 9
9 9 0 .9 9 9 7 1 .7 2
9 4 0 .6 4 9 2 1 .5 2
8 9 2 .1 9
8 6 9 .5 4 8 4 2 .3 0
7 9 8 .1 3 7 7 5 .1 5
7 5 4 .4 8 7 3 8 .7 3
6 9 9 .6 5 6 5 2 .8 6
6 2 5 .9 7
5 7 8 .2 6 5 5 3 .8 1
4 8 6 .7 9 4 3 9 .7 0
RC S AIF PU, Ch andig arh
Sp ec trum Name: T aranjit Kaur-3 .sp Desc riptio n: C-3
Date Created: tu e may 0 1 12:42:10 20 12 India Stand ard Time (GMT +5 :3 0)
4000. 0 3600 3200 2800 2400 2000 1800 1600 1400 1200 1000 800 600 400. 0
0. 0 5 10 15 20 25 30 35 40 45 50 55 60 65. 6 cm -1 %T 3961.03 3468.11 2971.60 2889.52 2741.86 2695.07 2588.27 2239.02 2166.98 1971.42 1627.06 1467.72 1456.03 1373.15 1360.20 1343.53 1281.18 1242.76 1150.17 1112.30 1060.31 963.59 946.35 841.81 667.71 529.00 509.37
RC S AI F PU, Ch andig arh
Sp ec trum Name: T aranjit Kaur-6 .sp Des c riptio n: C-6
Date Created: tu e may 0 1 12:49:01 20 12 India Stand ard Time (GMT +5 :3 0)
4000. 0 3600 3200 2800 2400 2000 1800 1600 1400 1200 1000 800 600 400. 0
34. 0 36 38 40 42 44 46 48 50 52 54 56 57. 6 cm -1 %T 3416.78 3012.55 2926.46 2886.40 2165.86 1697.72 1651.16 1466.47 1388.88 1345.86 1271.18 1227.86 1152.63 1113.72 1073.00 964.92 870.00 842.56 813.68 668.96 612.47 578.49
www.pharmascholars.com
107
Position [°2Theta] (Copper (Cu))
10 20 30 40
Counts
0 1000 2000
C3-J
Position [°2Theta] (Copper (Cu))
10 20 30 40
Counts
0 100 200 300 400
C6-J
Fig. 8 X-ray diffraction of pure drug, Poloxamer 407 and optimized formulation with Poloxamer407
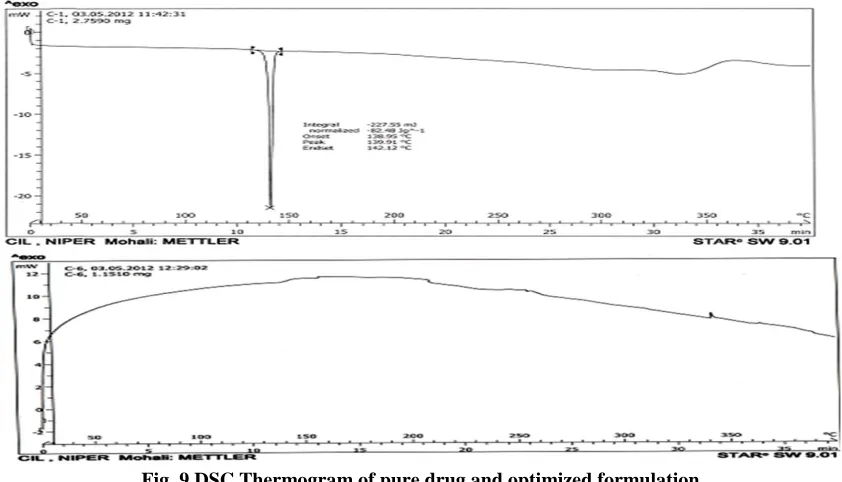
Differential scanning calorimetry (DSC)
The DSC curve for Simvastatin showed a sharp endothermic peak at 139.9oC corresponding to its melting point indicates its crystalline nature and its change was broadened and shifted toward lower temperature, with reduced intensity, in the optimized
prepared solid dispersion. and due to the higher polymer concentration and uniform distribution of drug in the crust of polymer that indicates its complete miscibility of molten drug in polymer. Absence of peak for the drug indicates that the drug is distributed homogenously in an amorphous nature state within the solid dispersions without any interaction.
Fig. 9 DSC Thermogram of pure drug and optimized formulation
Scanning electron microscopy (SEM): The SEM
photographs of pure drug was observed that shows highly crystalline material and characterised by its needle shaped crystals and optimized solid dispersion was observed that the crystals of solid
www.pharmascholars.com
108
Fig. 10 Scanning electron photomicrograph of optimized solid dispersion Poloxamer 407 at 300 and 600 X The optimized solid dispersions were filled into hard gelatin capsule shell and the final capsule dosage forms by using lactose, talc and other excipients were prepared and designated as C2
Table 9 Evaluation parameters of Capsule dosage form C2 with Poloxamer 407 Formulation code
C2
Weight variation (mg)
Disintegration time (min)
Content uniformity (%)
1 243 ± 0.002 28 98.90±0.01
2 242 ±0.020 30 96.80±0.05
3 240 ±0.36 28 93.32±0.00
4 237 ±0.358 25 99.64±0.01
5 246 ±0.247 26 97.25±0.48
6 236 ± 0.417 29 96.90±0.05
7 240 ±0.145 27 96.87±0.05
8 244 ± 0.005 31 98.38±0.08
9 240 ± 0.0005 30 95.51±0.14
10 242 ± 0.258 26 91.64±0.16
Data are expressed as mean ± S.D (n = 3)
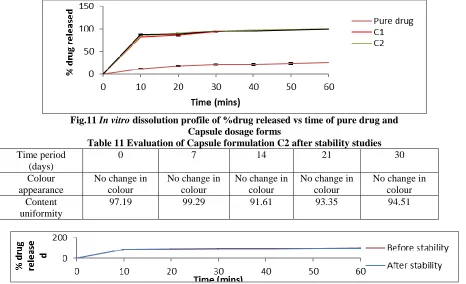
Table 10 Invitro Dissolution profile of pure drug and Capsules dosage forms
Time (min)
Mean Percent drug Released ± Standard Deviation
Pure drug C2
10 11.82±1.9 87.45±0.06
20 17.54±0.96 88.21±0.04
30 20.97±0.99 91.21 ±0.04
40 21.35±1.2 95.25±0.01
50 23.51±2.3 97.25 ±0.03
60 25.36±2.0 99.75 ±0.19
www.pharmascholars.com
109
Fig.11 In vitro dissolution profile of %drug released vs time of pure drug and
Capsule dosage forms
Table 11 Evaluation of Capsule formulation C2 after stability studies
Time period (days)
0 7 14 21 30
Colour appearance
No change in colour
No change in colour
No change in colour
No change in colour
No change in colour Content
uniformity
97.19 99.29 91.61 93.35 94.51
Fig.12 In vitro dissolution profile of %drug released vs time of pure drug and Capsule dosage form C2
CONCLUSION
The present study was designed for the solubility and dissolution enhancement of poorly soluble drugs by the formulation of solid dispersions and various methods to prepare the solid dispersions. In the current studies kneading method was adopted for the preparation of solid dispersions were prepared by adding the various surfactants Poloxamer 407 at different concentrations and nine formulations were prepared kneaded for 30 minutes and characterized for percentage yield, drug content, solubility of solid dispersions in phosphate buffer pH 6.8., and in vitro
release studies also increases with increasing drug: polymer ratio. A 32 full factorial design was used to systematically study the influence of the individual and combined effect of independent variables (X1) ratio and (X2) concentration of surfactants on the dependent variables percent dissolution efficiency at 60 min (%DE 60) and yield percent. and optimized solid dispersions were formulated into capsule dosage form and shows the better drug release and increases the solubility and dissolution rate and no remarkable change occur in the capsule dosage form before and after stability studies.
.
REFERENCE
1. Armstrong NA. Pharmaceutical Experimental Design and Interpretation, 2n ed Taylor & Francis Group; 2006.
2. Ambike Anshuman .A, Mahadik .R.k., Paradkar 2005 Spray- Dried Amorphous Solid Dispersions of Simvastatin, a Low Tg In Vitro and invivo Evaluation Pharmaceutical Research. 2005;22(6):990-998.
3. Seoung Wook Jun , Min-Soo Kim , Jeong-Soo Kim , Hee Jun Park , Sibeum Lee, Jong Soo Woo Sung-Joo Hwang Preparation and characterization simvastatin/hydroxypropyl-b-cyclodextrin inclusion complex using supercritical antisolvent (SAS) process European Journal of Pharmaceutics and Biopharmaceutics. 2007;66(3):413–421.
4. Zhiwen Zhanga, Huihui Bua, Zhiwei Gaoa, Yan Huanga, Fang Gaoa, Yaping Li 2010 The characteristics and mechanism of simvastatin loaded lipid nanoparticles to increase oral bioavailability in rats International Journal of Pharmaceutics 2010;394(1-2):147- 153.
5. Galichet LY. Clarke’s Analysis of Drugs and Poisons. 3rd ed. Pharmaceutical Press September 2004;4(2):121-122.
www.pharmascholars.com
110
7. Rowe RC, Sheskey PJ, Owen SC. Handbook of Pharmaceutical Excipients. 5th ed. Washington: AmericanPharmaceutical Association; 2005.
8. Patel Hitesh R., Patel Rakesh P., Patel M.M. 2009 Poloxamers: A pharmaceutical excipients with therapeutic behaviours Journal of Pharm Tech Research. June 2009;1(2):299-303.
9. AnjaliKushwaha Solid dispersion – A promising novel approach for improving the solubility of poorly soluble drugs PHARMATUTOR-ART-1085. http://www.pharmatutor.org/articles/solid-dispersion%E2%80%93a-promising-novel- approach-for-improving-the-solubility-of-poorly-soluble-drugs
10. Sharma Ritesh N., Pancholi Shyam Sunder 2011 Optimization techniques in pharmaceutical industry: A Review J Current Pharmaceutical Research. 2011;7(1): 21-28.
11. Manjil Patel, Avinash Tekade, Surendra Gattani, and Sanjay Surana etal. 2008 Solubility Enhancement of Lovastatin by Modified Locust Bean Gum Using Solid Dispersion Techniques AAPS PharmSciTech. 2008 Dec;9(4):1262-1269.