Vol. 1 Issue 3 February 2013 106 ISSN: 2319-6319
Use of Analytical Network Process (ANP)
Decision Tool in Environmental Conscious
Manufacturing (ECM)
Dr. B. K. Roy Director-Principal
OM Institute of Technology and Management, Hisar, Haryana.
Abstract - Today the increasing industrialization creates huge pressure on environment and due to this industrialization many environmental related problems arises daily. The global warming, air, water and noise pollution, ozone layer depletion are some of the major problems. With the global awareness of environmental risk as well as market pressure to get maximum benefits, manufacturing system requires new development and Environmental Conscious Manufacturing (ECM) is the only solution for these problems. Multinational and domestic corporations all around the world are adopting environmental manufacturing. The Analytic Network Process (ANP) is a more general form of the Analytic Hierarchy Process (AHP) used in multi-criteria decision analysis. AHP structures a decision problem into a hierarchy with a goal, decision criteria, and alternatives, while the ANP structures it as a network. Both then use a system of pairwise comparisons to measure the weights of the components of the structure, and finally to rank the alternatives in the decision. ECM is also known as Green Manufacturing.
Keywords: ANP software, Environmentally Conscious Manufacturing (ECM) parameters, Various decision tools, Planning and control, etc.
I. INTRODUCTION
Environmental Conscious Manufacturing (ECM) is a new way of thinking about manufacturing which focuses on the most efficient and productive use of raw materials and natural resources, and minimizes the adverse impacts on workers and the natural environment. In its most advanced form, a product’s entire life cycle is considered, from design, raw material and natural resource use to end use and disposal. In order to reach this goal, tools like Life Cycle Analysis (LCA) may be used. Concepts like pollution prevention, energy efficiency, material substitution and maximization of recycled content guide the process. Environmentally Conscious Manufacturing is also known by plethora of different names: Clean manufacturing, Green Manufacturing, environmentally benign manufacturing, environmentally responsible manufacturing and Sustainable manufacturing. Irrespective of the various acronyms, the primary goal remains the same—designing and delivering products that minimize negative effects on the environment through their production, use, and disposal. There are many interpretations of green manufacturing and all convey similar meaning.
Manufacturing plays a very strategic role in an organization, especially to build competitive advantage and improve performance. With rapid changes in technology, customer needs and globalization, manufacturing itself is constantly transforming and evolving. The change in manufacturing philosophies with time can be understood from the figure.
Recent volatility in the rice of fossil fuels and global awareness about the finite nature of our resources is creating the need for a more sustainable way of how we produce and use. Therefore the focus is now on Green Manufacturing (Environment Conscious Manufacturing).
Vol. 1 Issue 3 February 2013 107 ISSN: 2319-6319 II. SELECTIONOFTOOL
The Analytical Network Process (ANP) is selected here for solving the present problem. The ANP is used because there is interdependency between the factors and to make the necessary computation. As there is number of factors on which environment conscious manufacturing depends and it is very confusing to select or priorities them depending upon some criteria and to also it takes lots of time to find out correct priority without any using any tool so ANP is used here to solve the present problem. The process and method to priorities the factors is discussed in the next part of the study.
III. FACTORSDESCRIPTION
Vol. 1 Issue 3 February 2013 108 ISSN: 2319-6319
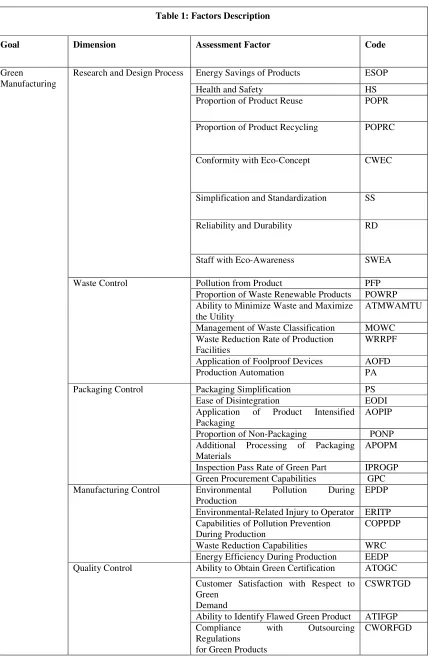
Table 1: Factors Description
Goal Dimension Assessment Factor Code
Green
Manufacturing
Research and Design Process Energy Savings of Products ESOP
Health and Safety HS
Proportion of Product Reuse POPR
Proportion of Product Recycling POPRC
Conformity with Eco-Concept CWEC
Simplification and Standardization SS
Reliability and Durability RD
Staff with Eco-Awareness SWEA
Waste Control Pollution from Product PFP
Proportion of Waste Renewable Products POWRP Ability to Minimize Waste and Maximize
the Utility
ATMWAMTU Management of Waste Classification MOWC Waste Reduction Rate of Production
Facilities
WRRPF Application of Foolproof Devices AOFD
Production Automation PA
Packaging Control Packaging Simplification PS
Ease of Disintegration EODI
Application of Product Intensified Packaging
AOPIP Proportion of Non-Packaging PONP Additional Processing of Packaging
Materials
APOPM Inspection Pass Rate of Green Part IPROGP Green Procurement Capabilities GPC Manufacturing Control Environmental Pollution During
Production
EPDP Environmental-Related Injury to Operator ERITP Capabilities of Pollution Prevention
During Production
COPPDP Waste Reduction Capabilities WRC Energy Efficiency During Production EEDP Quality Control Ability to Obtain Green Certification ATOGC
Customer Satisfaction with Respect to Green
Demand
CSWRTGD
Ability to Identify Flawed Green Product ATIFGP Compliance with Outsourcing
Regulations for Green Products
Vol. 1 Issue 3 February 2013 109 ISSN: 2319-6319 IV. MODELDEVELOPMENT/DESCRIPTION
For developing the ANP model first of all we should have some know goal which we want to achieve and over aim here is environmental conscious manufacturing evaluation and second thing we have to know is the factors on which the aim depends so here a total of 31 factors are selected for ECM evaluation and these factors are categories into five main categories. Now after getting all these useful information we use the ANP software and develop the basic model. The Figure 2 below shows the basic ANP model which is developed and all the computation work is done based on this ANP model. The development of model helps to understand the work and to progress the study. In the model there are basically three levels top, middle and bottom.
In the hierarchy of the model aim (environment conscious manufacturing) is situated at top of the model and in the hierarchy of the model middle level consists of dimensions on which the aim depends and these are research and design process, waste control, packaging control, manufacturing control and quality control. After that at last or at bottom level of the model different factors on which major dimension depends are shown or it is the base of the model on which the whole ECM process depends. In the AHP model the process stars from bottom to top that is in AHP the importance of bottom factor decides the importance of top factor on which it depends.
V. COMPUTATIONWORKANDRESULTSYNTHESIS
Now after developing the model with the help of software different computation work is done to synthesis the result. It consists of following step.
VI. DATAINPUT
Vol. 1 Issue 3 February 2013 110 ISSN: 2319-6319 This comparison is done for all the 31 factors depending upon the effect of these factors on ECM and this comparison is basically based on these questionnaires.
Vol. 1 Issue 3 February 2013 111 ISSN: 2319-6319 The numerical value is used to rank the factor and this should be done based on some scientific approach that is the value should satisfy the relation. If the relative importance in the questionnaire is done without thinking this will make error in the computation work and consistency is not achieved. Then this inconsistency is to be removed to synthesis the result and this removal is done by changing the numerical values in the questionnaire so its better to do the work right at first time rather than increasing it at later stage
VII. RESULT
As it is well known that different factors possess different priorities with relation to the environmental conscious manufacturing so in order to have a wider reach over them, the priorities are easily predicted using the super decisions software. The inputs to the priorities are filled by various questionnaire prepared during our course of study. Their inconsistency index is also mentioned in the fig with desired value. This priority table help the researchers to judge the relative importance between all these factors and based on the judgment the d e cisio n is m a d e f o r e n viro n m e n t a l manufacturing. The priority defer from category to category as the expectation/desires differs from person to person, category to category therefore the priorities for the different categories are discussed below one by one. Also the priority for entire group/model is discussed.
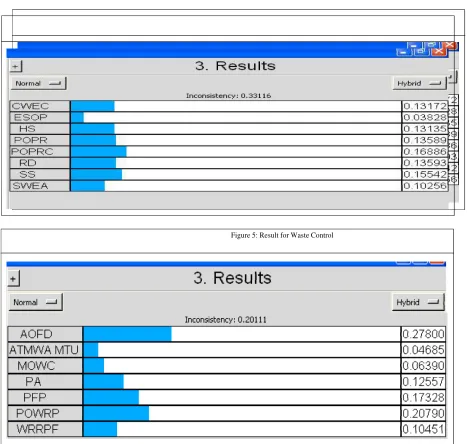
7.1 Result/Priority for Research and Design Process
The result for the research and design process is shown in the Figure 4 shown below and it is observe from the result that Proportion of Product Recycling (POPRC) is most important factor among this cluster and Simplification and Standardization (SS) is second most important factor while Energy Savings of Products (ESOP) is least importance factor among the research and design processes.
7.2 Result/Priority for Waste Control
Vol. 1 Issue 3 February 2013 112 ISSN: 2319-6319 Figure 4: Result for Research and Design Process
Figure 5: Result for Waste Control
most important factor in this category and than Proportion of Waste Renewable Products (POWRP) is second most important factor while Ability to Minimize Waste and Maximize the Utility (ATMWA MTU) is least important as at this stage the product is manufactured and it is tough to reduce its impact on the environment. Also the importance for other factor can be easily calculated from the result and these factors can also be ranked accordingly.
7.3 Result/Priority for Packaging Control
Vol. 1 Issue 3 February 2013 113 ISSN: 2319-6319 7.4 Result/Priority for Manufacturing Control
The result for manufacturing control is shown in the Figure 7 and it is seen here that Energy Efficiency During Production (EEDP) and waste reduction capabilities (WRC) is most important factor and all other factor are having almost equal importance.
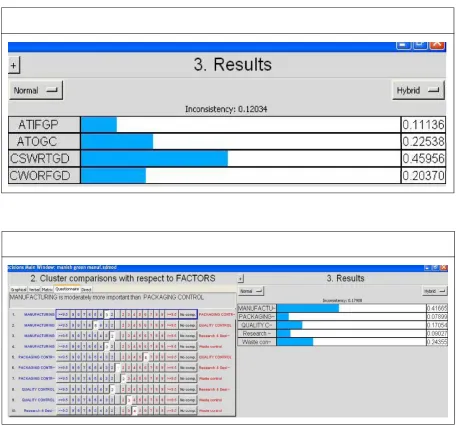
7.5 Result/Priority for Quality Control
Vol. 1 Issue 3 February 2013 114 ISSN: 2319-6319 Satisfaction With Respect to Green Demand (CSWRTGD) is most important factor here and all other factors are almost equally important.
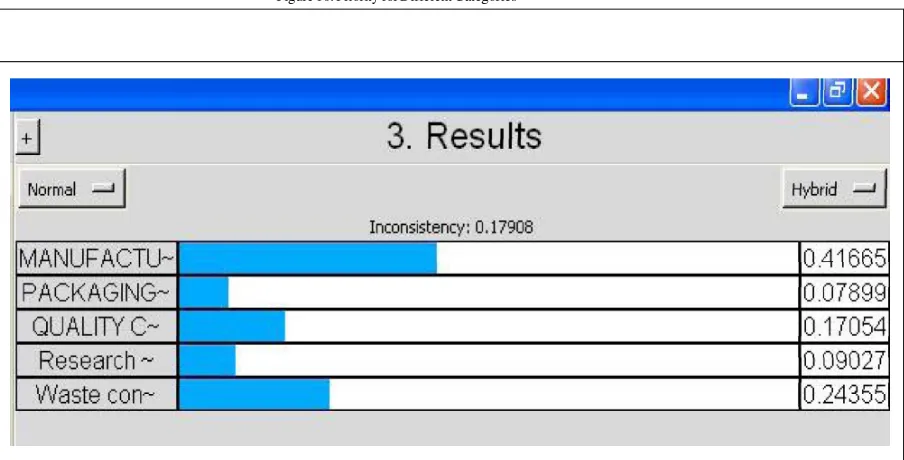
7.6 Result/Priority for Entire Model
The result for the entire model can be measured based upon the priority of all the factors and it is shown in the Figure 9 and the priority of the entire category can be judged from the figure.
Vol. 1 Issue 3 February 2013 115 ISSN: 2319-6319
Category Rank Percentage
Improtance
Manufacturing Control 1 41.66% Waste
Control 2 24.35%
Quality Control 3 17.05%
Research and Design Process 4 09.02%
Packaging Control 5 07.89 %
VIII. CONCLUSION
Based on considerable data from ECM practices and feasible industrial methods, while incorporating comments from experts in relevant fields, this work here developed assessment model and evaluate factors, followed by a calculation the weights of evaluating factors via ANP. Finally, the model is used for extracting successful factors of implementing ECM in any organizational system. Based on the results of this study, the following conclusion points can be drawn:
The proposed model contains 5 strategic factors, i.e., research and design process, waste control , packaging control ,manufacturing control, and quality control and 31 assessment factors/sub factors.
Vol. 1 Issue 3 February 2013 116 ISSN: 2319-6319 For strategic subjects, based on evidential analysis, the importance of assessment factors from each category can be seen judged from the result and the relative importance for five main categories can be judged from the Figure 10 shown below.
It is observed that Manufacturing Control process plays most important role for environment conscious manufacturing and then Waste Control comes next in the priority while quality control and Research and Design Process comes next in hierarchy and Packaging Control is least important among the factors selected.
REFERENCES
[1] Ahmed M Dief (2011), “Industrial System Engineering-University of Regina A System Model for Green Manufacturing”.
[2] Baoju H and Jian L (2011), “Virtual Green Manufacturing and its Application in Manufacturing”, International Conference on Advanced Manufacturing Technology New Requirements to China’s Manufacturing, Vol. 11, No. 5, June, pp. 244-248.
[3] Gencer C and Gurpinar D (2006), “Analytic Network Process in Supplier Selection: A Case Study in an Electronic Firm, Applicable Math Model, Vol. 31, No. 11, May, pp. 2475-2486.
[4] Liang D H (2012), “Cloud Computing and Green Management”, International Conference on Intelligent System Design and Engineering Application, Vol. 7, January 6-7, pp. 639-642
[5] Manish Bansal (2012), “Research Paper on Green Manufacturing and Use of Analytical Network Process (ANP) Decision Tool in Green Manufacturing”, Vol. 1, No. 3, October, ISSN 2278-0149, www.ijmerr.com
[6] Zh a n g Y (2 0 1 0 ), “Re se a rc h o n Development & Application of Information Resources of Green Manufacturing Enterprise”, International Conference on Information Management, Innovation Management and Industrial Engineering, Vol. 3, March, pp. 130-134.
[7] Zhongling Z and Xiwen F (2010), “The Re se a rch a n d P ra ct ice o f G re e n Production and Recycling Economy in Gold Mine Enterprise”, International Conference on Information Management and Engineering, Vol. 5, April 16-18, pp. 518-522.