e-ISSN: 2278-067X, p-ISSN: 2278-800X, www.ijerd.com Volume 6, Issue 12 (May 2013), PP. 71-79
Modal Based Analysis and Evaluation of Voltage Stability
of Bulk Power System
Dr. Enemuoh F. O., Dr. Onuegbu J. C. and Dr. Anazia E. A.
Department of Electrical Engineering Nnamdi Azikiwe University, Awka, Nigeria.
Abstract:- This paper reports on Modal based analysis and its application in the evaluation of voltage stability of bulk power system. This method makes use of the power system Jacobian matrix to determine the eigenvalues necessary for the evaluation of the voltage stability of the power system. It identifies if the eigenvalues are positive or negative which is an indicator of the system stability. For a steady state power system, a positive eigenvalue shows that the system is stable while a negative eigenvalue indicates that the system is instable. The least eigenvalue indicates the proximity of the system to voltage instability. This method was used to determine the components of the system that contribute to instability through the use of the participating factors. The method was implemented on IEEE 14 bus system and it calculated the various eigenvalues with the least value used to calculate the participation factors that indicated the generator, branches and buses that will contribute most to the bulk system voltage instability.
Keywords:- Modal, voltage stability, eigenvalue, participation factors.
I. INTRODUCTION
Voltage stability issues are of major concern worldwide because of the significant number of black-outs that have occurred in recent times in which it was involved [1]. For many power systems, assessment of voltage stability and prediction of voltage instability or collapse have become the most important types of analysis performed as part of system planning, operational planning and real-time operation. It is important to have an analytical method to investigate voltage stability in the power system, particularly with a complex and large interconnected network. The work presented in this paper used modal analysis to evaluate the voltage stability of a bulk power system It involves the calculation of a small number of eigenvalues of the reduced Jacobian matrix obtained from the load flow solution. In the past, the electric utility industry has largely depended on conventional power-flow programs for static analysis of voltage stability. Stability is determined by computing the V-P and V-Q curves at selected load buses. Generally, such curves are generated by executing a large number of power flows using conventional models. While such procedure can be automated, they are time –consuming and do not readily provide information useful in gaining insight into causes of stability problems. In addition, these procedures focus on individual buses, that is, the stability characteristics are established by stressing each bus independently. This may unrealistically distort the stability condition of the system. Also, the buses selected for V-Q and V-P analysis must be chosen carefully, and a large number of such curves may be required to obtain complete information. In fact, it may not be possible to generate the V-Q curves completely due to power-flow divergence caused by problems elsewhere in the system.
A number of special techniques have been proposed in the literature for voltage stability analysis [2, 3, 4]. Generally, many of these have not found widespread practical application. A practical approaches based modal analysis has advantage that it gives voltage stability related information from a system wide perspective and clearly identifies areas that have potential problems. It has the added advantage that it provides information regarding the mechanism of instability. This is the principal reason for considering the modal analysis. The understanding of modal analysis starts with the formulation of power flow problem.
II. POWER FLOW PROBLEM
That is because they allow all other system quantities to be computed such as real and reactive power flows, current flows, voltage drops, power losses, etc … power flow solution is closely associated with voltage stability analysis. It is an essential tool for voltage stability evaluation. Much of the research on voltage stability deals with the power-flow computation method.
The power flow problem solves the complex matrix equation:
)
1
(
V
S
YV
I
whereI = nodal current injection matrix Y = system nodal admittance matrix V = unknown complex node voltage vector
S = apparent power nodal injection vector representing specified load and generation of nodes Where
S
P
jQ
(
2
)
The Newton-Raphson method is the most general and reliable algorithm to solve the power-flow problem. It involves interactions based on successive linearization using the first term of Taylor expansion of the equation to be solved. From equation (1), we can write the equation for node k (bus k) as:
)
3
(
1
n m m km kY
V
I
)
4
(
* 1 * * m n m km k k k kk
jQ
V
I
V
Y
V
P
Where:m = 1, 2, …, n n = number of buses
Vk is the voltage of the kth bus
Ykm is the element of the admittance bus
Equating the real and imaginary parts
)
5
(
1 * *
n m k km k ek
R
V
Y
V
P
)
6
(
1 * *
n m k km k mk
I
V
Y
V
Q
Where
Pk is the real power
Qk is the reactive power
With the following notation:
)
7
(
,
,
m kmk j km km j m m j k
k
V
e
V
V
e
Y
Y
e
V
Where
k
V
is the magnitude of the voltagek
is the angle of the voltagekm
is the load angleSubstituting for Vk, Vm, and Ykm in Equation (4)
n m j km j k j k k k k m kk
V
e
Y
e
n m km k k km k k kk
jQ
V
V
Y
P
1
Or
)
sin
(cos
1 km m k km m k n m km k k K kj
Y
V
V
jQ
P
Separating the real and imaginary parts of above equation to get real and reactive powers,
(
8
)
cos
1 km m k n m km k kk
V
V
Y
P
(
9
)
sin
1 km m k n m km k kk
V
V
Y
Q
The mismatch power at bus k is given by:
)
10
(
k sch kk
p
p
P
)
11
(
k sch kk
Q
Q
Q
The Pk and Qk are calculated from Equation (8) and (9)
The Newton – Raphson method solves the partitioned matrix equation:
)
12
(
V
J
Q
P
Where,ΔP and ΔQ = mismatch active and reactive power vectors.
ΔV and ΔӨ = unknown voltage magnitude and angle correction vectors. J = Jacobian matrix of partial derivative terms
III. MODAL ANALYSIS
The Modal analysis mainly depends on the power-flow Jacobian matrix of equation (12). Gao, Morison and Kundur [8] proposed this method in 1992. It can predict voltage collapse in complex power system networks. It involves mainly the computing of the smallest eigenvalues and associated eigenvectors of the reduced Jacobian matrix obtained from the load flow solution. The eigenvalues are associated with a mode of voltage and reactive power variation which can provide a relative measure of proximity to voltage instability. Then, the participation factor can be used effectively to find out the weakest nodes or buses in the system. The analysis is expressed as follows:
Equation (12) can be rewritten as:
)
13
(
22 21 12 11
V
J
J
J
J
Q
P
By letting
P
0
in Equation (13),
0
J
11J
12V
P
J
J
12
V
1 11
(14) andV
J
J
Q
21
22 (15) Substituting Equation (14) in Equation (15):)
16
(
V
J
Q
R
Where
12
1 11 21
22
J
J
J
J
J
R
R
J
is the reduced Jacobian matrix of the system. Equation (16) can be written as)
17
(
1Q
J
V
R
as well as minimize computational effort by reducing dimensions of the Jacobian matrix J the real power (ΔP = o) and angle part from the system in Equation (13) are eliminated.
The eigenvalues and eigenvectors of the reduced order Jacobian matrix JR are used for the voltage stability
characteristics analysis. Voltage instability can be detected by identifying modes of the eigenvalues matrix JR.
The magnitude of the eigenvalues provides a relative measure of proximity to instability. The eigenvectors on the other hand present information related to the mechanism of loss of voltage stability.
Modal analysis of JR results in the following.
)
18
(
RJ
where Ф = right eigenvector matrix ofJ
R
= left eigenvector matrix ofJ
R
= diagonal eigenvalue matrix ofJ
REquation (18) can be written as:
)
19
(
1
1
RJ
In general it can be said that, a system is voltage stable if the eigenvalues of JR are all positive. This is
different from dynamic systems where eigenvalues with negative real parts are stable. The relationship between system voltage stability and eigenvalues of the JR matrix is best understood by relating the eigenvalues with the
V-Q. sensitivities of each bus (which must be positive for stability). JR can be taken as a symmetric matrix and
therefore the eigenvalues of JR are close to being purely real. If all the eigenvalues are positive, JR is positive
definite and the V-Q sensitivities are also positive, indicating that the system is voltage stable.
The system is considered voltage unstable if at least one of the eigenvalues is negative. A zero eigenvalue of JR
means that the system is on the verge of voltage instability. Furthermore, small eigenvalue of JR determine the
proximity of the system to being voltage unstable [9].
There is no need to evaluate all the eigenvalues of JR of a large power system because it is known that
once the minimum eigenvalues becomes zeros the system Jacobian matrix becomes singular and voltage instability occurs. So the eigenvalues of importance are the critical eigenvalues of the reduced Jacobian matrix JR. Thus, the smallest eigenvalues of JR are taken to be the least stable modes of the system. The rest of the
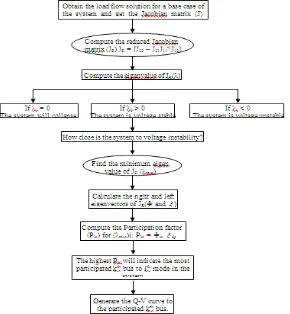
eigenvalues are neglected because they are considered to be strong enough modes. Once the minimum eigenvalues and the corresponding left and right eigenvectors have been calculated the participation factor can be used to identify the weakest node or bus in the system. An algorithm for the modal method analysis used in this study is shown in figure1.
The appropriate definition and determination as to which node or load bus participates in the selected modes become very important. This necessitates a tool, called the participation factor, for identifying the weakest nodes or load buses that are making significant contribution to the selected modes [10].
(
20
)
i i i i
Q
V
where
i is the ίth eigenvalue,
i is the ίth column right eigenvector and
i is the ίth row left eigenvector of matrixR
J
. Each eigenvalue
i and corresponding right and left eigenvectors
i and
i, defined the ί thmode of the system.
IV. IDENTIFICATION OF THE WEAK LOAD BUSES
The minimum eigenvalues, which become close to instability, need to be observed more closely. parts are stable. The relationship between system voltage stability and eigenvalues of the JR matrix is best understood
by relating the eigenvalues with the V-Q. sensitivities of each bus (which must be positive for stability). JR can
be taken as a symmetric matrix and therefore the eigenvalues of JR are close to being purely real. If all the
eigenvalues are positive, JR is positive definite and the V-Q sensitivities
V. SAMPLE SYSTEM EVALUATION AND RESULTS ANALYSIS
The modal analysis method has been successfully applied to IEEE 14 bus power system shown in Figure 2, while Tables 1 and 2 are the line and load parameters respectively. A power flow program based on Matlab is developed to:
1. Calculate the power flow solution
The voltage profile of the buses is presented from the load flow simulation as shown in Figure 3. It can be seen that all the bus voltages are within the acceptable level (± 5%). The lowest voltage compared to the other buses can be noticed in bus number 3
Since there are 14 buses among which there is one swing bus and 4 PV buses, then the total number of eigenvalues of the reduced Jacobian matrix
J
R is expected to be 9 as shown in Table 3.Table 1 Line data for IEEE 14 Bus system (Length 1km)
Table 2 Load Distribution for IEEE 14 Bus System
Table 3 IEEE 14 Bus System Eigenvalues
ID Name R(1) X(1) C(1) B(0)
Ohm/… Ohm/… uF/… Us/…
1. 421 Branch-3 2.237193 9.425351 2.92837 919.975
2. 424 Branch-2 2.572368 10.61893 3.289402 1033.396
3. 427 Branch-1 0.922681 2.817083 3.53009 1109.01
4. 430 Branch-7 0.635593 2.004857 0.855779 268.851
5. 433 Branch-6 3.190346 8.142738 2.313279 726.738
6. 436 Branch-5 2.711389 8.278426 2.273164 714.136
7. 439 Branch-4 2.766617 8.394595 2.50048 785.549
8. 442 Branch-13 0.125976 0.248086 0 0
9. 445 Branch-12 0.234069 0.487164 0 0
10. 448 Branch-11 0.180879 0.378785 0 0
11. 451 Branch-19 0.42072 0.380651 0 0
12. 454 Branch-18 0.156256 0.365778 0 0
13. 457 Branch-17 0.242068 0.514911 0 0
14. 460 Branch-16 0.060578 0.160921 0 0
15. 463 Branch-15 0 0.209503 0 0
16. 466 Branch-20 0.325519 0.662769 0 0
ID Name LF Type
P MW
Q MVAR
1. 686 Load 2 PQ 21.7 12.7
2. 687 Load 6 PQ 11.2 7.5
3. 688 Load 5 PQ 7.6 1.6
4. 689 Load 4 PQ 47.8 4
5. 690 Load 3 PQ 94.2 19
6. 691 Load 11 PQ 3.5 1.8
7. 692 Load 10 PQ 9 5.8
8. 693 Load 9 PQ 29.5 16.6
9. 694 Load 7 PQ 0 0
10. 695 Load 14 PQ 14.9 5
11. 696 Load 13 PQ 13.5 5.8
12. 697 Load 12 PQ 6.1 1.6
1 2 3 4
Eigenvalue 2.0792 5.3677 7.5987 9.4942
# 5 6 7 8
Eigenvalue 16.0985 18.8474 19.3553 38.5332
# 9
Figure 1.0 Line diagram of the IEEE 14 Bus interconnected network
VI. CONCLUSION
The results of the analysis of the 14 Bus system are shown in the bar charts below.
Figure 3.0 Voltage profiles of all Buses of the IEEE 14 Bus system
From Table 3, it can be notices that the minimum eigenvalue λ = 2.0792 is the most critical mode. The Q-V Sensitivity is calculated to determine the most critical bus. The simulation showed that bus 14 is the most critical with sensitivity of 0.222725 as shown in Figure 4.
Figure 4.0 Q-V Sensitivity of IEEE 14 Bus system
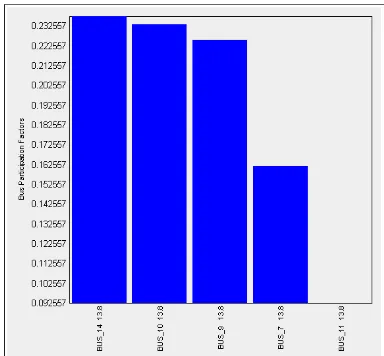
The bus participation factor was calculated; the result showed that bus 14 had the highest bus participation factor of 0.232557 at the least eigenvalue λ = 2.0792 as shown in Fig. 5.
Figure 5.0 Highest contribution to voltage collapse
0 5 10 15
0 0.2 0.4 0.6 0.8 1 1.2 1.4
Bus number
V
o
lt
a
g
e
[
p
.u
]
The branch participation factors was calculated, the result showed that branch 10 has the highest branch participation factor of 0.968457 at the least eigenvalue λ = 2.0792 as shown in Figure 6. It indicates the highest contribution of this branch to the voltage collapse.
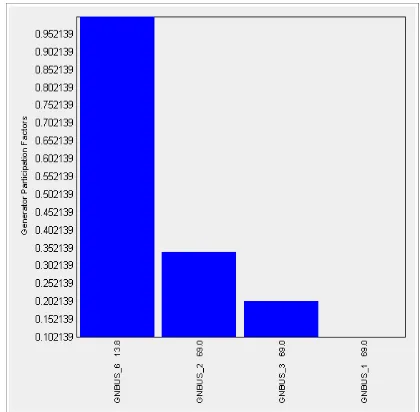
The generator participation factors was calculated, the result showed that Gnbus 6 has the highest generator participation factor of 0.952139 at the least eigenvalue λ = 2.0792 as shown in Figure 7, it indicates the highest contribution of this generator to the voltage collapse.
Figure 6 The branch Participation Factors for Least Eigenvalue λ = 2.0792
Figure 7 Generator Participation Factors at least Eigenvalue of λ = 2.0792
REFERENCES
[1]. S. Johnsson, and F. Sjogreen, “Voltage Collapse in Power Systems; The influence of generator current limiters, on-load tap changers and dynamics,” Thesis, Chalmers University of Technology, Gotenbery, Sweden, 1995, ISBN:91-7197-119-K.
[2]. IEEE Working Group on Voltage Stability, “Suggested techniques for voltage stability analysis”, IEEE Publications 1993.
[3]. IEEE Working Group on voltage stability, “Voltage Stability of power system: Concepts, Analytical tools and industrial experience”, IEEE Publications 90THO358-2-PWR1990.
[4]. IEEE/PES publications on “Voltage Stability Assessment: Concepts, Practices, and tools”, IEEE/PES publications. Final Draft August 2002.
[5]. P.A Lof, T. Smed, C. Anderson and D.J.Hill, “ Fast Calculation of a Voltage Stability Index,” IEEE Trans. on Power Systems, Vol.7, pp59-64, Feb.1992.
[7]. B. Gao, G.Morison and P. Kundur, “Voltage Stability Evaluation Using Modal Analysis”, IEEE Trans. On Power Systems, Vol.7, No.4, pp. 1423-1543, Nov. 1992.
[8]. G. Verghes, I. Perez-Arriaga and F.Schwwppe, “Selective modal Analysis with Application to Electric Power Systems”, Part 11 IEEE trans, on Power App. and system, Vol. PAS 101, No. 9, pp 3117-3134, 1982
[9]. V. Ajjarapu, and B. Lee “Bibliograph on voltage Stability” IEEE Trans. on Power Systems, vol. 13 pp 115- 125, 1998.
Authors’ Profile
Dr. Francis O. Enemuoh
Received the M.Eng. and Ph.D degree in electrical engineering in 1995 and 2012 from Enugu State University of Science and Technology and University of Nigeria Nsukka respectively. He has been employed by Nnamdi Azikiwe University Awka since 1996. Currently, he is the Head, department of electrical engineering in the University. His research interest is in the area of power system stability, security and reliability. Dr. Enemuoh is a member of Nigeria Society of Engineers and a registered engineer with Council for the Regulation of Engineering in Nigeria (COREN). Email: [email protected]
Dr. Josiah C. Onuegbu
Born in Anambra State of Nigeria on 24th February, 1966. Received his M. Eng. degree in electrical engineering in the field of electric power stations and substations from Kyrghyz Technical University Bishkek (Frunze) USSR in 1994, then Ph.D degree in the field of electric machines from Nnamdi Azikiwe University, Awka, Nigeria in 2012 The author’s major field of study is electric machine design. He joined Nnamdi Azikiwe University, Awka in 1999 as a lecturer. He has published many journal articles and an engineering novel.
Dr. Onuegbu is a member of five professional bodies including the Nigeria Society of Engineers and Council for the Regulation of Engineering in Nigeria. He has worked in various capacities in the faculty including being the examination committee chairman for many years. Email: [email protected]
Dr. Emmanuel A. Anazia