e-ISSN: 2278-067X, p-ISSN: 2278-800X, www.ijerd.com Volume 7, Issue 10 (July 2013), PP. 86-94
Electron Density Profiles In Metallic Surfaces
Olubosede. O
Physics Department Adekunle Ajasin University Akungba-Akoko Ondo State, Nigeria.
Abstract:- This paper takes a look at the properties of electron density profiles at the metal surfaces; this was done by calculating the properties in the bulk, at the surface and just outside the metal surface using the equations proposed by Kiejna and Wojciechowski. The results obtained shows that; in the bulk of metals, electron density profile depends inversely on the concentration of the electrons and also on the binding energy of the metal as binding energy per electron exhibit the same trend. It decays and saturates exponentially towards the bulk.
Keyword:
Electron density profile, metallic surfaces.
I. INTRODUCTION AND METHODOLOGY
A positive charge of density
( )
r
is superimposed on an electron gas of concentrationn e
0 where e is the electronic charge, the positive charge will give rise to an electrostatic potential
( )
r
. IfV r
( )
is the potential established as a result of the movement of the charge density, then the totalU r
( )
is)
1
(
)
(
)
(
)
(
r
r
V
r
U
This is connected with one electron wave function the sum over take the psi to right place occupied states
)
2
(
)
(
)
(
)
(
1 *r
r
r
n
i i i
The function
i satisfy one-electron Schrödinger wave equation
H
i
i
i(
3
)
with the Hamiltonian;
(
)
(
4
)
2
1
2r
V
H
since
3
(
)
(
5
)
10
3
353 2 2
r
n
n
t
s
s
t n
is the kinetic energy whileV r
( )
is the potential energy with which the electron moves. The total kinetic energy is given by
3
(
)
(
6
)
10
3
353 2 2
0
t
n
dr
n
r
dr
T
s
denotes that
t
s is a functional ofn r
( )
.V r
e( )
andV r
a( )
are the coulomb’s repulsive potential energy and the external ionic potential energy respectively.)
7
(
)
(
' 'dr
r
r
r
n
V
e
thus the total energy expressed in terms of electron density is given by;
3
(
)
(
8
)
10
3
)
(
)
(
2
1
)
(
)
(
3 5 3 2 2 ' ' 'dr
r
n
drdr
r
r
r
n
r
n
dr
r
V
r
n
n
E
a
it should be noted that the total electron number is the same in this condition i.e.
n r dr
( )
N
The ground state density n(r) can be determined variationally and the variation calculation gives the Euler
E n r
( )
n r dr
( )
and replacing the langrangian multiplier
in the above equation gives;
3
(
9
)
2
1
)
(
)
(
3 2 2 ' ' 'r
n
dr
r
r
r
n
r
V
a
where
E n
dn
which is the chemical potential and
3
0
(
10
)
2
1
)
(
)
(
3 2 2 ' ' '
dr
r
r
r
n
r
V
aThe total electrostatic potential is;
' ' '
( )
( )
r
V r
a( )
n r
dr
r
r
replacing this in (1) gives
3
(
)
(
11
)
2
1
)
(
3 2 3 2 2
r
n
r
Making n(r) the subject of formula gives
2
(
(
)
(
12
)
3
1
)
(
2 3 2r
r
n
this is the Thomas-Fermi equation which when in the semi infinite methods takes the form;
2
(
(
)
(
13
)
3
1
)
(
2 3 2r
x
n
The electrostatic potential obeys Poisson’s equation
)
14
(
)
(
)
(
4
2 ) ( 2
n
x
n
x
dx
d
x
hence,
3
(
)
(
15
)
2
1
2 3 2 ) (
X
n
x
Using the Poisson equation (15) gives
)
16
(
)
(
)
(
)
(
4
)
(
)
(
)
3
(
2
1
322 3 2 2 3 2 3 2 2
x
dn
x
n
x
n
dx
x
dn
d
dx
x
dn
Integrating for x less than zero which is the boundary condition inside the positive background
n x
( )
n
and( )
0
dn x
dx
. For,x
,)
17
(
5
3
)
(
)
(
5
2
4
)
(
)
3
(
4
1
35 32 352 3 2 3 2 2
n
x
nn
x
n
dx
x
dn
)
18
(
)
(
5
8
)
(
)
3
(
4
1
352 2 3 2 3 2 2
x
n
dx
x
dn
and for
X
0
we obtain;)
19
(
5
3
)
0
(
3 2 3 2
n
n
TFx
x
andn
n
n
where
TF is the Thomas-Fermi screening length)
20
(
4
2 1
o F TFa
K
x
)
21
(
3
1
2 1 o s TF TFa
r
K
2 0 2a
me
0.52106
In the bulk, at
X
the solution to the equation now becomes:-)
22
(
621
.
0
1
)
(
) (
TF xx
n
x
n
V
At the surface
X
0
)
23
(
000535743
.
0
0265357
.
0
503006
.
0
)
(
r
sr
sr
sV
Away from the jellium surface X>0
)
24
(
27000
6 ) (
x
a
V
TF
x
Necessary equations derived in this chapter were used to compute different electronic properties of metallic surfaces.
II. RESULTS AND DISCUSSION
has high electronic density concentration. This may be due to the fact that the same group exhibit similar electronic properties as their surfaces.
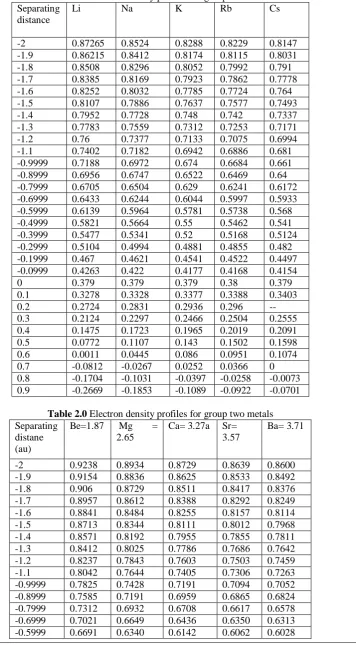
Table 1.0 Electron density profiles for group one metals Separating
distance
Li Na K Rb Cs
-2 0.87265 0.8524 0.8288 0.8229 0.8147 -1.9 0.86215 0.8412 0.8174 0.8115 0.8031 -1.8 0.8508 0.8296 0.8052 0.7992 0.791 -1.7 0.8385 0.8169 0.7923 0.7862 0.7778 -1.6 0.8252 0.8032 0.7785 0.7724 0.764 -1.5 0.8107 0.7886 0.7637 0.7577 0.7493 -1.4 0.7952 0.7728 0.748 0.742 0.7337 -1.3 0.7783 0.7559 0.7312 0.7253 0.7171 -1.2 0.76 0.7377 0.7133 0.7075 0.6994 -1.1 0.7402 0.7182 0.6942 0.6886 0.681 -0.9999 0.7188 0.6972 0.674 0.6684 0.661 -0.8999 0.6956 0.6747 0.6522 0.6469 0.64 -0.7999 0.6705 0.6504 0.629 0.6241 0.6172 -0.6999 0.6433 0.6244 0.6044 0.5997 0.5933 -0.5999 0.6139 0.5964 0.5781 0.5738 0.568 -0.4999 0.5821 0.5664 0.55 0.5462 0.541 -0.3999 0.5477 0.5341 0.52 0.5168 0.5124 -0.2999 0.5104 0.4994 0.4881 0.4855 0.482 -0.1999 0.467 0.4621 0.4541 0.4522 0.4497 -0.0999 0.4263 0.422 0.4177 0.4168 0.4154 0 0.379 0.379 0.379 0.38 0.379 0.1 0.3278 0.3328 0.3377 0.3388 0.3403 0.2 0.2724 0.2831 0.2936 0.296 -- 0.3 0.2124 0.2297 0.2466 0.2504 0.2555 0.4 0.1475 0.1723 0.1965 0.2019 0.2091 0.5 0.0772 0.1107 0.143 0.1502 0.1598 0.6 0.0011 0.0445 0.086 0.0951 0.1074 0.7 -0.0812 -0.0267 0.0252 0.0366 0 0.8 -0.1704 -0.1031 -0.0397 -0.0258 -0.0073 0.9 -0.2669 -0.1853 -0.1089 -0.0922 -0.0701
Table 2.0 Electron density profiles for group two metals Separating
distane (au)
Be=1.87 Mg = 2.65
Ca= 3.27a Sr= 3.57
Ba= 3.71
-0.4999 0.6325 0.6003 0.5824 0.5752 0.5721 -0.3999 0.5912 0.5635 0.5479 0.5417 0.5390 -0.2999 0.5467 0.5233 0.5105 0.5055 0.5034 -0.1999 0.4965 0.4794 0.4701 0.4665 0.4649 -0.0999 0.4409 0.4314 0.4264 0.4244 0.4236 0 0.379 0.3789 0.3789 0.3789 0.3789 0.1 0.3103 0.3218 0.3277 0.3300 0.3309 0.2 0.234 0.2593 0.2722 0.2772 0.2792 0.3 0.1491 0.1910 0.2121 0.2201 0.2235 0.4 0.0552 0.1165 0.1471 0.1586 0.1635 0.5 -0.0493 0.0351 0.0766 0.0292 0.0988 0.6 -0.165 -0.0538 0.0004 0.0206 0.0291 0.7 -0.2943 -0.1509 -0.0822 -0.0567 -0.0460 0.8 -0.4375 -0.2569 -0.1715 -0.1400 -0.1269 0.9 -0.5965 -0.3727 -0.2682 -0.2299 -0.2140
Figure 1.0 electron density profile outside the bulk x>0 for group 2 metals
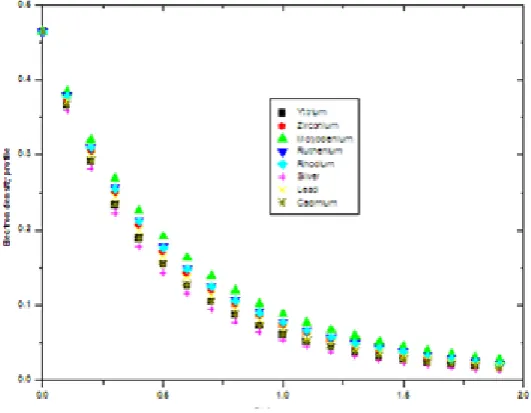
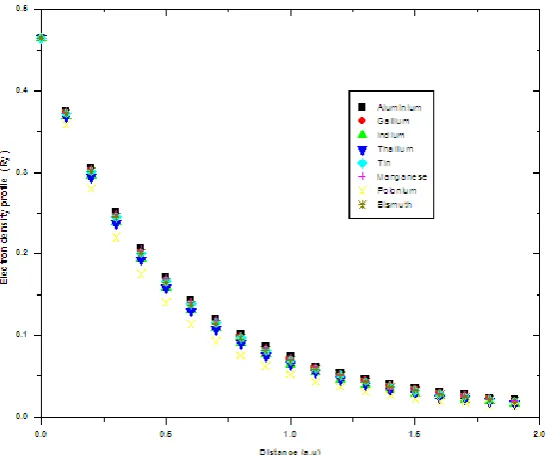
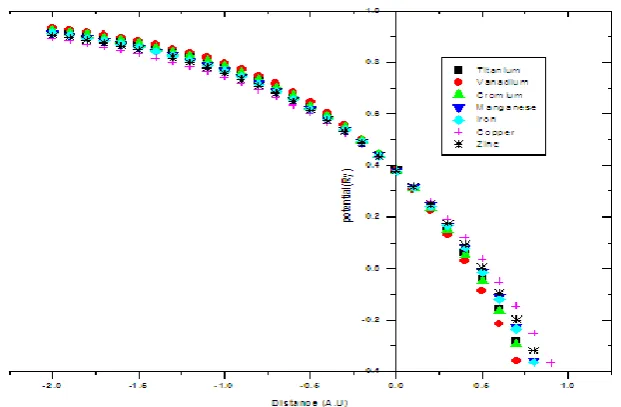
Figure 3.0 electron density profile outside the bulk x>0 for metals
Figure 4.0 electron density profile outside the bulk x>0 for metals
Figure 6.0 electron density profile inside the bulk x<0 for group 2 metals
Figure 7.0 electron density profile inside the bulk x<0 for some selected metals
Figure 9.0 electron density profile inside the bulk x<0 for some selected metals
Figure 10.0 electron density profile inside the bulk x<0 for some selected metals
REFERENCES
[1] Acioli, H.P and Ceperley, D.M (1996). Diffusion monte carlo study of jellium surfaces: Electronic densities and pair correlations, Phys. Rev B.Volume 55, number 23, Pp17199-17207.
[2] Aschcroft N.W and Mermin N.D (1976). Solid state Physics. Holt Richard and Winston.
[3] Brajczewska, M. Heriques, C and Foilhais, C. (2001). Dependence of metalsurface properties on the valence-electron density in the stabilized jellium model. Elsevier. Volume 63. Pp. 135-138.
[4] Budd, H.F. and Vannnimenus, J.(1973). Surface forces and the jellium Model.Physical Review letters.Volume31, Number 19, Pp1218-1221.
[5] Kiejna A. and K.F Wojciechowski (1996) Metal Surface Electron Physics, Elsevier Science Ltd, The Boulevard, Langford Lane, Kidington, Oxford OX5 1GB,
[6] Kittel. C (1976). Introduction to solid state physics, 5th Edition John Wiley and sons Inc. USA. Pp 3-33, 155-263.
[7] Lang N.D and Kohn.W. (1970).Theory of Metal Surface: Charge density and surface energy. Phys Rev. B Vol. 1, Number 12 , Pp 4555-4567.
[8] Lang, N.D and Kohn. W. (1971). Theory of Metal Surface: Work function. Phys.Rev. B Vol. 3, Number 4. Pp 1215-1223.
[9] Martins, R.M, (2004). Electronic Structure basic theory and practical method Chapter 1 Pages 32-35. [10] Nieminen, R.M. (1977). Interaction between metallic surfaces. Journal of Physics. F. Metal phys.
Volume 7, number 3, Pp. 375-384.
[11] Perdew, J.P., Tran, H.Q. and Smith, E.D. (1990). Stabilized jellium: Structureless pseudopotential model for the cohesive and surface properties of metals. Phys. Rev. B. Volume 42, Number 18, Pp11627-11636.
[12] Perdew, J.P and Wang, Y. (1988), Jellium work function for all electron densities. Phys. Rev. B, Volume 38. Number 17, Pp. 12228-12232.
[13] Perdew, J.P, Ziesche, P. and Foilhais, C. (1993). Formation energies of metallic voids, edges and steps: Generalized liquid-drop model. Phys. Rev. B Volume 47, Number 24. Pp. 16460 - 16463.
[14] Perdew, J.P and Zunger, A. (1981). Self-interaction correction to density- functional approximations for many-electron system. Phys. Rev. B. 23, Number 10, Pp. 5048-5067.
[15] Perrot, F and Rasolt, M. (1994). A new listing of effective
r
s values for metals. J. Phys. Condens. Matter 6 Pp 1473-1482.[16] Monnier.R, and Perdew. J.P,(1978). Surfaces of real metals by self-consistent method. Physical Review B, 17 (6), 2595-2611.
[17] Pitarke,J. M and Eguiluz, A.G (2006). Jellium surface energy beyond the local-density approximation: self-consistent-field calculations. Arxiv condensed matter 10444 Volume 1, Pp1-11, Figure 1-7. [18] Raimes, S (1961). Effect of deformation on surface characteristics of finite metallic crystals. Journal of