Research Article
CODEN: IJPNL6
DEVELOPMENT AND VALIDATION OF RP-HPLC METHOD FOR SIMULTANEOUS
ESTIMATION OF METFORMIN AND PIOGLITAZONE IN BULK AND TABLET
DOSAGE FORM
Swathi Malichetti
1*, Sujitha Hazari
1and Akki Srivani
21
Department of Pharmaceutical Analysis and Quality Assurance and
2Department of
Pharmaceutics, CMR College of Pharmacy, kandlakoya (v), Medchal road, Hyderabad – 501
401, A.P, India
*Corresponding author e-mail: [email protected]
ABSTRACT
A new precise, accurate, reliable validated method for the determination of Metformin and Pioglitazone has been developed by using reverse phase high performance liquid chromatography (RP-HPLC) in pharmaceutical dosage form. Chromatographic separation was carried out by using mobile phase 0.02M Potassium dihydrogen ortho phosphate: acetonitrile (55:45v/v, PH-5.64 adjusted with Orthophosphoric acid) on Agilent Thermo Scientific Hypersil, C18 (250 x 4.6 mm, 5) at a flow rate 1.0ml/min with UV detection at 228nm.The retention times for Metformin and Pioglitazone were 2.579 and 5.633 min respectively and both drugs showed good linearity in the range of 500-2000 µg/ml and 30-120 µg/ml. The proposed method has been successfully applied to pharmaceutical formulation and was validated according to ICH guidelines and method showed good precision with percentage relative standard deviation less than 2%. The percentage recovery for Metformin and Pioglitazone was found between 99.48-100.85% and 99.48-100.89% respectively indicating the proposed method was accurate and precise.
Key words: Metformin (MET), Pioglitazone (PIO), RP-HPLC, and Simultaneous estimation.
INTRODUCTION
Metformin (MET) is a biguanidine chemically named as N,N-Dimethylimidodicarbonimidic diaminehydrochloride.It is used in the treatment of type 2diabetes. It improves hepatic and peripheral tissue sensitivity to insulin without the problem of serious lactic acidosis.It decreases the gluconeogenisis while increasing the glucose uptake by muscles and fat cells (fig-1). [1] Pioglitazone (PIO) is chemically [(±)-5-[[4-[2-[5-ethyl -2- pyridinyl) ethoxy] phenyl] -methyl] -2,4-] thiazolidine dionemonohydro- chloride (fig-2).Pioglitazone is a thiazolidine Dione derivative. It is one of the PPAR-alpha agonist, insulin sensitizer used to reduce the insulin resistance. Pioglitazone hydrochloride has been shown to affect abnormal glucose and lipid metabolism associated with insulin resistance by enhancing insulin action on peripheral tissues
(fig-2).[2]Literature survey revealed few analytical techniques are available for estimation of MET alone as well as in combine dosage form such as UV ,HPLC, HPTLC.[3-7] Similarly few analytical methods are available for estimation of PIO alone and its combination with drugs such as UV and HPLC.[8-17] keeping this objective in mind an attempt has been made to develop and validate the RP-HPLC method for the simultaneous estimation of MET and PIO which would be highly sensitive having good resolution reproducible and cost effective. Various validation aspects of the analysis accuracy, precision, recovery, the limits of detection and quantification etc have been measured as per ICH guidelines. [18]
MATERIALS AND METHOD
Equipment: Chromatographic separation was performed on HPLC system - Water’s alliance 2695
International Journal of Pharmacy
with 2996 module Photo Diode Array (PDA) detector equipped with a solvent delivery pump, automatic sample injector and column thermostats. Waters Empower2 software was applied for data collecting and processing.
Chemicals and reagents: Water, Acetonitrile (HPLC grade) was used. Buffer used was Potassium dihydrogen ortho phosphate. Reference standards Metformin and Pioglitazone were obtained from SPECTRUM PHARMA. BIOGLITA M-30 Tablets of MET (500mg) and PIO (30mg) manufactured by sun pharmaceuticals Ltd were procured from local market.
Preparation of standard solutions: Accurately weighed 500 mg of Meformin and 30 mg of Pioglitazone each was transferred into a clean and dry 25ml volumetric flask, dissolved with sufficient volume of diluent and sonicate for 5min. The volume made up to 25ml with diluent to obtain 1000µg/ml of Metformin and 60µg/ml of Pioglitazone stock solutions. 0.5ml of standard stock solution of Metformin (1000µg/ml) and 0.5ml of standard stock solution of Pioglitazone (60µg/ml) are transferred in to a 10 ml volumetric flask and the volume made with diluent. The resulting solution was sonicated for 10 min.
Preparation of sample solution: 5 tablets of BIOGLITA M-30 containing 500mg of Metformin and 30mg of pioglitazone were weighed and crushed into powder. From that powder weight equivalent to 500mg of Metformin and 30mg of Pioglitazone were transferred into a 500 mL volumetric flask, 400mL of diluent added and sonicated for 25 min, further the volume made up with diluent and filtered. From the filtered solution 2ml was pipetted out into a 10 ml volumetric flask and made up to 10ml with diluent.
Preparation of buffer: Accurately weighed 2.72gm of Potassium dihydrogen orthophosphate was transferred into a 1000ml of Volumetric flask, about 900ml of milli-Q water was added and sonicate to degassed and finally make up the volume with water. Finally pH is adjusted to 5.64 with dilute orthophosphoric acid solution.
Optimized chromatographic conditions: Flow rate : 1.0ml/min
Column : Thermo Scientific Hypersil, 250 x 4.6 mm, 5.
Detector Wave length : 228nm Column temperature : 30°C Injection volume : 10L Run time : 10 min
Diluent : Acetonitrile: Water (70:30)
METHOD VALIDATION
System suitability test: This parameter was evaluated before each stage of validation. Six replication injections of standard preparation were injected. Asymmetry, number of theoretical plates and relative standard deviation of peak area were determined.
Linearity: Solutions were prepared containing 500µg/ml, 750µg/ml, 1000µg/ml, 1500µg/ml, 2000µg/ml concentrations of Metformin and 30µg/ml, 45µg/ml, 60µg/ml, 90µg/ml, 120µg/ml concentrations of Pioglitazone which corresponding to 50, 75, 100, 150 and 200% respectively of the test solution concentration. Each solution was injected, linearity was evaluated by linear- regression analysis.
Accuracy: Accuracy was determined by the recovery studies at three different concentrations (corresponding to 50, 100 and 150% of the test solution concentration) by addition of known amounts of standard to pre-analysed sample preparation. For each concentration, three sets were prepared and injected.
Precision: Intraday and interday variations were determined by using six replicate injections of one concentration and analyzed on the same day and different days. Precision of an analytical method is usually expressed as the standard deviation or relative standard deviation (coefficient of variation) of a series of measurements.
Robustness: The robustness was evaluated by assaying test solutions after slight but deliberate changes in the analytical conditions. The factors chosen for this study were the flow rate (±0.1ml/min), mobile phase composition (buffer: acetonitrile by 5%), temperature (±5ºc).
Limit of detection (LOD) and Limit of quantification (LOQ): LOD and LOQ was calculated from linear curve using formulae
LOD= 3.3 * σ / slope, LOQ= 10 * σ / slope
(Where σ = the standard deviation of the response and S = Slope of calibration curve).
RESULTS AND DISCUSSIONS
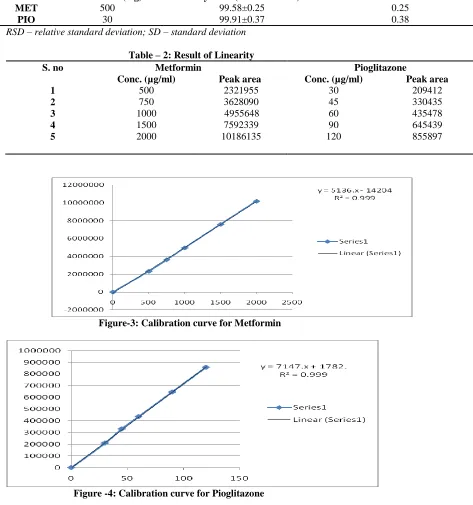
Several mobile phase compositions were tried to resolve the peak of MET and PIO. The mobile phase containing buffer: Acetonitrile in proportion of 55:45v/v was found ideal to resolve the peak of MET and PIO satisfactory. Retention time of MET and PIO were 6.333 and 2.579 min respectively (Figure 1&2). Result of assay is shown in Table-1. The proposed method was found to be linear in concentration range 500-2000µg/ml for MET and 30-120µg/ml for PIO. The data was shown in Table-2 and Figure-3&4 system suitability parameters were evaluated and results shown in (Table-3), which were within acceptance criteria. The mean percentage recovery for MET and PIO was found to be between 99.13-100.85% and 99.48-100.89% respectively, which are well within the limit and hence the method was found to be accurate (Table-4). LOD and LOQ values were 9.12μg/ml and 27.65μg/ml for Metformin and 0.82μg/ml and 2.49μg/ml for Pioglitazone (Table-5).
Results of intraday and interday precision were shown in the Table (6a&6b). The robustness of the method was investigated by varying experimental conditions such as changes in flow rate, mobile phase composition and temperature. The result obtained implies method is robust for routine qualitative analysis (Table-7).
CONCLUSION
The proposed RP-HPLC method was validated as per International conference on harmonization (ICH) guidelines, and found to be applicable for routine quality control analysis for the simultaneous estimation of MET and PIO using isocratic mode of elution. The results of linearity, precision, accuracy and specificity, proved to be within the limits. The method provides selective quantification of MET and PIO without any interference. The proposed method is highly sensitive, reproducible, reliable, rapid and specific.
Figure-1: Chromatogram of MET (1000µg/ml) and PIO (60µg/ml) standard
Table -1Analysis data of tablet formulation (BIOGLITA M-30)
TABLET Label claim(mg) Assay ± SD (% label claim) %RSD
MET 500 99.58±0.25 0.25
PIO 30 99.91±0.37 0.38
RSD – relative standard deviation; SD – standard deviation
Table – 2: Result of Linearity S. no Metformin Pioglitazone
Conc. (µg/ml) Peak area Conc. (µg/ml) Peak area
1 500 2321955 30 209412
2 750 3628090 45 330435
3 1000 4955648 60 435478
4 1500 7592339 90 645439
5 2000 10186135 120 855897
Figure-3: Calibration curve for Metformin
Figure -4: Calibration curve for Pioglitazone
Table-3: System suitability studies
Parameters Metformin Pioglitazone Acceptance criteria Theoretical plates 8230 6752 More than 2000
Tailing factor 1.71 1.39 Less than 2
Retention time 6.305 2.567 More than 2
Table-4: Recovery studies for Metforimn and Pioglitazone DRUG Spiked level% Amount taken
(µg/ml)
Amount found (µg/ml)
Percent recovery n=3
% RSD
MET 50 502.86 507.14 100.85 0.30
100 1009.49 1007.98 99.85 0.26
150 1520.77 1508.30 99.18 0.18
PIO 50 35.70 36.00 100.82 0.49
100 63.89 64.02 100.19 0.38
150 95.10 95.06 99.95 0.17
n- Number of replicate injections
Table-5: LOD and LOQ for Metformin and Pioglitazone
DRUG LOD (µg/ml) LOQ (µg/ml)
Metformin 9.12 27.65
Pioglitazone 0.82 2.49
Table-6a:Results of intraday Precision
DRUG Conc. (µg/ml) Peak area (n=6) % RSD
MET 1000 5364556 0.2
PIO 60 432804 0.3
Table-6b:Results of interday Precision
DRUG Conc. (µg/ml) Peak area (n=6) % RSD
MET 1000 5090486 0.2
PIO 60 433480 0.2
Table-7:Results of Robustness study
S. no Parameter Condition Mean Peak area (n=2) % change
MET PIO MET PIO
1. Flow rate 1.1 ml/min 5098436 439013 0.4 0.4
0.9 ml/min 5960847 511857 0.3 0.1
2. Mobile phase 60:40 v/v 5062268 435490 0.1 0.1 50:50 v/v 5113877 441187 0.4 0.6
3. Temperature 35ºc 5164473 442158 0.5 0.5
25ºc 5127115 439617 0.6 0.8
REFERENCES
1. Gadapa Nirupa,Upendra M. Journal of Chemistry; 2013.
2. Srinivas P,Venkataramana K,Srinivasa Rao N,Srinivasa Rao J.IJPCBS,2012;2(1):104-109. 3. Jajow Swapna, et al., Asian J. Pharm. Ana, 2012; Vol.2, Issue 3:85-89.
4. Surendra Babu B,Sravani,Ravi kumar.Int.Res J Pharm.App.Scii,2012;2(4):91-96. 5. Narendra Nyola,Govinda Swamy.J Pharm Edu Res,2012;3(2).
6. Narsimha rao Doredla, Chandana Mannepalli.IJPRIF, 2012;4(3): 948-956.
7. Venkatrao S, Sankara Rao Gollu,Gopala Krishna A. Orient .J. Chem, 2011; 27(3):1221-1226. 8. Freddy H Havaldar,Dharmendra L,Vairal.IJABPT,2010; 1(3):1000-1005.
9. Sujana K, Swathi rani G,Bhanu Prasad M,Saheethi Reddy M.J Biomed Sci and Res,2010 ;2 (2):110-115. 10. Alexanda S,Chandrasekar MJN.RJPBCS,2010;1(4):858-866.
11. Lakshmi,Shrinivas Sharma,IJPPS,2009;1( 2).
12. Sahoo P K,Sharma R, Chaturvedi SC.IJPS,2008; 70(3):383-386.