ISSN (Online): 2320-9364, ISSN (Print): 2320-9356
www.ijres.org Volume 7 Issue 4 Ser. I ǁ 2019 ǁ PP. 30-36
Effective treatment of municipal wastewater for reuse as
agricultural water with a specially designed aerated constructed
wetland
Dul-Sun Kim, Dong-Keun Lee
*Department of Chemical Engineering, Gyeongsang National University, 501 Jinju-daero, Jinju-si, Gyeongsangnam-do 52828, Korea
Corresponding Author: Dong-Keun Lee
ABSTRACT: A constructed wetland with the aerobic and anaerobic/anoxic tanks connected in series was employed to treat 100m3 raw municipal wastewater every day from a small farm village, which suffers from serious lack of water supply. The aerobic tank was kept to be aerobic with a continuous supply of air through the natural air draft system. Successful biological oxidation and nitrification could be obtained at the aerobic tank. The nitrate nitrogen was then finally denitrified with the consumption of remaining BOD5, CODMn and organic
solids at the anaerobic/anoxic tank. Successful and stable removal of SS could be obtained upto 3 year continuous operation without blockage of the sands and gravels within the wetland. No more accumulation of organic solids after 1 year operation was observed owing to the equilibrium between the input loading rate of organic solids and the decomposition rate of them. The finally treated water is now being reused for agricultural purposes at the farm village.
Keywords:agricultural water, aerated constructed wetland, municipal wastewater, natural air draft system. --- --- Date of Submission: 07-12-2019 Date of acceptance: 18-12-2019 --- ---
I.
INTRODUCTION
Constructed wetlands (CWs) are an eco-friendly alternative for secondary municipal and industrial wastewater treatment (Liu et al. 2014; Vymazal 2014; Ilyas&Masih 2017). These systems are used natural processes to remove pollutants. Compared with traditional wastewater treatment technologies such as activated sludge process and biofilm process, CWs involve cheaper investmentand operating costs. The sole external energy source is solar radiation.
The first experiments with CWs-based treatment of sewage were conducted by Seidel in Germany in the 1950s (Seidel 1961). Since then, the application of CWs in wastewater treatment has been gradually performed in both developed and developing countries worldwide (Vymazal 2010; Lee et al 2007). Traditional constructed wetlands have been used to treat municipal wastewaters but during the last two decades the application of constructed wetlands included to treat domestic and agricultural wastewaters, especially with small amounts of novel organic pollutants (Vymazal 2011; Dan et al. 2013; Xiaoyan et al. 2015; Dai et al. 2016; Kim et al. 2006), includingpesticides such aschlorpyrifos (Moore et al. 2002; Jaramillo &Penuela 2012; Souza et al. 2017; Tang et al. 2019).
The mechanisms for removing pollutants in CWs are complex, includingphysical processes like precipitation and filtration and biochemical processes induced by wetlandplants and microorganisms(Cui et al. 2013; Meng et al. 2014). The influential factors for the degradation of pollutants in CWs were temperature, dissolved oxygen (DO) and substrate (Wu et al. 2015b). Among these, the DO is the most important factor that could influence microbial activities and the efficiency of pollutants removal. However, DO in traditional CWs is rather low, resulting in poor decontamination performance (Matamoros et al. 2008; Oon et al. 2015). Therefore, various oxygen intensive technologies have beendeveloped to enhance oxygen content in wetland beds (Li et al.2014; Pan et al. 2015; Kim et al. 2006)
slow process in wastewater wetlands. If ammonia can be removed from the water column in the wetland to the desired level, then other pollutants will generally be removed to acceptable levels as well. By making the wetland aerobic, faster and more efficient biological nitrification is expected to occur within the wetland. Accordingly, the required wetland size will be reduced greatly, and thereby the application of the constructed wetland becomes more practical for the treatment of raw municipal wastewaters.
In this study, a constructed wetland was designed to remove BOD and SS together with total nitrogen (T-N) from raw municipal wastewater. The designed wetland was composed of the aerobic tank and anaerobic/anoxic one thatwas connected in series immediately after aerobic one, and could treat 100 m3 raw municipal wastewater every day. In the aerobic tank, both the biological oxidation of organic carbons and nitrification of Kjeldahl nitrogen were expected to proceed under aerobic conditions. Biological denitrification will occur at the following anaerobic/anoxic tank consuming the remaining organic carbons as carbon sources.
II.
METHODS
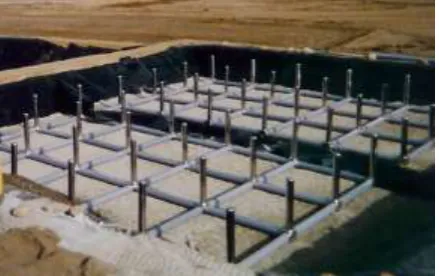
The constructed wetland was composed of the two tanks connected in series; one is the aerobic tank andthe other is the anaerobic/anoxic one (Figure 1). The former tank could remain aerobic owing to the continuous supply of air through the natural draft system (Figure 2) whose driving force for airflow was the temperature difference between the ambient air and the air inside the tank (Schroeder&Tchbanoglous 1976). The aerobic tank had 290 m2 surface area and 1.2 m depth, and accordingly the theoretical hydraulic residence time (HRT) in the tank was 3.48 days. From the bottom of the tank spherical gravels (25 mm diameter) were packed upto the depth of 0.9 m above which tiny sands (2.5 mm diameter) were packed again with 0.3 m depth. Reeds were planted on the sand level.
Figure 1: The schematic diagram of the constructed wetland
Figure 2: The natural air draft system installed inside the aerobic tank of the constructed wetland
At immediate after the aerobic tank was installed the anaerobic/anoxic one whose surface area and depth were 580 m2 and 1.5 m, respectively. The theoretical HRT of the tank was 8.7 days. From the bottom of the tank spherical gravels (25 mm diameter) were packed upto the depth of 1.0 m above which tiny sands (2.5 mm diameter) were packed again with 0.3 m depth.
Constructed wetland operated continuously for 36 months after installation. This wetland is built at a small farm village whose population is about four hundred. The village uses groundwater for their daily consumption, and suffers from serious lack of water supply.
the aerobic tank was then introduced into the following anaerobic/anoxic tank, and flows horizontally as shown in Figure 1.Samples of the influent and effluents from aerobicand anaerobic/anoxic tanks were taken for three years each day, and the water quality (BOD, COD, SS, T-N, NH4+-N) was measured and showed the average
monthly value. The water quality measurement method followed standard methods for the examination of water pollution.
III.
RESULTS AND DISCUSSION
The changes in DO concentration can be clearly seen from the data in Figure 3. The DO concentrations in the influent wastewater were about 0.3 mg/L. DO concentrations in the effluent were, however, more than ten times higher than the corresponding values in the influent. This result indicates that the natural air draft system supplies the constructed wetland with sufficient oxygen.
Figure 3: DO concentration in the influent (●) and the effluent () from the aerobic tank of the constructed wetland
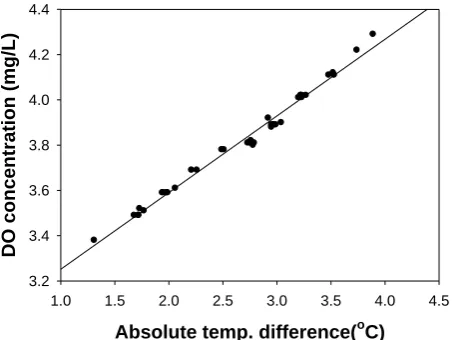
In addition, DO concentrations at the effluent of the wetland were highly proportional to the absolute temperature difference between the ambient air and the air inside the natural air draft system (Figure 4). This provides evidence that the driving force for air flows is the temperature difference between the ambient air and the air inside the wetland.
Absolute temp. difference(oC)
1.0 1.5 2.0 2.5 3.0 3.5 4.0 4.5
DO concentration (
mg/L)
3.2 3.4 3.6 3.8 4.0 4.2 4.4
Figure 4: Dependence of DO concentration on the temperature difference between the ambient air and the air inside the natural air draft system
The influent and effluent concentrations of BOD5 and CODMn in the constructed wetland are shown in
Figure 5. The average influent concentrations of BOD5 and CODMn were 80.0 mg/L and 74.0 mg/L,
respectively. After being treated at the aerobic tank, less than 80% of BOD5 and CODMn was removed and the
respective average effluent BOD5 and CODMn concentrations from the aerobic tank were 10.8 mg/L and 11.2
mg/L. Additional removal of BOD5 and CODMn could be obtained at the anaerobic/anoxic tank. About 60% of
Figure 5(c) shows the efficiencies of SS removal in the aerated constructed wetland. More than 99% of the initial SS was continuously removed and stably upto 3 year operation without blockage of the sands and gravels within the wetland.
(a) (b)
(c)
Figure 5: The influent and effluent concentrations of BOD5 (a), CODMn (b) and SS (c) in the constructed
wetland
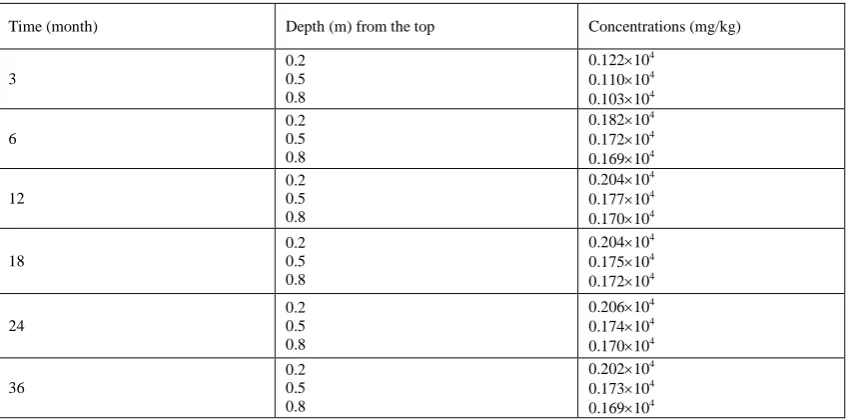
Organic solid material concentrations attached onto the surface of the sands and gravels in the aerated constructed wetland were measured at 120 locations and at different times (3, 6, 12, 18, 24 and 36months). Distributions of the attached organic solid materials onto sands (0.2 m depth) and gravel (0.5 m and 0.8 m depths) after 3 year operation in the aerated constructed wetland are plotted in Figure 6(a), 6(b) and 6(c), respectively. Although the distributions are not completely uniform, the attached organic solid materials are somewhat well distributed over the wetland.
(a) (b)
(c)
Figure 6:Distributions of the attached organic solid materials onto sands at 0.2 m depth (a) and gravel at 0.5 m depth (b) and 0.8 m depth (c) after 3 year operation in the aerated constructed wetland
Table 1: Average concentrations of organic solid materials attached onto the surface of sands and gravels at different operation times.
No more accumulation of organic solid materials within the wetland after 12 month operation means that the input loading rate of organic solid materials nearby equals the disappearance rate of organic solid materials. In other words, the aerobic biochemical decomposition rate of the solids equilibrate the input loading rate.
The total equilibrated amounts of the attached solids onto sands and gravels were calculated to be about 120 kg and 215 kg, respectively. When taking the density of the organic solids to be 0.5 g/cm3, the total volumes of the solids on sands and gravels became to be 0.24 m3 and 0.43 m3, respectively which corresponded to just 1.6% and 1.1% of the initial void volumes of sands (15.23 m3) and gravels (37.56 m3). These values seem to be low enough not to block the pathways of water inside the wetland.
Time (month) Depth (m) from the top Concentrations (mg/kg)
3
0.2 0.5 0.8
0.122104 0.110104
0.103104
6
0.2 0.5 0.8
0.182104
0.172104
0.169104
12
0.2 0.5 0.8
0.204104
0.177104
0.170104
18
0.2 0.5 0.8
0.204104
0.175104
0.172104
24
0.2 0.5 0.8
0.206104
0.174104
0.170104
36
0.2 0.5 0.8
0.202104
0.173104
Figure 7: Time dependence of the amounts of the attached organic solids on sand and gravel
In addition to the successful removal of BOD5, CODMn and SS, nutrient removal could also be
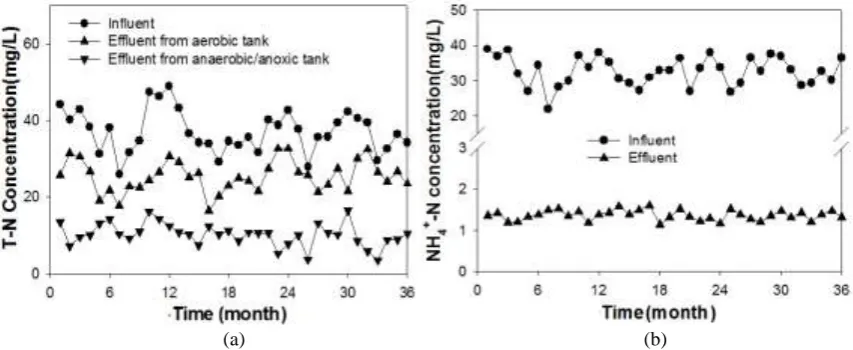
obtained. In the case of total nitrogen (T-N) about 31.2% of the input T-N was removed at the aerobic tank of the wetland (Figure 8(a)). When considering the fact that more than 94% of the organic nitrogen and ammonia nitrogen were nitrified successfully into nitrate nitrogen, which is indicative of the successful biological nitrification (Figure 8(b)), about 30% denitrification in the aerated wetland is somewhat surprising because biological denitrification proceeds under anoxic conditions. This partial denitrification is believed to occur at the local anoxic area within the aerobic tank which seems to be placed somewhat far away from the natural air draft system.
(a) (b)
Figure 8: The influent and effluent concentrations of T-N (a) and NH4+-N (b) in the aerated constructed
wetland
Another possible way of partial T-N removal in the aerobic tank might be the uptake of nitrogen compounds by reeds that had been planted on the sand level of the aerobic tank. After 3 year continuous operation grown reeds were harvested from the aerobic tank, and the total nitrogen uptake inside the reeds were analyzed. Less than 3% of the input nitrogen could be taken by the reeds. Accordingly the removal of T-N due to the uptake by the planted reeds is almost negligible.
More than 60% of the total nitrogen (most of them was nitrate nitrogen) in the effluent from the aerobic tank was denitrified biologically at the following anaerobic/anoxic tank. The remaining BOD5 and CODMn at the
effluent from the aerobic tank were believed to be consumed as a carbon source for biological denitrification at the anaerobic/anoxic tank. Additional carbon for biological denitrification may have been provided through the digestion of the attached organic solids within the anaerobic/anoxic tank.
www.ijres.org 36 | Page
]
IV.
CONCLUSIONS
The constructed wetland was built at a small farm village, which suffers from serious lack of water supply; the wetland could treat the 100 m3 raw municipal wastewater every day. The constructed wetland was composed of the aerobic tank and anaerobic/anoxic tank connected in series. The aerobic tank could be remained aerobic due to the continuous supply of oxygen though the natural air draft system.
Fast biological oxidation of organic carbon and ammonium nitrogen could occur at the aerobic tank, and biological denitrification proceeded at the following anaerobic/anoxic tank. In addition more than 99% of the initial SS could stably be removed upto 3 year continuous operation without blockage of the sands and gravels within the wetland.
The average concentration of the final effluent grow the wetland was 4.8 mg/L BOD5, 5.2 mg/L
CODMn, 0.2 mg/L SS and 9.2 mg/L T-N. There values were low enough for the treated water to be reused as the
agricultural water at the neighboring farm lands.
REFERENCES
[1]. Cui, L., Ouyang, Y., Gu, W., Yang, W. & Xu, Q. (2013) Evaluation of nutrient removal efficiency and microbial enzyme activity in a baffled subsurface-flow constructed wetland system. Bioresource Technology, 146, 656–662.
[2]. Dan, A., Yang, Y., Dai, Y.-n., Chen, C.-x., Wang, S.-y. & Tao, R. (2013) Removal and factors influencing removal of sulfonamides and trimethoprim from domestic sewage in constructed wetlands. Bioresource Technology, 146, 363-370.
[3]. Dai, Y.-n., Yang, Y., Tam, N. F.-y., Tai, Y. -P. & Tang, X. -Y. (2016) Factors affecting behavior of phenolic endocrine disruptors, estrone and estradiol, in constructed wetlands for domestic sewage treatment. Environmental Science & Technology, 50, 11844-11852.
[4]. Ilyas, H. & Masih, I. (2017) The performance of the intensified constructed wetlands for organic matter and nitrogen removal: A review. Journal of Environmental Management, 198, 372-383
[5]. Jaramillo, M.L. & Penuela, G. (2012) Comparison of the removal of chlorpyrifos and dissolved organic carbon in horizontal sub-surface and sub-surface flow wetlands. Science of The Total Environment, 431, 271-277.
[6]. Kim, D. –S., Yoon, J. –H., Kim, S. –C.& Lee, D. –K. (2006) Biological filtration of organic solid materials from municipal wastewater with the aerated constructed wetland. Recent Progress in Slow Sand and Alternative Biofiltration Processes, 63, 500-505.
[7]. Kim, S. –C. & Lee, D. –K. (2006) Design of an aerated wetland for the treatment of municipal wastewater. Studies in Surface Science and Catalysis, 159, 145-148.
[8]. Lee, D. –K., Kim, S. –C.& Yoon, J. –H. (2007) Reuse of a dyehouse effluent after being treated with the combined catalytic wet peroxide oxidation process and the aerated constructed wetland. Water Science and Technology, 55(1-2), 407-415.
[9]. Li, F., Lu, L., Zheng, X., Ngo, H.H., Liang, S., Guo, W. & Zhang, X. (2014) Enhanced nitrogen removal in constructed wetlands: effects of dissolved oxygen and stepfeeding. Bioresource Technology, 169, 395–402.
[10]. Liu, H., Hu, Z., Zhang, J., Ngo, H. H., Guo, W., Liang, S., Fan, J., Lu, S. & Wu, H. (2014) Optimizations on supply and distribution of dissolved oxygen in constructed wetlands: A review. Bioresource Technology, 214, 797–805.
[11]. Matamoros, V., García, J. & Bayona, J. M. (2008) Organic micropollutant removal in a full-scale surface flow constructed wetland fed with secondary effluent. Water Research, 42(3), 653–660
[12]. Meng, P., Pei, H., Hu, W., Shao, Y. & Li, Z. (2014) How to increase microbial degradation in constructed wetlands: influencing factors and improvement measures. Bioresource Technology, 157, 316–326.
[13]. Moore, M., Schulz, R., Cooper, C., Smith, S. & Rodgers, J. (2002) Mitigation of chlorpyrifos runoff using constructed wetlands. Chemosphere, 46, 827-835.
[14]. Oon, Y. -L., Ong, S. -A., Ho, L. -N., Wong, Y. -S., Oon, Y. -S., Lehl, H. K. & Thung, W. -E. (2015) Hybrid system up-flow constructed wetland integrated with microbial fuel cell for simultaneous wastewater treatment and electricity generation. Bioresource Technology, 186, 270–275.
[15]. Pan, J., Fei, H., Song, S., Yuan, F. & Yu, L. (2015) Effects of intermittent aeration on pollutants removal in subsurface wastewater infiltration system. Bioresource Technology, 191, 327–331.
[16]. Schroeder, E. D. & Tchbanoglous, G. (1976) Mass Transfer Limitations in Trickling Filter Designs. Journal of the Water Pollution Control Federation, 48, 771-775.
[17]. Seidel, K. (1961) Zur Problematik der Keim-und Pflanzengewasser. Verhandlungen des Internationalen Verein Limnologie, 14, 1035–1039.
[18]. Souza, T.D.d., Borges, A.C., Matos, A.T.d., Mounteer, A.H. & de Queiroz, M.E. (2017) Removal of chlorpyrifos insecticide in constructed wetlands with different plant species. Revista Brasileira de Engenharia Agrícola e Ambiental, 21, 878-883.
[19]. Tang, X. –Y., Yang, Y., McBride, M. B., Tao, R., Dai, Y. –N. & Zhang, X. –M. (2019) Removal of chlorpyrifos in recirculating vertical flow constructed wetlands with five wetland plant species. Chemosphere, 216, 195-202.
[20]. Vymazal, J. (2010) Constructed wetland for wastewater treatment. Water, 2, 530-549.
[21]. Vymazal, J. (2011) Constructed wetlands for wastewater treatment: five decades of experience. Environmental Science & Technology, 45(1), 61–69.
[22]. Vymazal, J. (2014) Constructed wetlands for treatment of industrial wastewaters: A review. Ecological Engineering, 73, 724–751 [23]. Wu, H., Zhang, J., Ngo, H.H., Guo, W., Hu, Z., Liang, S., Fan, J. & Liu, H. (2015b) A review on the sustainability of constructed
wetlands for wastewater treatment: design and operation. Bioresource Technology, 175, 594–601.
[24]. Xiaoyan, T., Suyu, W., Yang, Y., Ran, T., Yunv, D., Dan, A. & Li, L. (2015) Removal of six phthalic acid esters (PAEs) from domestic sewage by constructed wetlands. Chemical Engineering Journal, 275, 198-205.