Multi-Parameter Analysis and Modeling of MRR
& SR on Electro Discharge Machine with Multi
Wall Carbon Nano Tube
Prof. Yashesh A. Darji
Assistant Professor
Department of Mechanical Engineering
C U Shah College of Engineering & Technology,Wadhwancity surendranagar, Gujarat India
Abstract
Electric discharge machining is non-conventional machining process used for machining of hard materials which cannot be machined by conventional machining process. Electric discharge machining is an electro sparking method of metal working involving an electric erosion effect. A pulse discharge occurs in a small gap between the work piece and the electrode and removes the unwanted material from the parent metal through melting and vaporizing. Powder-mixed electrical discharge machining is one of the latest techniques for improving material removal rate and also surface roughness among other performance characteristics. However its utilization in the manufacturing industry is very low because many fundamental issues of this new development such as machining mechanism cost effectiveness of powder and powder concentration in the working fluid together with safety and environmental impact among other are not well understood. This work investigation the machining characteristics of EN-31 with aluminum as tool electrode during EDM process, the multi wall carbon nano tube is mixed with dielectric fluids in EDM process to analyze the MRR, and SR. Regression model were developed to predict the output parameter in EDM process. In the development of predictive models, machining parameter of peak current, pulse on time and pulse off time were considered as model variables. The collection of experimental data adopted full factorial method. Analysis of variance (ANOVA) to determine the significant parameter affecting the output parameter. Later EN-31 steel was analyzed and the parameters are optimized using design expert software, regression equations are compared with and without MWCNT using EDM process. The average 19% of MRR was improved, with respect to input parameter and the average 30% of surface roughness was improved by using carbon nano tube mixed as dielectric fluid.
Keywords: Electrical discharge machining (EDM) Carbon nanotubes (CNT), Material removal rate, tool wear rate, full factorial method, Regression Analysis
________________________________________________________________________________________________________
I. INTRODUCTION
II. ABOUT CARBON NANO TUBE
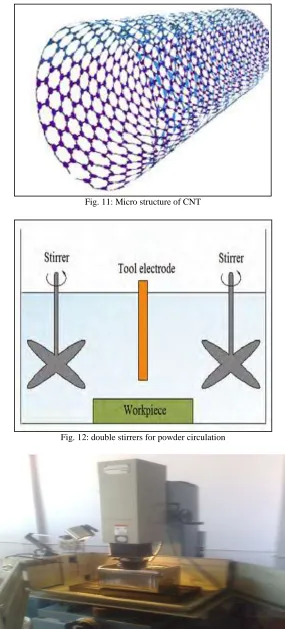
CNTs are related to graphite. The molecular structure of graphite resembles stacked, one-atom-thick sheets of chicken wire, a planar network of interconnected hexagonal rings of carbon atoms. In conventional graphite, the sheets of carbon are stacked on top of one another, allowing them to easily slide over each other. That is why graphite is not hard, but it feels greasy and can be used as a lubricant. When grapheme sheets are rolled into a cylinder and their edges joined, they form MWCNT (Table 3). Only the tangents of the graphitic planes come into contact with each other, and hence their properties are more like those of a molecule as mentioned in the above passage clearly. Furthermore, the high-frequency carbon-carbon bond vibrations provide an intrinsic thermal conductivity higher than even diamond. The TEM images of multi wall carbon nano tubes are shown in Figure 1 were received from Cheap tubes Inc., USA. CNT nano fluids, is of special interests to researchers because of the novel properties of CNTs -extraordinary strength, unique electrical properties and efficient conductors of heat. CNTs are fullerene-related structures that consist of either a grapheme cylinder or a number of concentric cylinders (Wen and Ding, 2004). Choi et al. (2001) measured the effective thermal conductivity of MWCNTs dispersed in synthetic (poly-α-olefin) oil and reported the enhancement up to a 150% in conductivity at approximately 1 vol% CNT, which is by far the highest thermal conductivity enhancement ever achieved in a liquid (Lockwood and Zhang, 2005). Solid lubricants are useful for conditions when conventional liquid lubricants are inadequate such as high temperature and extreme contact pressures. Their lubricating properties are attributed to a layered structure on the molecular level with weak bonding between layers. Such layers are able to slide relative to each other with minimal applied force, thus giving them their low friction properties. CNT is having high strength to weight ratio used in aerospace industry. Young’s modulus of CNT is over 1 TPa versus 70 GPa for aluminium, steel 200 Gpa and 700 GPa for C-fibre. The strength to weight ratio is 500 times greater than aluminium. Maximum strain will be 10% much higher than any material. Thermal conductivity of 3,000 W/mK in the axial direction is with small values in the radial direction. Conductivity of CNTs is 109 A/cm2 and copper is 106 A/cm2. CNT’s having very high current carrying capacity, excellent field emitter and high aspect ratio. Model Hommel Tester TR500 SR tester is a multi-application measuring instrument for component surface quality evaluation. It is capable of checking the work piece SR on plane, cylinder, groove and bearing raceway.
In this paper, CNT mixed dielectric fluids are used in the EDM process to analyze the EDM parameter like MRR & TWR of EN-31 tool steel material. Till now, no work has been carried out by using CNT mixed dielectric machining. CNT based nano fluid is used to improve the Material removal rate & tool wear rate the collection of experimental data adopted Full Factorial using Table 5 coded level of three machining parameters. ANOVA and regression model and to determine the significant parameter affecting the Material removal rate and tool wear rate Later the En-31 tool steel was analyzed and the parameters are optimized using design expert software and regression equation are compared with and without multiwall carbon nanotubes used in EDM process.
III. DIELECTRIC CYCLING SYSTEM
Due to the larger size of the in built container in the EDM machine, it is not appropriate to mix the powder in the bigger container. So we need to design the container to avoid the mixing of powder particles in the bigger container of the machine. Moreover, filter of machine might clog due to presence of powder particles and debris when using existing circulation system of machine itself. So a new container with capacity of 6.0 liters was developed in the workshop for the dielectric fluid. It was placed in the existing container of EDM machine and experiments were performed in this container. Special types of two stirrers are fixing with proto type new tank for proper circulation of powder mixed dielectric fluid into discharge gap between tool electrode and work piece material, Mixed 0.5 g/l CNT in dielectric fluid, Fig 2 show the mechanism of proto type tank and Fig 3 shown the proto type tank is using in EDM machine.
IV. EVALUATION OF MRR
The material MRR is expressed as the ratio of the difference of weight of the work piece before and after machining to the machining time and density of the material.
MRR = 𝑊𝑗𝑏−𝑊𝑗𝑎
𝑡 ƍ
Whereas Wjb = Weight of work piece before machining. Wja = Weight of work piece after machining.
t = Machining time
ƍ = Density of EN-31 steel material
V. CONDUCT OF EXPERIMENTS
such as pulse on time, pulse off time and peak current are varied at three levels of each. For a three factor are tackled with a total number of 27 experiments performed on die sinking EDM. Three responses such as material removal rate and surface roughness and tool were ratios are measure as output parameters. The material removal rate is calculated by using weight machine having the capacity of 200 gram and accuracy is 0.01 gram.
VI. RESULTS AND DISCUSSION
Fig. 4: Graph of without CNT for MRR
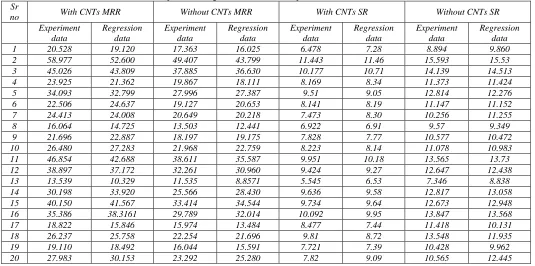
Table – 3
Comparison of regression model with experiment measurements Sr
no With CNTs MRR Without CNTs MRR With CNTs SR Without CNTs SR
Experiment data Regression data Experiment data Regression data Experiment data Regression data Experiment data Regression data
1 20.528 19.120 17.363 16.025 6.478 7.28 8.894 9.860
2 58.977 52.600 49.407 43.799 11.443 11.46 15.593 15.53
3 45.026 43.809 37.885 36.630 10.177 10.71 14.139 14.513
4 23.925 21.362 19.867 18.111 8.169 8.34 11.373 11.424
5 34.093 32.799 27.996 27.387 9.51 9.05 12.814 12.276
6 22.506 24.637 19.127 20.653 8.141 8.19 11.147 11.152
7 24.413 24.008 20.649 20.218 7.473 8.30 10.256 11.255
8 16.064 14.725 13.503 12.441 6.922 6.91 9.57 9.349
9 21.696 22.887 18.197 19.175 7.828 7.77 10.577 10.472
10 26.480 27.283 21.968 22.759 8.223 8.14 11.078 10.983
11 46.854 42.688 38.611 35.587 9.951 10.18 13.565 13.73
12 38.897 37.172 32.261 30.960 9.424 9.27 12.647 12.438
13 13.539 10.329 11.535 8.8571 5.545 6.53 7.346 8.838
14 30.198 33.920 25.566 28.430 9.636 9.58 12.817 13.058
15 40.150 41.567 33.414 34.544 9.734 9.64 12.673 12.948
16 35.386 38.3161 29.789 32.014 10.092 9.95 13.847 13.568
17 18.822 15.846 15.974 13.484 8.477 7.44 11.418 10.131
18 26.237 25.758 22.254 21.696 9.81 8.72 13.548 11.935
19 19.110 18.492 16.044 15.591 7.721 7.39 10.428 9.962
20 27.983 30.153 23.292 25.280 7.82 9.09 10.565 12.445
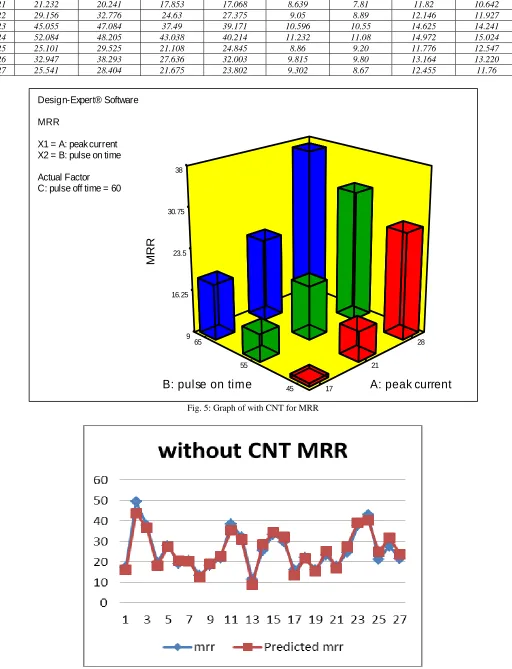
Design-Expert® Software
MRR
X1 = A: peak current X2 = B: pulse on time
Actual Factor C: pulse off time = 30
17 21 28 45 55 65 16 23.25 30.5 37.75 45
M
R
R
21 21.232 20.241 17.853 17.068 8.639 7.81 11.82 10.642
22 29.156 32.776 24.63 27.375 9.05 8.89 12.146 11.927
23 45.055 47.084 37.49 39.171 10.596 10.55 14.625 14.241
24 52.084 48.205 43.038 40.214 11.232 11.08 14.972 15.024
25 25.101 29.525 21.108 24.845 8.86 9.20 11.776 12.547
26 32.947 38.293 27.636 32.003 9.815 9.80 13.164 13.220
27 25.541 28.404 21.675 23.802 9.302 8.67 12.455 11.76
Fig. 5: Graph of with CNT for MRR
Fig. 6: Graph showing error between actual MRR and predicted MRR for without CNT
Design-Expert® Software
MRR
X1 = A: peak current X2 = B: pulse on time
Actual Factor C: pulse off time = 60
17
21
28
45 55
65 9 16.25
23.5 30.75
38
M
R
R
Fig. 7: Graph showing error between actual MRR and predicted MRR for with CNT
VII.EFFECT OF CARBON NANO TUBE ON MRR
The mean MRR for CNT + kerosene was 58.977 mm3/min and that of pure kerosene was 49.407 mm3/min at 28A and pulse on time 65 micro sec. and pulse off time 30 micro sec. The experimental results show that the CNT powder concentration of 0.5 g/l .high concentrations of CNT powder in the gap often made the EDM process unstable. ”c.mai. Hong et. [25] It is observed from the graph the MRR is increase with respect to increase in Peak current and pulse on time. This increase of MRR with concentration could be attributed in kerosene. Spark gap is filled with additive particles which reduces the insulating strength of the dielectric fluid and increased spark gap between the tool and work piece. It was also possible that the best combination of particle striking and powder density take place at this concentration.
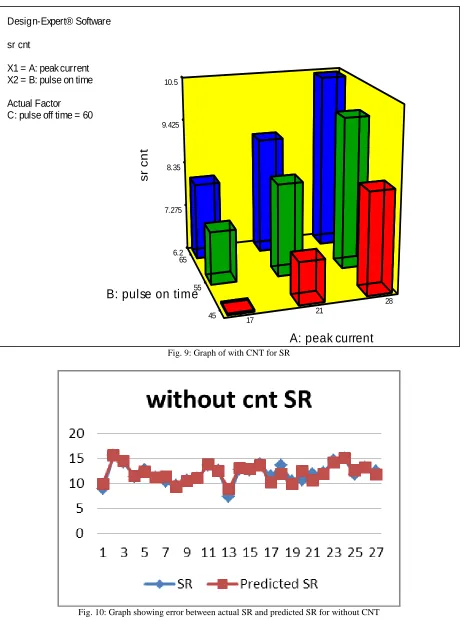
VIII. MAIN EFFECT PLOTS FOR WITHOUT CNTSR
Fig. 8: Graph of without CNT for SR Design-Expert® Software
SR
X1 = A: peak current X2 = B: pulse on time
Actual Factor C: pulse off time = 30
17
21
28
45 55
65 9.4 10.85 12.3 13.75
15.2
S
R
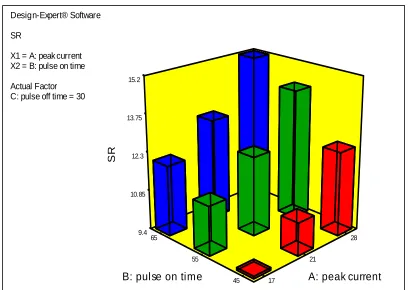
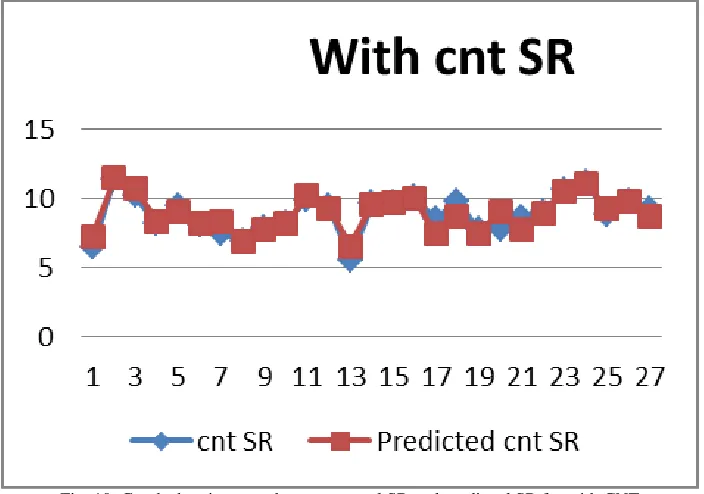
Fig. 9: Graph of with CNT for SR
Fig. 10: Graph showing error between actual SR and predicted SR for without CNT
Design-Expert® Software
sr cnt
X1 = A: peak current X2 = B: pulse on time
Actual Factor C: pulse off time = 60
17
21
28
45 55 65 6.2 7.275 8.35 9.425
10.5
s
r
c
n
t
Fig. 10: Graph showing error between actual SR and predicted SR for with CNT
Effect of carbon nano tube on SR
The means SR for CNT + Kerosene was 5.545 micro meter and that of pure kerosene was 7.346 micro meter at 17A and pulse on time 45 micro sec. and pulse of time 60 micro sec. the CNT powder mixed in dielectric improved the surface roughness of the work piece. The surface roughness became larger if more CNT powder was added. When the concentration was too high in gap, the EDM process become unstable arcing or short-circuiting, which deteriorated the surface. ‘c.mai, hong, et. [25]” The CNT is not hard but it feels greasy and can use as a lubricant. With CNT achieved best surface roughness.
IX. CONCLUSION
Process parameters do not have same effect for every response. Significant parameters and its percentage contribution changes as per the behavior of the parameter with objective response Finding the result of MRR the most significant factor was found to be peak current followed by pulse on time and the least significant was pulse off time. The MRR increased linearly with the increase in current. For pulse on time the MRR first increased with linearly with increase in pulse off time, MRR decreased insignificantly. For SR the most significant factor was again current followed by pulse on time and lastly the pulse off time. SR increased significantly with the increase in current in a nonlinear fashion. For increase in pulse on time SR increased. SR is decrease with respect to increase in Pulse off time. Surface roughness shows a marked improvement with increase in pulse off time.Effect of carbon nano tube on MRR for CNT + kerosene was 58.977 mm3/min and that of pure kerosene was 49.407 mm3/min from experimental result with carbon nano tube the average 19% of MRR increased with respect to input parameter. Effect of carbon nano tube on SR for CNT + Kerosene was 5.545 micro meter and that of pure kerosene was 7.346 micro meter from experimental result the CNT powder mixed in dielectric improved the surface roughness of the work piece. The average 30% of Surface finish was improved by using CNT mixed as dielectric fluid.
Table – 1
Major properties of EN-31 & Chemical Composition and grades: GCr15, 102Cr6, L1/L3/52100, SUJ2
Material Thermal conductivity
(W/mk) Density (g/cc) Electrical resistivity
Specific heat capacity (J/g-‘c)
EN-31 46.6 7.81 o.oooo218 0.475
Table – 2 Specification of MWCNT
Aspect Ratio ˜1000 Specific Surface Area 350 m2/g
Purity –wt% >95% Metallic Impurity <5% Average outer Diameter 20-40nm
Average inner diameter 5 nm Number of Walls 5-15
Fig. 11: Micro structure of CNT
Fig. 12: double stirrers for powder circulation
REFERENCES
Research Papers
[1] M.Kiyak, Department of Mechanical Engineering, Yildiz Technical University, 34349 Istanbul, Turkey Journal of Materials Processing Technology 191 (2007) 141–144
[2] “shailesh kumar” Experimental Investigation of Machining Parameters for EDM Using U-shaped Electrode of AISI P20 Tool Steel thesis (2010) [3] Module 9 “Non-conventional Machining”, Version 2 ME, IIT Kharagpur.
[4] J.L Lin, C.L. Lin, the use of orthogonal array with grey relational analysis to optimize the EDM process with multiple performance characteristics, international journal of machine tools &manufacture 42(2002) 237-244
[5] M. Mahardika and K. Mitsui, Total energy of discharge pulse calculation by stochastic methods, Proceeding of the International Conference of the 10th
AUN/SEED.Net Field Wise Seminar, Hanoi, Vietnam in 28th– 29th August 2007
[6] Poddar Ayush “Experimental Investigation of Mrr, Surface Roughness And Overcut of AISI 304 Stainless Steel In EDM” a thesis submitted to NIT (2012) [7] M. Mahardika and K. Mitsui, A new method for monitoring micro-electric discharge machining processes, International Journal of Machine Tools &
Manufacture (2007) doi:10.1016/j.ijmachtools.2007.08.023
[8] M. Mahardika and K. Mitsui, Total energy of discharge pulse calculation by stochastic methods, Proceeding of the International Conference of the 10th
AUN/SEED.Net Field Wise Seminar, Hanoi, Vietnam in 28th– 29th August 2007.
[9] “s prabhu1, b k vinayagam” Nano surface generation of grinding process using carbon nano tubes S¯adhan¯a Vol. 35, Part 6, December 2010, pp. 747–760 [10] “Hyun-Seok TAK, Chang-Seung HA”, Characteristic evaluation of Al2O3/CNTs hybrid materials for micro-electrical discharge machining.elsevier
(2011)s28-s38
[11] “C. Mai & Hong Hocheng” Advantages of carbon nanotubes in electrical discharge machining Int J Adv Manuf Technol DOI 10.1007/s00170-011-3476-2 (2011)
[12] “Gautam kocher1, Karan Chopra”Investigation of Surface integrity of AISI D3 tool steel After EDM International Journal of Emerging Technology and Advanced Engineering (ISSN 2250-2459, Volume 2, Issue 4, April 2012)
[13] S Velusamy, U.O Bidwai, “Effect of Titanium Carbide particle addition in the aluminum composite on EDM process parameters”. Journal of Manufacturing Processes (2011) 60-66
[14] P. Janmanee & A. Muttamara,” Performance of difference electrode materials in EDM of Tungsten carbide”. Science publication, (2010) 87-90. [15] M.P.Mohan, Y.S.Wong, “A study of Fine finishing die sinking Micro EDM of Tungsten Carbide using different electrode materials”. Journal of Material
processing technology (2009) 3956-3967
[16] H.C. Tsai, B.H. Yan,” EDM performance of Cr/Cu-based composite electrodes”. International Journal of Machine Tools & Manufacture (2003) 245-252. [17] A. A. Khan,” Electrode wear and MRR during EDM of aluminum and mild steel using copper and brass electrodes”. International journal of advance
manufacturing (2008)482-487
[18] Y.S.Wong, Y.H. Fuh,” EDM performance of TIC/Copper based Sintered electrode”. Material & Design (2001) 669-678.
[19] “yan. Cheng”Machining characteristics and optimization of machining parameters of SKH57 high-speed steel using electrical-discharge machining based on Taguchi method. Materials and Manufacturing Processes, 21(8), 922-929.
[20] “J. Simao, H.G. Lee”.Workpiece surface modification using electrical discharge machining,, 43 (2003) 121–128(2003)
[21] “Khalid Hussain SYED, Kuppan PALANIYANDI”Performance of electrical discharge machining using aluminums powder suspended distilled water Turkish J. Eng. Env. Sci (2012)
[22] S.H Tomadi, M.A Hussain,”Analysis of influence of EDM Parameters on Surface quality, MRR, EWR on Tungsten carbide”. IMECS, (2009) [23] C J Luis, I. Puertas,” MRR and EW study on the EDM of Silicon carbide “, Journal of Material processing technology (2005) 889-896.
[24] Nixon Kuruvila and H. V. Ravindra,” Parametric influence and optimization of wire EDM of hot die steel,” Machining Science and Technology (2011), 15:47–7.
[25] Puertas, I. And Luis, C.J., 2004.” A study of optimization of machining parameters for Electrical discharge machining of boron carbide” Materials and Manufacturing Processes,
[26] bhautik patel” CFD Analysis of Laser Ablation of Graphite Target in Three Dimensional Grid thesis from Ganpat University. [27] H. Theil, Principles of Econometrics 622– 27 (1971); G. Chow, Econometrics 320– 47 (1983)
[28] Techniques for the estimation of nonlinear regressions have been developed. See, e.g., G.Chow, supra note 9, at 220– 51. [29] statistical method for social scientists II0 – I6 johnston econometric method 1972
Books
[30] P.K. Mishra non-conventional machining process, 3rd reprint Nasora publishing house 2005
[31] C.R.Kothari research methodology 2nd revised edition new age international publishers reprint 2012
[32] User Guide of Design Expert Version 7 Manual
[33] Philli P .H. Sherod Nonlinear Regression Analysis Program reprint 2010 [34] SR tester SJ 201P user manual
Web Site
[35] http://vertex.berkeley.edu/Me221/mas2/html/processes/edm/index.html [36] www.sciencedirect.com
[37] www.springerlink.com [38] www.nlreg.com [39] www.encyclopidiya.com
Company buyer