The Influence of Variations in State Composition and
Transition Matrix on the Performance of the
HMM-based Model exon DNA Controller
SuhartatiAgoes
1, Alfred Pakpahan
2, BintiSolihah
31Electrical Engineering Department, Faculty of Industrial Technology, Trisakti University 2Department of Biology, Faculty of Dentistry, Trisakti University 3
Informatic Technology Department, Faculty of Industrial Technology, Trisakti University Trisakti University, Jalan Kyai Tapa Grogol Jakarta 11440, Indonesia Email: [email protected],[email protected], [email protected]
Abstract-- In the development of a HMM model-based exon controller, data sets addition on training phase causes decrease on the model's accuracy if the training parameters are not reconfigured. The decline in accuracy is caused by the high insertion at intron and deletion in the exon region. It shows the influence of the state definition, transition matrix and data sets on the performance of the resulting model. In this research, the analyses of the performance of the two HMM-based models with 20 states structure that are developed base on the previous HMM-based exon controller model, are conducted. In the first model, the nucleotides are distributed to the entire state. In the second model, the sum of nucleotides in the certain state is determined. The data sets for training and testing model are DNA Plasmodium falciparum data with two exons. They are taken from GenBank database. At the first step, characteristics of data are identified based on the length distribution of the first exon, the second exon, and introns. Testing of the model is conducted to identify the performance of the model based on the Correlation Coefficient (CC) and the distribution of insertion and a deletion in the exon and intron position. It aims to identify high incompatibility of the model to the data. The last step, the relationship between state composition, the determination of the
transition and decreasing of the model accuracy is analyzed.The
result analysis of the model shows the dependence of accuracy of model to the invisible pattern of the DNA data. State composition by determining the nucleotide population in each state in the first model gives better performance compared to just distribute the number of nucleotide among the state in the second model. The analysis result can be used as the foundation of the importance of the data sets clustering in the model development process so that the model contains sub-models, each for specific data set.
Index Term
--
HMM, State Composition, Transition Matrix, Exon DNA Controller, CC1. INTRODUCTION
Genome annotation is a an open area for researcher. One of the processes that can be categorized in genome annotation is the prediction of genes . Gene prediction aims to identify protein-coding genes on the DNA chain , identification of functional elements such as RNA , and regulatory functions [ 1 ] . The main problem in gene prediction accuracy is still low and most of the models
intended for specific genes . Several techniques have been developed for gene prediction is HMM -based techniques , such as GENSCAN , AUGUST and GENIE [ 2 ] .
In the gene prediction , state and transition probabilities have biological significance . State relating to the definition of the start codon , stop codon , introns beginning and end of the intron , and the exon and intron bases . Transition probabilities associated with changes in the function of a base of introns into exons and vice versa [ 1 ] .
One of the problems that can be categorized in the gene prediction is control of exon, which is the principle of modeling the exon intron positions from pre-existing genes to identify exon-intron from a sequence. One of the exon controllers that have been developed is developed on
Plasmodium falciparum DNA for random exons [3] and a
special two exons [4]. In [4] a model improved by adding data clustering technique to identify clusters of data input.
In this research, an analysis of the models that have been developed in [3] to identify the cause of the decline in accuracy on the addition of training data. The analysis is done by identifying the relationship between exon and intron length distribution with the distribution of the insert and deletion in the predicted results. Based on these results, further development of the model conducted by composed the state with two methods. The first method, bases in exon divided equally in a state other than the state-state control. The second method, the number of bases in the state is determined by considering the amount of bases forming protein. Furthermore, the performance of models built using the value of the correlation coefficient (CC) in the analysis phase is to identify the model of the distribution of insert and deletion in the predicted results.
In the next section will discuss the development of models and analysis of older models and modified models.
accuracy of the HMM models is the determination of the state and transition probabilities.
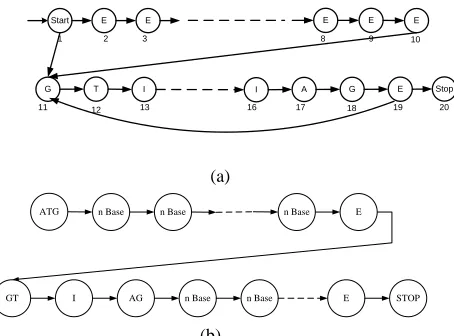
Consequently, state and transition probabilities in the HMM models adapted to the structure of the genes. The structure of eukaryotic gene used was adapted from [7,8] is shown in Figure 1 as the area code for proteins called CDS consisting of one or more exons. Area exon begins with
the start site ATG and TAA or TAG stop site or TGA. Intron area is bounded by GT and AG base.
Fig. 1. The structure of eukaryotic genes [7]
3. DEVELOPMENT OF A STATE MODEL AND INITIALIZATION OF TRANSITION MATRIX.
In [3], as shown in Figure 2 there is state control of the state to the start codon, stop codon, two bases marker for starting intron and ending by two bases.
Furthermore base distribution is done by filled the states beside the control state with each two bases except the final state before the beginning and the end of intron. Therefore the last state of the exon and intron contains a lot of bases. Determination of the state in this way affects the transition probability matrix initialization.
Start E E E E E
G T I I A G E Stop
2
1 3 8
17
9 10
11 12 13 16 18 19 20
(a)
n Base n Base n Base
AG
ATG E
GT I n Base n Base E STOP
(b)
Fig. 2. Proposed Model (a) initial model [3] (b) expansion model
Development is done by changing the control state introns, initially, at [3.4] base that determine the early introns (GT) and the last intron (AG) has a number of its own state, whereas in its development, do merging so that G and T has a same number of state and then A and G also have the same number of states. Beside changing the state control, modification of the determination of the base member state. There are two methods were developed, distribute the bases evenly on all states other than state control and define the base population of each state by considering the formation of a codon. The first way is called a model Distribution of Bases in the Non-Control State (DBNCS), if a sequences possess long first exon s and the number of states for the first exon is E1, the number of bases for a state other than the state control
is expressed as p (e1) = . The second way is called State
Determination Based on Codon (SDBC), regardless of how long the sequence of the data set, determined the number of base state member is n, where n = 3 * i where i .
Principles of formation of the transition matrix models have been developed [3, 4] is the transition matrix element for the first state (i.e. the start codon) was made large and the probability of moving to the next state is made small. Transition matrix elements on state slightly base population is made small and large parts donated to the next state so that the state with the number of bases that have a lot of great transition probability value. DBNCS transition probability model, the transition matrix element that contains the distribution of the base evenly made has a probability value of moving to the next state is made smaller and because the number of bases in each state made the transition probabilities uniformly initialized with a great value. Transition probabilities for the model SDBC follow the model developed in [3]. Examples of transition matrix model SDBC and DBNCS shown in Figure 3.
(b)
Fig. 3a and 3b. Examples of the transition matrix for the first model and the second model
4. MODEL TEST RESULTS AND ANALYSIS
The results of the identification of the bases length positions on exons and introns experimental data, as shown in Figure 4, the largest population from the length of the first exon base is <100. The largest intron population is in the base length between 100 up to 300, while second exon in the range of 800 up to 1000.
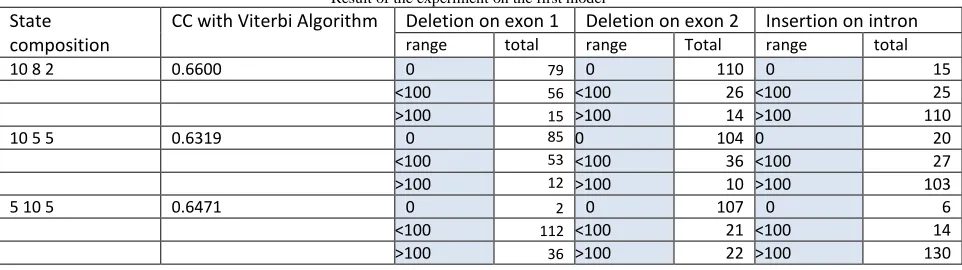
Performance of the model is determined based on the value of CC as in [1]. To identify the relationship between the value of the CC with occurrences insert-delete, conducted trials with the experimental results shown in Table 1, Table 2 and Table 3 From the whole experiment in general, the low accuracy of
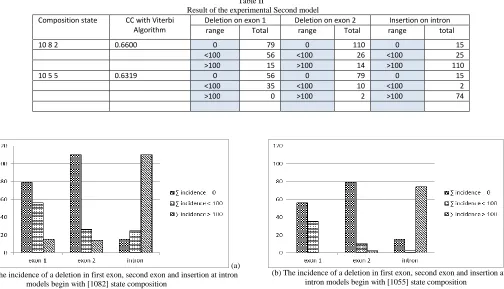
the model due to the high incidence of insertion at intron regions. This is demonstrated by the high green bars on intron regions, as shown in Figure 5, Figure 6 and Figure 7. Table 1 shows the results of testing the model for some compositional state (state number for exon 1, intron number for the state, the amount of state to exon 2), namely [10 8 2], [10 5 5] and [5 10 5]. Test results show that the compositional state [10 8 2] gives the best accuracy, ie 0.6600. The use of compositional state [10 8 2] on the accuracy of model 2 also produces the same model with the model 1.
Fig. 4. Distribution of the length of first exon, second exon and intron on the experiment data set.
Table I
Result of the experiment on the first model
State composition
CC with Viterbi Algorithm Deletion on exon 1 Deletion on exon 2 Insertion on intron
range total range Total range total
10 8 2 0.6600 0 79 0 110 0 15
<100 56 <100 26 <100 25
>100 15 >100 14 >100 110
10 5 5 0.6319 0 85 0 104 0 20
<100 53 <100 36 <100 27
>100 12 >100 10 >100 103
5 10 5 0.6471 0 2 0 107 0 6
<100 112 <100 21 <100 14
(a) The incidence of a deletion in first exon, second exon and insertion at intron models begin with [10 8 2] state composition.
(b) The incidence of a deletion in first exon, second exon and insertion at intron models begin with [10 5 5] state composition.
(c) The incidence of a deletion in first exon, second exon and insertion at intron models begin with [5 10 5] composition state. Fig. 5.(a),(b),(c) Distribution of deletion and insertion in CDS of First Model with different state composition
Table II
Result of the experimental Second model
Composition state CC with Viterbi Algorithm
Deletion on exon 1 Deletion on exon 2 Insertion on intron range Total range Total range total
10 8 2 0.6600 0 79 0 110 0 15
<100 56 <100 26 <100 25
>100 15 >100 14 >100 110
10 5 5 0.6319 0 56 0 79 0 15
<100 35 <100 10 <100 2
>100 0 >100 2 >100 74
(a) The incidence of a deletion in first exon, second exon and insertion at intron
models begin with [1082] state composition
(b) The incidence of a deletion in first exon, second exon and insertion at intron models begin with [1055] state composition
Table III
Result of the experiment on the Third model
Composition state CC with Viterbi Algorithm
Deletion on exon 1 Deletion on exon 2 Insertion on intron range Total range Total range total
10 8 2 0.6998 0 0 0 74 0 2
<100 99 <100 25 <100 16
>100 8 >100 9 >100 90
10 8 2 0.7988 0 36 0 66 0 1
<100 84 <100 49 <100 18
>100 4 >100 11 >100 107
(a) The incidence of a deletion in first exon, second exon and insertion at intron models 3 begin with [1082] composition state iteration 1.
(b) The incidence of a deletion in first exon, second exon and insertion at intron models 3 begin with [1082] composition state iteration 2.
Fig. 7.(a),(b), Distribution of deletion and insertion in CDS of Third Model with different state composition
In Table 3 are shown the results of experiments for model 3 with the following scenario: a model trained with a data set of 150. By using the best state composition used in model 1 and model 2, then in subsequent experiments conducted trials to model 3 models and generate better accuracy compared with model 1 and model 2.
The next step is to identify number of the data sets that do not fit to the models will be eliminated once the data is cleaned from the data items which are then carried to the two training phases. After the evaluation, the resulting value of CC is higher. This suggests a strong relationship between the characteristics of the data sets with the model accuracy. Data with the same characteristics will result in a model that is fit for the data group. It can be used as the basis of further development of a model which consists of sub-models that fit the specific characteristics of the data.
5. CONCLUSIONS
The Analysis result of influence of variation in state formation and transition matrix on the performance of HMM-based exon controller model can be resumed as follow:
1. Composition that produces optimum accuracy is achieved by pay attention at the length distribution of exons and introns in the data set.
2. The number of insertion at intron indicates that this event is the largest component causes a decline in the value of CC.
3. The magnitude of the percentage insertion indicates that there are opportunities for the development of specific models introns.
4. Development of a model with SDBC method produces a model that is more stable than the DBSNC method if refined by eliminating data that deviate too far from the model.
5. The process data elimination and retraining the models can generate in better performance for a specific data group.
ACKNOWLEDGEMENTS
Thank you for funds dedicated to the Directorate of Higher Education, Ministry of Education Goverment of Indonesiafor research grant that has been given so that this research can be conducted and the Trisakti University Research Institute for their supports.
REFERENCES
[1] Goel,N., Singh, S., and Aseri, C.T., A Review of SoftComputing Technique for Gene Prediction, ISRN Genomic, Volume 2013, Article ID 191206, http://dx.doi.org/10.1155/2013/191206. [2] Stanke,M., and Waack, S., Gene Prdiction with a Hidden Markov
Model and a new Intron Submodel,
[3] Agoes, S., Pakpahan, A., Solihah, B., “Performance of Hidden Markov Model Structure on Deoxyribo Nucleic Acid Coding Sequence of Plasmodium falciparum”, Asian Transactions on Science & Technology (ATST)”, Volume 01, Issue 05, 2011. [4] Agoes, S., Pakpahan, A., Solihah, B., Analysis on Clustering
falciparum for Performance Improvement, International Journal of Engineering & Technology IJET-IJENS”, Vol: 14, No: 01 [5] Yada Tetsushi, Hirosawa Makoto, Gene recognition in
cyanobacterium genomic sequence data using the hidden Markov model, Proceeding International Conference Intell. Syst. Mol. Biol, Vol 4, pp 252-260, 1996.
[6] Yada Tetsushi, Hirosawa Makoto, Detection of short protein coding regions within the cyanobacterium genome: application of the hidden Markov model, DNA. Res. Vol 31, Issue 6, pp 355-361, 31 Desember, 1996.
[7] Huson, D., Gene Prediction Using HMM, Grundlgen der Bioinformatik, SS’09, Juli 2009, page 150 to 159.