Research Article
CODEN: IJPNL6
STATISTICAL OPTIMIZATION OF KETOPROFEN TABLETS COMPRESSION
COATED WITH
ASSAM BORA RICE
STARCH/ETHYL CELLULOSE MIXTURE FOR
COLONIC DRUG DELIVERY
Nirmala Devi*
1, Manju Sharma
2 1Shridhar University Pilani-Chirawa Road, Pilani-333 031 (Rajasthan)
2Faculty of Pharmacy, Jamia Hamdard, New Delhi
*Corresponding author e-mail: [email protected]
ABSTRACT
The aim of this work was to prepare and optimise the ketoprofen colon targeted compression coated tablet using mixture of Assam bora rice starch and ethyl cellulose as coating agent. 32 factorial designs was used to study the effect of ethyl cellulose content (X1) and coating level (X2) on the release of ketoprofen from colon targeted tablet. Dissolution study was performed in pH1.2 for 2 hr, pH 7.4 for 3 hr and goat caecal medium for 5 hr. Multiple linear regression analysis was used for generation of polynomial equation and optimization of formulation. The optimized formulation consisted of ethyl cellulose (31.39 %) and coating level (416.8 mg) provided a release profile that is closed to estimated values.
Keywords: Assam bora rice, colon drug delivery, 32factorial design, ketoprofen, optimization.
INTRODUCTION
The development of colon-specific delivery has attained more importance for the delivery of drugs to treat the local diseases of colon such as irritable bowel syndrome, inflammatory bowel disease (IBD), Crohn’s disease, ulcerative colitis and colon cancer, as well as to increase systemic absorption of polypeptides and many other drugs susceptible to enzymatic digestion in the upper gastrointestinal (GI) tract[1, 2]. The various approaches utilised for colon targeted drug delivery include pro drug, time-dependent system, pH-time-dependent coating, GI pressure-dependent capsules and colonic bacterial degradable formulation. Among these approaches, colonic bacterial degradable formulations have been found to be the most reliable regarding specificity
[3-6]. In this respect, natural biodegradable
polysaccharides are widely used for colonic drug delivery due to their ability to act as specific substrates for the colonic microflora. The natural polysaccharides that have been employed include starch, guar gum [7, 8], amylose[9, 10], chitosan[11], pectin [12], khaya gum and albizia gums[13]. However,
due to their solubility and swelling properties in aqueous media, the drug is released during transit through the upper GI tract. The combined use of other strategies with polysaccharide such as coating with time dependent polymers is used to overcome the aforesaid drawback [14-16].
Assam Bora rice (Oryza sativa L, Japonica variety) is a variety of glutinous rice cultivated in the northern regions of Assam. Assam Bora rice starch is characterised by high amylopectin content (>95% of amylopectin) and good swelling property in aqueous medium [17]. Moreover, it is resistant to acid and upper GI tract enzymes, but is degraded by colonic bacteria. It is successfully established as direct compressible diluents[18], binder [19], mucoadhesive polymer [20] and plasma volume expander[21]. Additionally, it is used in the formulation of compression-coated tablet[22] and microbeads [23] to achieve colon-targeted delivery by researcher. Most of the compression coated colon targeted tablets have been prepared by the traditional experimental design approach of changing one variable at a time. It
International Journal of Pharmacy
requires large number of runs for optimisation of formulation. Factorial design is a widely practiced statistical approach in development and optimisation of pharmaceutical formulations with minimum trial. The factorial design provides a means to study simultaneously the effect of individual variables and their interactions at several levels with minimum experimentation and with less cost. The application of factorial design in pharmaceutical product development has been reported[24-29].
The aim of the study was to develop and optimize compression coated containing Assam bora rice
starch and ethyl cellulose as a colon-targeted delivery
system. ketoprofen was used as model drug. Anti-inflammatory activity and well known gastrotoxicity make ketoprofen a good candidate for colon targeted drug delivery. The effect of coating composition and coating level on the release profile of ketoprofen was investigated by utilizing a factorial design approach.
MATERIALS AND METHODS
Materials: Ketoprofen was received as a gift sample from alembic pharmaceuticals; India. Assam Bora rice was procured from local market of Assam. All other materials such as microcrystalline cellulose, cross linked polyvinyl pyrrolidone, corn starch, magnesium stearate and ethyl cellulose were purchased from SD Fine Chemicals Ltd.; Mumbai, India.
Experimental Design: A full factorial 32 design was used for optimization of compression coated tablet formulations. The studied independent variables (factors) were amount of ethyl cellulose (X1) and coating level (X2). The dependent variables (response) were percent drug release in 5 hr (Y1) and percent of drug release in 10 h (Y2). Independent and dependent variables are listed in table 1. The suggested nine formulations are listed in Table 2.
Extraction of starch from Assam Bora Rice:Starch from rice was extracted by using alkali extraction method. 100 gm rice flour dispersed in 1500 ml distilled water, pH adjusted to 10 with 1N NaOH and stand for 1 hr with frequent stirring. The dispersion was centrifuged with at 5000 rpm for 30 minute and filtered. The residue was consecutively extracted with 1000 ml of each distilled water and 2 % NaCl (each for 24 hr at 40C). After each extraction step slurry was centrifuged at 10000 rpm for 30 minute and filtered. The residue obtained after NaCl extraction
ethanol and heated on water bath at 80 0C for 1 hr. The suspension cooled to room temperature and allowed to settle for 4 hr at 4 0C. The residue was dried and powdered by passing through 125 µm sieves.
Preparation of Ketoprofen core tablet: Direct compression method was used to prepare ketoprofen core tablet. Each core tablet contains ketoprofen (50 mg), microcrystalline cellulose (60 mg) was used as direct compression vehicle. Mixture of magnesium stearate (1 %) and talc (2 %) was added as lubricant. All ingredients were blended and passed through 80 # sieve. Core tablets (diameter 6 mm, average tablet weight 120 mg) were compressed within 6 mm of punches on cadmach 16 station compression machine under a common compression force of 3-4 kg/cm2.The core tablets were evaluated for hardness, content uniformity, thickness, friability and disintegration time.
Coating of core tablets: The core tablets were compression coated with different ratio of Assam
Bora rice starch and ethyl cellulose. Half amount of
polymer blend was placed in the die cavity. The ketoprofen core tablet (diameter 6 mm) carefully positioned centrally in the die cavity, which was then filled with remaining half amount of polymer blend. The coating material was compressed around the core tablet within 12 mm of punches on cadmach 16 station compression machine under common compression force of 5-6 kg/cm2.
In vitro drug release study: The integrity of compression-coated tablets of ketoprofen in physiological environment of upper gastrointestinal tract was evaluated by performing dissolution study under condition mimicking mouth to colon transit environment. The In vitro drug release study of compression coated tablet was performed initially in 0.1 N HCl (900 ml) for 2 hr, then in pH 7.4 Sorensen’s phosphate buffer (900 ml) for 3 hr using the USP XXXIII type II apparatus (paddle apparatus TDL 08 L; Electrolab India Pvt Ltd, Mumbai, India) with a rotation speed of 100 RPM. At specified time points, 5 ml sample was taken, suitably diluted and analyzed for ketoprofen content using HPLC method. To study the effect of colonic environment on release behaviour of compression coated tablet, the drug release study was continued in goat cecal medium
[22]. The 900 ml of goat caecal content (collected from
anaerobic environment was maintained by continuous CO2 bubbling into the beaker. At regular intervals of time, 5 ml of the sample was withdrawn and replaced with 5 ml of goat caecal content medium bubbled with CO2. The release studies were continued for another 5 hours.
Selection of optimized formulation: Optimized formulation was selected on the basis of minimum drug release in 5hr, not less than 80 % release in 10 hr and with good desirability.
Validation of experimental design: Polynomial equations for both responses were generated using Design expert software version 7.0.0 (Stat-Ease, Inc, USA). The model was validated by preparing optimized formulation along with three random formulations covering the entire range of independent variables. The observed and predicated values of the responses were quantitatively compared. The linear regression analysis between observed and predicted values of the response was also performed using Graph pad prism 5.00.
RESULT AND DISCUSSION
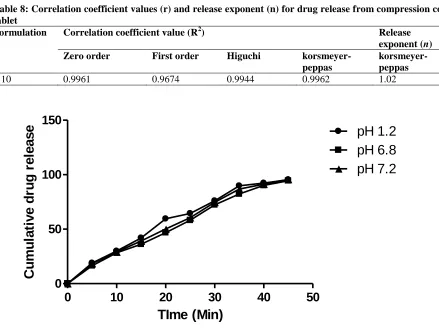
The ketoprofen core tablet was prepared by direct compression method. The average weight of core tablet was found to be 120±1.3 mg. The hardness was found to be in the range of 3-4 kg/cm2. Weight loss in friability test was found to be less than 0.5 %, indicating compliance with acceptance limit. The mean drug content of core tablet was found to be 98.23±1.39 %.The core tablets were also found to comply with the disintegration test as the core tablet disintegrate within 15 minute. The thickness of core tablet was found to be 1.64± 0,04 mm. The drug release profile (Fig 1) of core tablet in various medium (pH 1.2, 6.8, 7.2) shows no lag time. More than 75 % of the drug was found to be released within the initial 30 minutes.
The main aim of this work was to optimize a compression coated tablet using Assam bora rice
starch and ethyl cellulose for colonic delivery. A 32 factorial design was utilized to determine the effect of independent variables on dependent variables. The independent (factor) and dependent (response) variables are shown in table 1. The experimental run and respective observed values are shown in table 2. The dissolution of coated formulations was performed at pH 1.2 for 2 hr, pH 7.4 for 3 hr and in goat cecal content (pH 6.8) till 10 hr. The ideal colonic delivery required drug release in colonic environment without any release in upper gastrointestinal tract. Therefore drug release in 5 hr
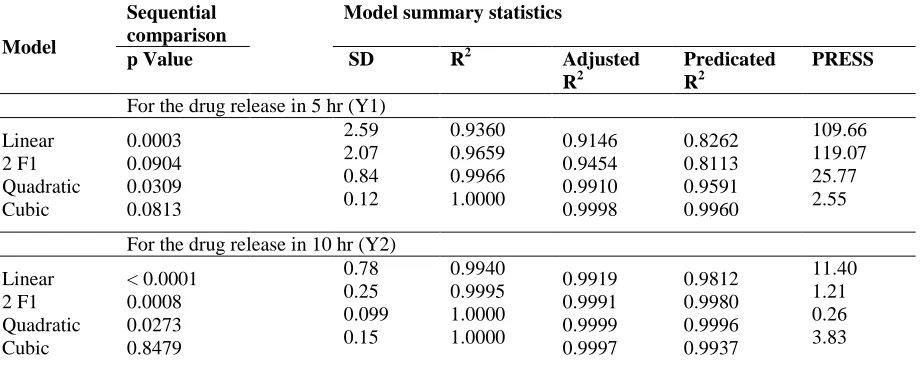
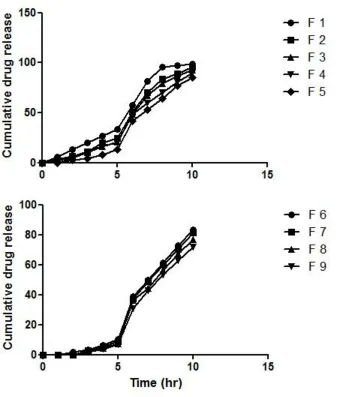
(Upper GIT) and drug release in 10 hr were selected as dependent variables in the study. Dissolution profiles of 9 trial formulations are shown in figure 2. Formulation showed drug release in 5 hr ranged from 6.84 % (F 9) to 33.14 % (F 1) and drug release in 10 hr ranged from 72.52 % (F9) to 98.42 % (F 1). The observed values of responses were analysed by design expert software. All the response values were fitted to linear, 2 F1, quadratic and cubic model by design expert. Selection of best fit model was based on the several statistical parameter comparison which included R2, p value, SD and PRESS value. The probability value (α) was fixed at 0.05 which indicates term would be significant if the p value is less than 0.05. Model summary statics and sequential model comparison was given in table 3.
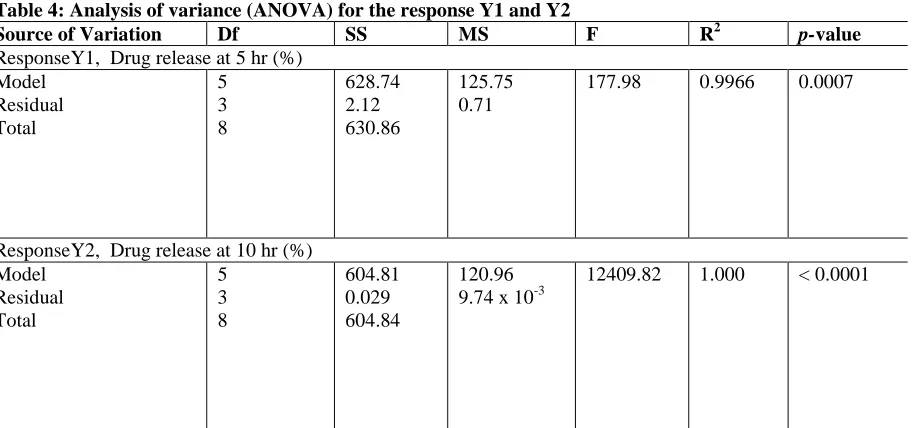
As shown in table 3 linear and quadratic models were stastically significant (p value: 0.003 and 0.0309 respectively) for response Y1 (Q5). For response Y2 (Q10); linear, 2F1 and quadratic models were stastically significant (p: < 0.0001, 0.0008 and 0.0273 respectively). For both responses Y 1 and Y2 , quadratic model had smaller standard deviation, larger R2value and smaller PRESS value than other statistically significant model and was selected as best fit model. Result of analysis of variance (ANOVA) for both responses is shown in table 4. Larger F value and high R2 value, which further illustrates the suitability of quadratic model.
The polynomial equations for response Y 1 and Y 2 are as follows:
Coefficient of factors and corresponding p values are listed in table 5. The term was found to be non-significant for response Y2. Backward elimination method was used for model reduction. The equation for reduced model (RM) for the response Y2 is given below
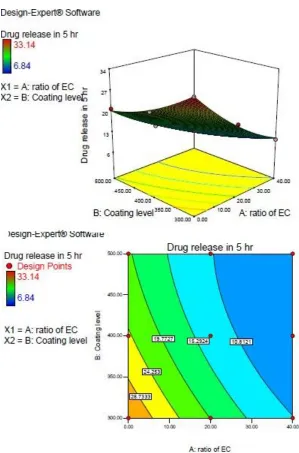
by coating layer and reduces mobilization of macromolecules. Coating level had also negative effect on Y1. This is ascribed due to increase in diffusion path length with increase in coating level. As shown in table 5, the value of coefficient of X1 was higher, which indicated that ethyl cellulose content was most influencing factor for response Y1. The effect of factors on response Y1 was schematically represented in figure 3 as 3 D response surface plot and contour plot.
The ethylcellulose content and coating level had significant effect on response Y2. Ethyl cellulose content, coating level and interaction term (X1X2) had negative effect on response Y2. Starch was rapidly degraded in colonic medium by colonic enzymes and ethyl cellulose is non degradable. The drug release in colonic medium was decrease with increase in ethyl cellulose content. Ethyl cellulose decreases disruption in coat layer. Coat level showed antagonistic effect on response Y2. It is ascribed due to increase in durability of coat in colonic medium with increase in coat level. The ethyl cellulose content has greater influence on response Y2 as compare to coat level. The graphical representation of effect of both factor on responses showed in figure 4, as 3 D response surface plot and contour plot. The numerical optimisation of compression coated tablets based on desirability approach is performed to obtain the levels of factor X1 and X2, which release drug in colon with minimum drug release in upper GIT. To attain this goal, constraints were placed on responses so that minimize drug release in 5 hr and not less than 80 % drug release in 10 hr. The constraints, optimized level of factors and predicated responses are shown in table 6 and figure 5.
To validate the polynomial mathematical model, dissolution of optimized formulation and three random formulations covering the entire range of independent variables were performed. For each of these formulations, value of X1 and X2 were substituted to estimate response Y1 and Y2. Table 7 shows the experimental condition of random formulations, predication and observed value of
responses along with percentage prediction error. Linear correlation curve (fig.6) between observed and predicated responses, establish a close agreement (r2> 0.98). Robustness of mathematical model is demonstrated by significant value of r2 and lower value of percentage predication error (-2.96- 2.80 for response Y1 & -1.05- 3.48 for response Y2.
The dissolution profile of optimised formulation (F10) is shown in figure 7. To determine drug release kinetic from compression coated tablet, drug release data of optimized formulation (F 10) was analyzed using zero order, first order and higuchi’s equation. The best fits kinetic model was selected by comparing the correlation coefficient ( 2) values obtained in various models. Further drug release data was fitted according to korsmeyer-peppas equation to illustrate drug release mechanism and mechanisms of drug release are characterized using the release exponent (“ ” value). An “n value” less than or equal to 0.5 means Fickian diffusion; greater than 0.5 and less than 1 correspondence anomalous (non-Fickian) diffusion release model; equal to 1 indicates to zero-order release kinetics (case II transport); and greater than 1 means a super case II transport relaxation. Result of drug release kinetic analysis is shown in table 8 and figure 8.
As table 8 shows the most best fitted release kinetic was zero order. The “ ” value of F 10 was found to be 1.02 which also implies zero-order release kinetics (case II transport). Zero-order kinetic is the ideal for controlled drug release and ascribed to time-dependant erosion of the gelled Assam bora rice
starch/ethyl cellulose layer.
CONCLUSION
Table 1: Independent and dependent variables of the 32 factorial design
Independent variables Level
-1 0 +1
X1 = Ratio of ethyl cellulose (%) X2 = Coating level (mg)
0 300 20 400 40 500
Dependent variables Constraints
Lower Limit Upper Limit Goal Y1 = Drug release in 5 hr (%)
Y1 = Drug release in 10 hr (%)
6.84 72.52
33.14 98.42
minimize Target ≥ 80
Table 2: 32 Factorial design lay out and observed responses
Std order Formulation Independent variables
(Factor)
Dependent variables (Response)
X1 X 2 Y1 Y2
1 2 3 4 5 6 7 8 9 F 1 F 2 F 3 F 4 F 5 F 6 F 7 F 8 F 9 -1 -1 -1 0 0 0 1 1 1 -1 0 1 -1 0 1 -1 0 1 33.14 24.26 20.86 20.31 13.50 10.34 10.43 7.37 6.84 98.42 95.41 93.10 89.85 85.82 82.80 81.49 76.78 72.52
X1 indicates ratio of ethyl cellulose (%); X2 indicates coating level (mg); Y1 indicates Percentage Drug release at 5 hr (Q 5); Y2 indicates Percentage Drug release at 10 hr (Q 10).
Table 3: Model summary statistics and corresponding p value (Sequential model comparison) for the drug release in 5 hr (Y1) and the drug release in 10 hr (Y2)
Model
Sequential comparison
Model summary statistics
p Value SD R2 Adjusted
R2
Predicated R2
PRESS
For the drug release in 5 hr (Y1) Linear 2 F1 Quadratic Cubic 0.0003 0.0904 0.0309 0.0813 2.59 2.07 0.84 0.12 0.9360 0.9659 0.9966 1.0000 0.9146 0.9454 0.9910 0.9998 0.8262 0.8113 0.9591 0.9960 109.66 119.07 25.77 2.55 For the drug release in 10 hr (Y2)
Linear 2 F1 Quadratic Cubic < 0.0001 0.0008 0.0273 0.8479 0.78 0.25 0.099 0.15 0.9940 0.9995 1.0000 1.0000 0.9919 0.9991 0.9999 0.9997 0.9812 0.9980 0.9996 0.9937 11.40 1.21 0.26 3.83
Table 4: Analysis of variance (ANOVA) for the response Y1 and Y2
Source of Variation Df SS MS F R2 p-value
ResponseY1, Drug release at 5 hr (%) Model Residual Total 5 3 8 628.74 2.12 630.86 125.75 0.71
177.98 0.9966 0.0007
ResponseY2, Drug release at 10 hr (%) Model Residual Total 5 3 8 604.81 0.029 604.84 120.96 9.74 x 10⁻³
12409.82 1.000 < 0.0001
DF indicates: degrees of freedom; SS, sum of squares; MS, mean of squares; F, fischer's ratio; R2 , regression
coefficient..
Table 5: Coefficient and p-value of each factor, for response Y1 and Y2
Factor Y1
Drug release at 5 hr (%)
Y2
Drug release at 10 hr (%)
Coefficient p-value Coefficient p-value
X1 X2 X12 X12
X22
-8.94 -4.31 2.17 2.43 1.94 0.0001 0.0011 0.0140 0.0264 0.0468 - 23.41 - 5.85 - 2.64 8.53 1.04 < 0.0001 < 0.0001 0.0003 0.1595 0.0141
Significant factor (p < 0.05).All bold values have p- value > 0.05, hence considered insignificant.
Table 6: Constraints, level of factors and predicated responses for optimization of compression coated tablets (F10).
Constraints
Name Goal Lower limit Upper Limit
Amount of ethyl cellulose (%)
In range 0 40 Coating Level In range 300 500 Cumulative drug release at 5
hr (%)
minimize 6.84 33.14 Cumulative drug release at
10 hr (%)
Target ≥ 80 72.52 98.42
SOLUTION (F 10)
Amount of ethyl cellulose (%)
Coating Level Cumulative drug release at 5hr (%)
Cumulative drug release at 10 hr (%)
Table 7: Comparison between observed and predicated value for response Y1 (Percentage Drug release at 5 hr) and Y 2 (Percentage Drug release at 5 hr) for different check points
S.no Experimental trial
Factors (Coded)
Response Observed
value
Predicated value
Percent predication error
X1 X2
1 0.572 0.15 Y 1 Y 2
8.92 80.91
8.67 80.00
2.80 3.48 2 -0.80 0.5 Y 1
Y 2
19.39 91.52
19.58 92.16
- 0.97 - 0.69 3 0.8 -0.5 Y 1
Y 2
9.48 81.89
9.59 80.75
- 1.16 -1.05 4 0.2 -0.2 Y 1
Y 2
12.16 85.62
12.52 84.89
- 2.96 0.85
Percent predication error was calculated by using formula
Table 8: Correlation coefficient values (r) and release exponent (n) for drug release from compression coated tablet
Formulation Correlation coefficient value (R2) Release
exponent (n)
Zero order First order Higuchi
korsmeyer-peppas
korsmeyer-peppas
F 10 0.9961 0.9674 0.9944 0.9962 1.02
Figure 1:
In vitro
drug release profile of core tablet at pH 1.2, pH 6.8 & pH 7.2
0
10
20
30
40
50
0
50
100
150
pH 1.2
pH 6.8
pH 7.2
TIme (Min)
C
u
m
u
la
ti
v
e
d
ru
g
r
e
le
a
s
Figure 6: Linear correlation curve (A & B) between observed and predicated value for response Y1 (drug release at 5 hr) and Y2 (drug release at 10 hr)
REFERENCES
1. Rubinstein A. Drug Discovery Today: Technologies,2005;2 (1): 33-37. 2. Friend DR. Advanced Drug Delivery Reviews,1991;7 (1): 149-99.
3. Ugurlu T,Turkoglu M,Gurer US.Akarsu BG. European Journal of Pharmaceutics and Biopharmaceutics, 2007;67 (1): 202-10.
4. Mladenovska K,Raicki RS,Janevik EI,Ristoski T,Pavlova MJ,Kavrakovski Z,Dodov MG.Goracinova K. International Journal of Pharmaceutics,2007;342 (1–2): 124-36.
5. Das S.Ng K-Y. International Journal of Pharmaceutics,2010;385 (1–2): 20-28.
6. Prasad YVR,Krishnaiah YSR.Satyanarayana S. Journal of Controlled Release,1998;51 (2–3): 281-87. 7. Krishnaiah YSR,Satyanarayana S,Rama Prasad YV.Narasimha Rao S. International Journal of
Pharmaceutics,1998;171 (2): 137-46.
8. Krishnaiah YSR,Satyanarayana V,Dinesh Kumar B,Karthikeyan RS.Bhaskar P. European Journal of Pharmaceutical Sciences,2003;19 (5): 355-62.
9. Milojevic S,Newton JM,Cummings JH,Gibson GR,Louise Botham R,Ring SG,Stockham M.Allwood MC. Journal of Controlled Release,1996;38 (1): 85-94.
10. Siew LF,Man S-M,Newton JM.Basit AW. International Journal of Pharmaceutics,2004;273 (1–2): 129-34. 11. Shimono N,Takatori T,Ueda M,Mori M,Higashi Y.Nakamura Y. International Journal of Pharmaceutics,
2002;245 (1–2): 45-54.
12. Ahrabi SF,Madsen G,Dyrstad K,Sande SA.Graffner C. European Journal of Pharmaceutical Sciences, 2000;10 (1): 43-52.
13. Pachuau L.Mazumder B. International Journal of Biological Macromolecules,2013;61 (0): 333-39.
14. Cummings JH,Milojevic S,Harding M,Coward WA,Gibson GR,Louise Botham R,Ring SG,Wraight EP,Stockham MA,Allwood MC.Newton JM. Journal of Controlled Release,1996;40 (1–2): 123-31.
15. Siew LF,Basit AW.Newton JM. European Journal of Pharmaceutical Sciences,2000;11 (2): 133-39. 16. Elkhodairy KA,Afifi SA.Zakaria AS. BioMed Research International,2014;2014: 182-97.
17. Ahmad MZ,Akhter S,Anwar M,Rahman M,Siddiqui MA.Ahmad FJ. Powder Technology,2012;224 (0): 281-86.
18. Ahmad MZ,Akhter S,Dhiman I,Sharma P.Verma R. Expert Opinion on Drug Delivery,2012;10 (2): 163-71. 19. Rajak P,Nath LK.Bhuyan B. International Journal of Pharmacy and Pharmaceutical Sciences, 2014;6 (5):
118-20.
20. Sachan kN.Bhattacharya A. International Journal of Pharmacy and Pharmaceutical Sciences,2009;1 (1): 96-102.
21. Ahamad MZ.Bhattacharya A. Curr. Drug Deliv.,2010; 7: 162-67.
22. Ahmad MZ,Akhter S,Anwar M,Singh A,Ahmad I,Ain MR,Jain GK,Khar RK.Ahmad FJ. Current Drug Delivery,2012;9: 105-10.
23. Ramteke KH.Nath L. Advanced Pharmaceutical Bulletin,2014;4 (2): 167-77.
24. Snorradóttir BS,Gudnason PI,Thorsteinsson F.Másson M. European Journal of Pharmaceutical Sciences, 2011;42 (5): 559-67.
25. Elmizadeh H,Khanmohammadi M,Ghasemi K,Hassanzadeh G,Nassiri-Asl M.Garmarudi AB. Journal of Pharmaceutical and Biomedical Analysis,2013;80 (0): 141-46.
26. Sood S,Jain K.Gowthamarajan K. Colloids and Surfaces B: Biointerfaces,2014;113 (0): 330-37. 27. Sun Y,Peng Y,Chen Y.Shukla AJ. Advanced Drug Delivery Reviews,2003;55 (9): 1201-15.
28. Vora C,Patadia R,Mittal K.Mashru R. International Journal of Pharmaceutics,2013;455 (1–2): 169-81. 29. Akhgari A,Afrasiabi Garekani H,Sadeghi F.Azimaie M. International Journal of Pharmaceutics, 2005;305