R E S E A R C H
Open Access
Comparative evaluation of enamel surface
roughness after debonding using four
finishing and polishing systems for residual
resin removal
—
an in vitro study
Priyanka Shah
*, Padmaja Sharma, Santosh Kumar Goje, Nikita Kanzariya and Maitry Parikh
Abstract
Background:Orthodontic bonding and debonding procedures involve risk of damaging the enamel surface and changing its original morphology. The rough surface inhibits proper cleaning, invites plaque deposition, bacterial retention, and stain formation thus dampening the esthetic appearance of the teeth. Restoring the enamel to its original morphology is a challenge. Researches on better adhesive removal methods which can effectively remove the residual resin and restore it best to its original form are continuing till date. No study has compared four contemporary finishing systems for their efficiency on a single platform.
Aim:The objective of this study is to evaluate and compare enamel surface roughness after debonding using four
different finishing and polishing systems.
Material and methods:Adhesive resin was removed from the buccal surface of 88 premolars after debonding with 4 groups. It included 22 teeth per group: group 1—One gloss system; group 2—Enhance finishing and polishing system; group 3—fiber reinforced stainbuster bur; and group 4—Soflex discs with wheels. Roughness was measured quantitatively and qualitatively with the help of surface roughness tester and scanning electron
Microscope (SEM) respectively.
Results:No significant difference was found in baseline roughness in four groups. Highest post-polishing roughness was observed in Soflex group (4.62μm) followed by One gloss system (3.36μm), Enhance system (3.17μm), and stainbuster bur (1.99μm) (pvalue < 0.01).
Conclusion:Stainbuster bur created the smoothest enamel surface that was close to the natural enamel followed by Enhance system, One gloss system, and Soflex disc and wheels.
Keywords:Stainbuster, Enamel roughness, Scanning electron microscopy, Enhance and Pogo polisher, One gloss, Soflex discs
Introduction
Debonding is a procedure of removing orthodontic at-tachments along with the entire residual adhesives from the surface of enamel following orthodontic treatment completion. The objective of the orthodontists should be to restore the surface of enamel as closely as possible to
natural enamel without inducing iatrogenic injury and with minimal loss of enamel structure [1].
The surface structure of natural enamel has micro-roughness in the range of 0.59 to 0.66 μm [2]. Bonding of brackets on enamel involves surface etching, application of primer, and adhesive. All these steps involve the risk of damaging the enamel surface and changing its original morphology. Upon completion of orthodontic treatment, the debonding procedure followed by residual resin removal further damages the enamel, producing scratches, cracks, grooves, removal of fluoride-rich
© The Author(s). 2019Open AccessThis article is distributed under the terms of the Creative Commons Attribution 4.0 International License (http://creativecommons.org/licenses/by/4.0/), which permits unrestricted use, distribution, and reproduction in any medium, provided you give appropriate credit to the original author(s) and the source, provide a link to the Creative Commons license, and indicate if changes were made.
* Correspondence:piyushah7874@gmail.com
external enamel layer, and increasing the enamel rough-ness. The rough enamel surface inhibits proper cleaning and thus invites plaque deposition, bacterial retention, stain formation, and thus dampening the esthetic appear-ance of the teeth. Restoring the enamel to its original morphology is a challenge [3].
A variety of mechanical methods have been proposed to achieve satisfactory resin removal with least possible en-amel damage following bracket debonding. These include band removing pliers, hand scalers, ultrasonic cleaning, intraoral sandblasting, sandpaper discs, diamond burs, stainless steel burs, rubber cups, tungsten carbide burs (fine or super fine grit, low or high speed, various flutes), lasers, and composite burs [4,5].
Numerous methods are available to assess the enamel damage such as scanning electron microscopy (SEM), stereo microscopy, contact profilometry, a non-contact white light 3D profilometry, or atomic force microscopy (AFM) [4,6].
In contemporary orthodontic practice, four finishing and polishing systems are being widely used. The One gloss complete system (Shofu Dental Corporation, Japan) uses a high concentration of aluminum oxide with sili-cone as a binder [7]. The Enhance finishing and Pogo polishing system (Dentsply, Milford, USA) is also widely used and is made up of polymerized urethane dimetha-crylate resin, aluminum oxide, silicon dioxide, and fine diamond powder [8].
A new innovative composite bur enriched with zircon-rich glass fiber has gained attention. This fiber-reinforced composite bur, Stainbuster (Abrasive Technology Inc., Lewis Centre, Ohio), is also studied and compared with other systems though not extensively and with mixed results [9].
Lastly, the 3M Soflex system (3 M ESPE, St. Paul, MN, USA) which includes finishing discs and the most recently introduced Soflex spiral wheels are also being used by orthodontists. The discs are made up of aluminum oxide particles from coarse to superfine (50 to 80 μ), whereas the spiral wheels are made up of diamond particles im-pregnated in thermoplastic elastomer [10,11].
There is no study wherein all these four contemporary finishing and polishing systems have been compared at one platform to assess the extent of enamel surface roughness after finishing and polishing. Thus, the aim of our study is to evaluate and compare enamel surface roughness after debonding using Shofu One gloss, Dentsply Enhance finisher and Pogo polisher, Fiber rein-forced Stainbuster bur, and 3M Soflex discs and spiral wheels for residual resin removal.
Methods
The study was carried out in the Department of Ortho-dontics, K. M. Shah Dental College & Hospital, Vadodara
in collaboration with Ahmedabad Engineering Re-search Institute, Ahmedabad and Metallurgical & Ma-terial Engineering Department, Faculty of Technology and Engineering, The M.S. University of Baroda, Vadodara.
Selection criteria included extracted premolars with intact buccal surface. Premolars with (1) carious lesions, (2) restorations, (3) visible cracks, and (4) hypoplasia were excluded.
Assuming that the significant difference required be-tween two groups in relation to mean roughness is 0.33 μm based on the values obtained from previous study [4]. Sample size in this study was calculated using significance level of 0.05 and power of 80% to detect meaningful differences among mean values of four groups. It showed that minimum of 88 samples (22 per group) were required. Figure 1 illustrates four groups. Table1describes four groups used for roughness check.
The sample of 88 premolars extracted for orthodontic purpose was procured as per the inclusion criteria. The teeth were washed under running water to cleanse the soft tissue remnants and stored in 0.1% thymol for disin-fection. Then the teeth were mounted in Plaster of Paris leaving the crown of the teeth visible.
The 88 mounted teeth were randomly divided into 4 groups of 22 each for residual resin removal. The randomization was done using computer randomization method (Research Randomization Program).
Buccal surfaces of teeth on the area where bracket is bonded were evaluated with the help of surface rough-ness tester (Baseline roughrough-ness data). Two measure-ments for each specimen were measured and mean was calculated.
The surface roughness is measured using the following three parameters [9]: (Fig.2)
1. Ra:Rais the average roughness. It is the arithmetic
mean deviation of the surface valleys and peaks from the center line in the measuring length. 2. Rt:Rtis the maximum roughness height.Rtis
defined as the maximum peak to valley height over the length of sample.
3. Rz:Rzis the mean roughness depth.Rzis the mean
vertical space linking the highest peak and the deepest valley of five closest measuring sections.
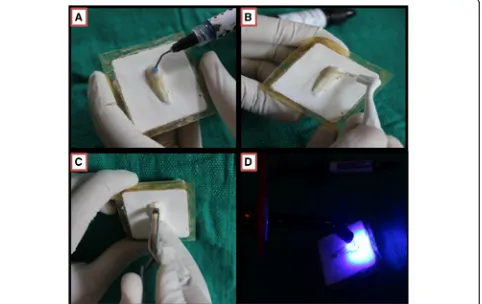
The teeth were polished with pumice slurry and rub-ber cup. Then they were rinsed with water and dried with compressed air. The buccal surface of the teeth was etched with 37% phosphoric acid for 30 s, rinsed, and air dried (Fig.3a).
This was followed by primer application on the tooth surface and light cured for 10 s (Fig. 3b). A layer of Vaseline was applied on the mesh of the
brackets to avoid composite adhesion to the base of bracket. This will permit easy removal of the bracket with the help of debonding pliers, leaving the entire adhesive on the tooth surface. The adhesive was then applied on the bracket mesh and pushed on the sur-face of enamel (Fig. 3c).
After removal of excess flash by dental explorer, curing was carried out for total 40 s, from occlusal, gingival, distal, and mesial directions, 10 s each. Wavelength of curing light ranges from 420 to 480 nm (Fig. 3d). The bracket debonding was carried out by gently squeezing the mesial and distal wings with the help of bracket re-moval pliers.
All burs/wheels/discs were used in low-speed hand-piece (10,000–20,000 rpm) with water cooling as per the instructions of the manufacturer. Complete removal of resin was confirmed under dental operating light for vis-ual examination followed by tactile assessment using a dental explorer.
After residual resin removal with four different methods (Fig. 1), the specimens were subjected to roughness assessment by surface roughness tester (post polishing roughness) (Fig.4).
Two measurements for each specimen were recorded and mean was calculated.
Out of each group, two specimens were subjected to scanning electron microscopic examination. All bonding, debonding, and adhesive residual removal procedures were carried out by the principal investigator. The data
of the above procedures was obtained and subjected to statistical evaluation.
Scanning electron microscope analysis
The teeth were stored in phosphate-buffered saline (PBS) solution. After drying with air pressure, teeth were mounted on an aluminum stub. Then they were sub-jected to SEM observation (JEOL, JSM 5610LV, Japan).
Observations were performed at 20 kV and at a work-ing distance of 100 μm with image capturing magnifica-tion of × 200. ImageJ Software was used for image analysis. Enamel Damage Index (EDI) was used for assessing enamel surface damage.
ImageJ is an image processing program that can calcu-late area and pixel value of user defined selections. Dur-ing the analysis, images were magnified and after 10 mm distance had been defined on the ruler of the photo-graphic setting; the scale was adjusted to pixels/mm for size accordance [11].
EDI [12] includes four scores: score 0 indicates smooth enamel surface without presence of scratches. Periky-mata may be seen on enamel surface. Score 1 indicates acceptable enamel surface with fine scattered scratches that involves 1–10% of enamel surface. Score 2 indicates rough enamel surface with several coarse scratches or minor grooves that may involve 11–50% of enamel sur-face. Score 3 indicates coarse scratches or wide grooves that may involve more than 50% enamel surface. Enamel damage in this score is visible with naked eye.
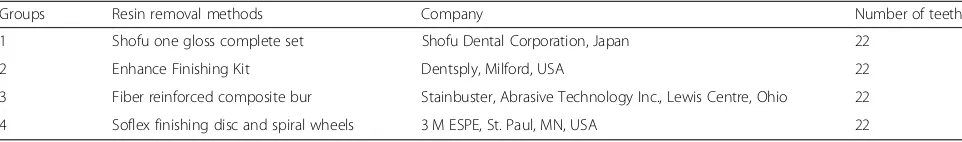
Fig. 1Four groups used in the study
Table 1Description of four groups
Groups Resin removal methods Company Number of teeth
1 Shofu one gloss complete set Shofu Dental Corporation, Japan 22
2 Enhance Finishing Kit Dentsply, Milford, USA 22
3 Fiber reinforced composite bur Stainbuster, Abrasive Technology Inc., Lewis Centre, Ohio 22
Results
Quantitative observations
No statistically significant difference was found in base-line roughness between four groups with p value of 0.666 (Ra), 0.925 (Rt), and 0.702 (Rz).
Comparison of post polishing Ra using one-way ANOVA test showed that the mean value of group 4
(4.62 μm) was highest, followed by group 1
(3.36 μm), group 2 (3.17 μm), and group 3
(1.99 μm). This difference was statistically significant with pvalue of < 0.001 (Table 2).
Comparison of post polishing Rt using one-way ANOVA test showed that the mean value of group 4
(5.36 μm) was highest, followed by group 2
Fig. 2Roughness parameters
Fig. 3Bonding steps.aEtching.bPriming.cBonding.dCuring
(4.24 μm), group 1 (4.24 μm), and group 3 (3.84 μm). This difference was statistically significant with pvalue of < 0.001 (Table 3).
Comparison of post polishing Rz using one-way ANOVA test showed that the mean value of group 4 (10.93 μm) was highest followed by group 2 (8.40 μm), group 1 (8.19 μm), and group 3 (7.95 μm). This differ-ence was statistically significant with p value of < 0.001 (Table4).
Post-hoc Tukey test comparing post polishing Ra showed that the mean value of group 4 (4.62 μm) is highest, followed by group 1 (3.36 μm), group 2 (3.17 μm), and least in group 3 (1.99 μm). This differ-ence is statistically significant with p value of < 0.001 (Tables5,6, and7).
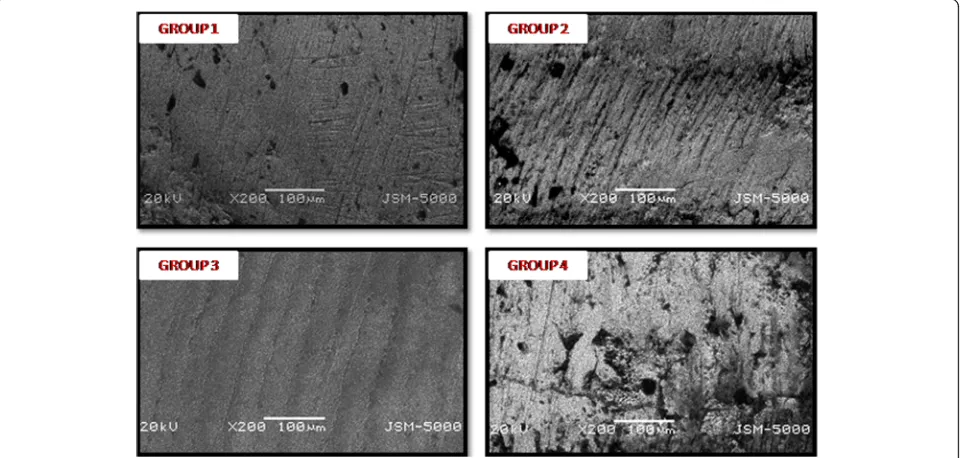
Qualitative observations
Scanning electron microscopic (SEM) observations allowed identifying both the adhesive residuals and the enamel damage.
EDI score 0 was observed in group 3 (Stainbuster group) which showed smooth surface without presence of scratches. Score 1 was noted in group 2 (Enhance and Pogo system) which showed acceptable surface with fine
scratches. Score 3 was noted in group 1 and group 4 with coarse scratches and wide grooves (Fig.5) (Tables8and9). Discussion
Correct bonding and debonding techniques play an im-portant role in orthodontics. Many factors affect these procedures; the most important among them are the type of adhesive used for bonding, the instruments used for bracket debonding, and the finishing and polishing methods of adhesive resin removal [13].
With evolution of composite resin and adhesive sys-tems, more effective bonding between enamel and resin can be achieved resulting in fewer brackets debonding rate. But, due to this increased adhesion of resin to en-amel surface, removal of resin after debonding becomes more troublesome. So, the technique used for residual resin removal plays important role to avoid enamel sur-face damages, such as enamel cracks, rougher enamel surface, wear of enamel, overheating of the teeth, and pulpal damage [14].
In our study, no statistically significant difference in baseline surface roughness was noted between One gloss group, Enhance system group, Stainbuster group, and Soflex disc and wheels group. On the other hand, finishing instruments affected the surface Fig. 4aSurface roughness tester.bRoughness tester evaluating enamel surface roughness
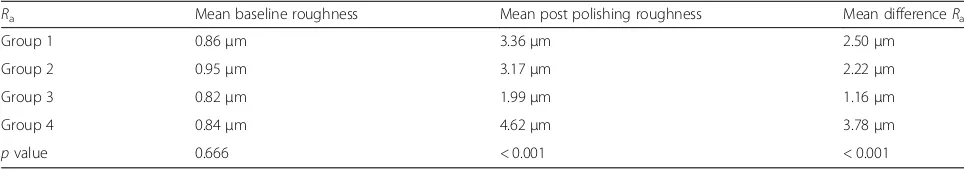
Table 2Comparison of difference inRa(average roughness) between baseline and post polishing roughness
Ra Mean baseline roughness Mean post polishing roughness Mean differenceRa
Group 1 0.86μm 3.36μm 2.50μm
Group 2 0.95μm 3.17μm 2.22μm
Group 3 0.82μm 1.99μm 1.16μm
Group 4 0.84μm 4.62μm 3.78μm
pvalue 0.666 < 0.001 < 0.001
roughness parameters. Higher roughness values were obtained with use of the Soflex group than other three groups (p< 001).
Our results showed that Soflex disc group created roughest enamel surface in comparison to other three groups. Results were in accordance with the results of Challa et al. [15], who assessed the effectiveness of five resin removal methods including tungsten Carbide burs (TCB), Discs (Sof-Lex), One step system (PoGo), and combination of carbide bur with multistep and one step polishing systems (TCB + Sof-Lex + pogo). Scanning electron microscopic results showed that en-amel surface was near to original in samples finished with One step system (PoGo) followed by Sof-Lex dics.
Howell [16] in his study observed that Sof-Lex discs followed by slurry of pumice led to roughest enamel sur-face. Michele vidor [17] recommended using Enhance finishing tip followed by aluminum oxide polishing ra-ther than Soflex discs as more enamel damage was ob-served with Soflex system.
Didem Atabek [7] evaluated enamel surface roughness after debonding using Enhance and pogo system, Stainbuster bur, and Soflex discs. Profilometric analysis suggested that smoothest enamel surface was obtained with Enhance system and roughest enamel surface was achieved using Soflex discs.
Brijesh in their in vitro study compared Enhance and Pogo system, One gloss system, and Soflex spiral wheels. Their results suggested that Enhance and Pogo micro polisher were better in creating smoother enamel surface than One gloss system and Soflex discs [18].
In the present study, SEM was used to assess enamel surface configurations. This method cannot provide a
quantitative assessment. It is only used as a supportive tool with quantitative assessment methods [19].
SEM micrographs showed that Stainbuster bur seemed to be very efficient way to clean the surface. This quali-tative result of smoothest surface achieved with Stainbuster bur agreed with our quantitative result. One gloss system and Soflex discs were the most hazardous techniques to the enamel surface. Enhance and pogo system was less destructive to enamel surface than One Gloss system and Soflex disc and wheels.
In the current study, surface roughness tester was used for assessing enamel surface roughness quantitatively. The surface roughness tester (Insize, ISR-C100) can measure up to 16 different parameters. The tester has a probe position indicator that helps in accurate identifica-tion of locaidentifica-tion. Display window shows roughness values, profile, and curves. The instrument can get con-nected with printer via Bluetooth [20].
All measured roughness parameters (Ra, Rt, Rz) for Sof-Lex disc and wheels were statistically higher than other finishing and polishing systems employed in this study. While all the roughness values were lowest for stainbuster group indicates smoothest enamel surface among all four groups.
The differences in roughness after finishing and pol-ishing among the techniques also depend on patterns of particle size and their organization within the resin matrix of respective bur/wheel/disc. Aluminum oxide disks have limitations because of their shape, which make them difficult to use efficiently in posterior teeth [21].
Bicakci [22] used high speed burs without water cool-ing. They noticed heating in the pulp chamber resulting in vascular hyperemia and occasional breakage of Table 3Comparison of difference inRt(maximum roughness height) between baseline and post polishing roughness
Rt Mean baseline roughness height Mean post polishing roughness height Mean differenceRt
Group 1 1.24μm 4.24μm 3.00μm
Group 2 1.28μm 4.24μm 2.96μm
Group 3 1.26μm 3.84μm 2.58μm
Group 4 1.28μm 5.36μm 4.08μm
pvalue 0.925 < 0.001 < 0.001
Rt maximum roughness height,μmmicrometer,pvalue probability value
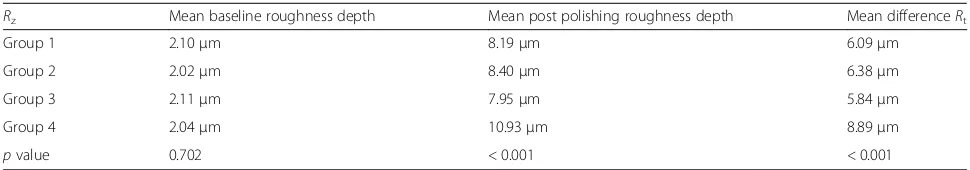
Table 4Comparison of difference inRz(mean roughness depth) between baseline and post polishing roughness
Rz Mean baseline roughness depth Mean post polishing roughness depth Mean differenceRt
Group 1 2.10μm 8.19μm 6.09μm
Group 2 2.02μm 8.40μm 6.38μm
Group 3 2.11μm 7.95μm 5.84μm
Group 4 2.04μm 10.93μm 8.89μm
pvalue 0.702 < 0.001 < 0.001
Rzmean roughness depth,μmmicrometer,pvalue probability value
Table 5Post-hoc tests forRa(average roughness)
Dependent variable Comparison group Compared with Mean difference (unit-μm) Std. error pvalue
BaselineRa Group 1 Group 2 −0.09 0.11 0.857
Group 3 0.04 0.11 0.983
Group 4 0.02 0.11 0.997
Group 2 Group 3 0.13 0.11 0.654
Group 4 0.11 0.11 0.756
Group 3 Group 4 −0.02 0.11 0.998
Post polishingRa Group 1 Group 2 0.19 0.16 0.627
Group 3 1.37* 0.16 < 0.001
Group 4 −1.25* 0.16 < 0.001
Group 2 Group 3 1.17* 0.16 < 0.001
Group 4 −1.45* 0.16 < 0.001
Group 3 Group 4 −2.63* 0.16 < 0.001
DifferenceRa Group 1 Group 2 0.28 0.18 0.417
Group 3 1.33* 0.18 < 0.001
Group 4 −1.28* 0.18 < 0.001
Group 2 Group 3 1.04* 0.18 < 0.001
Group 4 −1.56* 0.18 < 0.001
Group 3 Group 4 −2.61* 0.18 < 0.001
Raaverage roughness,μmmicrometer,pvalue probability value, *statistical significance
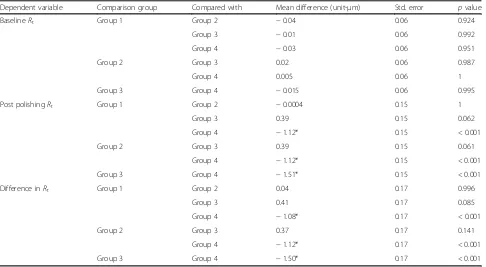
Table 6Post-hoc tests forRt(maximum roughness height)
Dependent variable Comparison group Compared with Mean difference (unit-μm) Std. error pvalue
BaselineRt Group 1 Group 2 −0.04 0.06 0.924
Group 3 −0.01 0.06 0.992
Group 4 −0.03 0.06 0.951
Group 2 Group 3 0.02 0.06 0.987
Group 4 0.005 0.06 1
Group 3 Group 4 −0.015 0.06 0.995
Post polishingRt Group 1 Group 2 −0.0004 0.15 1
Group 3 0.39 0.15 0.062
Group 4 −1.12* 0.15 < 0.001
Group 2 Group 3 0.39 0.15 0.061
Group 4 −1.12* 0.15 < 0.001
Group 3 Group 4 −1.51* 0.15 < 0.001
Difference inRt Group 1 Group 2 0.04 0.17 0.996
Group 3 0.41 0.17 0.085
Group 4 −1.08* 0.17 < 0.001
Group 2 Group 3 0.37 0.17 0.141
Group 4 −1.12* 0.17 < 0.001
Group 3 Group 4 −1.50* 0.17 < 0.001
odontoblasts was seen. This is a transient reversible con-dition. Damage of pulp gets repaired within about 20 days. It was recommended to remove most of the re-sidual resin under water cooling and turning the water cooling off during removal of last resin layer, so that it helps in distinguishing between enamel surface and resin
remnants, thereby preventing further enamel damage and loss. Therefore, in our study, water cooling was used initially to remove bulk of composite and last layer of resin was removed without water coolant.
Speed of hand piece is one of the important issues while removing adhesive resin with hand piece. A Table 7Post-hoc tests forRz(mean roughness depth)
Dependent variable Comparison group Compared with Mean difference (unit-μm) Std. error pvalue
BaselineRz Group 1 Group 2 0.07 0.09 0.824
Group 3 −0.01 0.09 1
Group 4 0.06 0.09 0.903
Group 2 Group 3 −0.08 0.09 0.765
Group 4 −0.01 0.09 0.998
Group 3 Group 4 0.07 0.09 0.857
Post polishingRz Group 1 Group 2 −0.20 0.17 0.633
Group 3 0.23 0.17 0.527
Group 4 −2.73* 0.17 < 0.001
Group 2 Group 3 0.44 0.17 0.059
Group 4 −2.53* 0.17 < 0.001
Group 3 Group 4 −2.97* 0.17 < 0.001
Difference inRz Group 1 Group 2 −0.28 0.17 0.384
Group 3 0.24 0.17 0.515
Group 4 −2.80* 0.17 < 0.001
Group 2 Group 3 .53* 0.17 0.019
Group 4 −2.51* 0.17 < 0.001
Group 3 Group 4 −3.04* 0.17 < 0.001
Rz, mean roughness depth,μmmicrometer,pvalue probability value, *statistical significance
Fig. 5Representative SEM micrographs of enamel surfaces at 200× magnification after clean-up with:1-One Gloss system;2-Enhance and Pogo system;3-Stainbuster;4-Soflex disc and wheels
low-speed rotary instrument creates additional vibra-tions and uncomfortable for patients [23]. Risk of pulpal damage increases with low-speed instrument [24]. It is noted that low-speed instrument created irregular en-amel surface but the natural enen-amel itself also showed slightly repetitive and spiky enamel [23]. It was found that effective adhesive removal was achieved with low-speed burs than high-speed burs due to the fact that both the depth and the area of the residual resin layer were significantly lower after using low-speed burs (p value < 0.05). Bishara et al. [24] observed that enamel loss was less with low-speed burs than high-speed burs. For such reasons, slow speed hand piece was used in our study.
Generation of aerosols is another demerit of residual resin removal with rotary instrument. Jonke E et al. [25]
in their study observed that after ceramic bracket debonding and various cleanup methods, aerosols pro-duced during composite grinding can act as endocrino-logical disruptors.
Debonding and adhesive resin removal techniques are operator-dependent procedures. Thus, the results may probably differ among operators. So as to lessen this in-accuracy, just one operator carried out all the clinical procedures in our study. Results of the current study showed that post clean-up roughness (post polishing roughness) was more than the prebonding enamel roughness (baseline roughness) in all the four groups. This implies that no resin removal method was able to completely restore the enamel surface roughness to its original form [26].
Our study has some limitations and warrant future studies to combat the same. Latest methods such as con-focal laser microscopy and atomic force microscopy (AFM) are being used to obtain 3D data of enamel roughness that will help in gaining more clear informa-tion regarding the amount of enamel loss caused due to various resin removal methods.
Second limitation of our study is in vitro study. Our study being in vitro, the result of this study cannot be directly applied in clinical situations. Factors such as sal-iva, oral hygiene, temperature, and pH can also affect our results. Future in vivo studies are required to con-firm our results and clinical implementation [27]. Conclusions
1. Stainbuster bur created the smoothest enamel surface that was close to the natural enamel followed by Enhance system, One gloss system, and Soflex disc and wheels in terms of post polishing average roughness (Ra).
2. Post polishing maximum roughness height (Rt) and
mean roughness depth (Rz) were least in
Stainbuster group and highest in Soflex disc and wheels group.
3. Scanning electron microscopic (SEM) examination showed that Stainbuster bur (group 3) was least damaging to enamel surface among all four methods.
Abbreviations
EDI:Enamel Damage Index; SEM: Scanning electron microscopy; μm: Micrometer
Funding
Self.
Availability of data and materials
The datasets used and/or analyzed during the current study are available from the corresponding author on reasonable request.
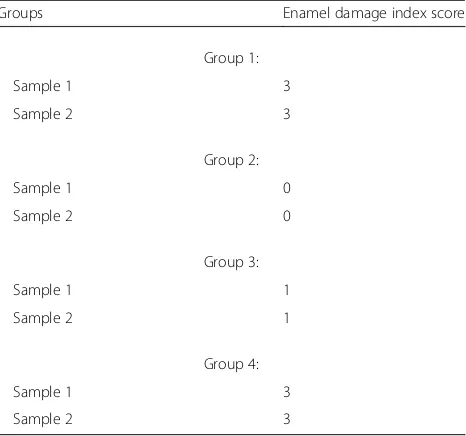
Table 8Enamel damage scores of four groups
Groups Enamel damage index score
Group 1:
Sample 1 3
Sample 2 3
Group 2:
Sample 1 0
Sample 2 0
Group 3:
Sample 1 1
Sample 2 1
Group 4:
Sample 1 3
Sample 2 3
Table 9Chi-square test for enamel roughness evaluation (SEM)
Group * score cross tabulation
Score Total
.00 1.00 3.00
Group Group 1 Count 0 0 2 2
% within score 0.0% 0.0% 50.0% 25.0%
Group 2 Count 2 0 0 2
% within score 100.0% 0.0% 0.0% 25.0%
Group 3 Count 0 2 0 2
% within score 0.0% 100.0% 0.0% 25.0%
Group 4 Count 0 0 2 2
% within score 0.0% 0.0% 50.0% 25.0%
Total Count 2 2 4 8
% within score 100.0% 100.0% 100.0% 100.0%
Authors’contributions
All authors have equal distribution in carrying out this research. All authors read and approved the final manuscript.
Ethics approval and consent to participate
Ethical approval is taken from Sumandeep Vidyapeeth. Approval number SVIEC/ON/DENT/BNPG15/D16085.
Consent for publication
Not applicable.
Competing interests
The authors declare that they have no competing interests.
Publisher’s Note
Springer Nature remains neutral with regard to jurisdictional claims in published maps and institutional affiliations.
Received: 23 December 2018 Accepted: 18 March 2019
References
1. Chen HY, Su MZ, Chang HF, Chen YJ, Lan WH, Lin CP. Effects of different debonding techniques on the debonding forces and failure modes of ceramic brackets in simulated clinical set-ups. Am J Orthod Dentofac Orthop. 2007;132:680–6.
2. Emire AE, Mehmet A, Lelya C, Zehra I. Evaluation of enamel surface roughness after various finishing techniques for debonding of orthodontic brackets. Turk J Orthod. 2016;29(1):1–5.
3. Olszowska J, Tomkowsk R, Tandecka K, Stepiem P, Szatkiewicz T, Tutak K, Grocholewicz K. Effect of orthodontic debonding and residual adhesive removal on 3D enamel microroughness. Peer J. 2016;4:e2558. 4. Olszowska J, Tandecka K, Szatkiewicz T, StępieńP, Sporniak-Tutak K,
Grocholewicz K. Three-dimensional analysis of enamel surface alteration resulting from orthodontic clean-up—comparison of three different tools. BMC Oral Health. 2015;15(1):146.
5. Eminkahyagil N, Arman A, Çetinşahin A, Karabulut E. Effect of resin-removal methods on enamel and shear bond strength of rebonded brackets. Angle Orthod. 2006;76(2):314–21.
6. Banerjee A, Paolinelis G, Socker M, McDonald F, Watson TF. An in vitro investigation of the effectiveness of bioactive glass air-abrasion in the ‘selective’removal of orthodontic resin adhesive. Eur J Oral Sci. 2008;116(5): 488–92.
7. Atabek D. Ekci Es, Bani M, Oztas N. The effect of various polishing systems on the surface roughness of composite resins. Acta Odontol Turc. 2016; 33(2):69–74.
8. Singh S, Mandlik J, Kanyal K, Jadhav A, Handa A. An in-vitro evaluation of effect of three finishing and polishing systems on the surface of nanofilled composite resin. IJCE. 2016;1(2):37–41.
9. Ahrari F, Akbari M, Akbari J, Dabiri G. Enamel surface roughness after debonding of orthodontic brackets and various clean up techniques. J Dent (Tehran). 2013;10:1.
10. Mohammed A, Mensudar R, Venkatachalam P, Pramasivam V, Arunajatesan S, Vridhachalam GS. Evaluation of surface roughness of three different composite resins with three different polishing systems. J Conserv Dent. 2016;19(2):171–4.
11. Livas C, Kuijpers-Jagtman A, Bronkhorst E, Derks A, Katsaros C. Quantification of white spot lesions around orthodontic brackets with image analysis. Angle Orthod. 2008;78(4):585–90.
12. Bernardi S, Continenza MA, Macchiarelli G. Microscopic evaluation of the enamel surface after debonding procedures: an ex vivo study using scanning electron microscopy. J Microsc. 2018;29:29.
13. Zarrinnia K, Eid NM, Kehoe MJ. The effect of different debonding techniques on the enamel surface: an in vitro qualitative study. Am J Orthod Dentofac Orthop. 1995;108:284–93.
14. Almeida HC, Vedovello Filho M, Vedovello SA, Young AAA, Ramirez-Yanez GO. ER: YAG laser for composite removal after bracket debonding: a qualitative SEM analysis. Int J Orthod. 2009;20:9–13.
15. Challa P, Chakravarthi S, Yudhistar PV, Rayapudi N. Evaluation of one-step micro polishers for residual resin removal after debonding on fluorosed teeth. APOS Trends Orthod. 2014;1:4(5):121–5.
16. Howell S, Weekes WT. An electron microscopic evaluation of the enamel surface subsequent to various debonding procedures. Aust Dent. 1990;35(3):245–52.
17. Vidor MM, Felix RP, Marchioro EM, Hahn L. Enamel surface evaluation after bracket debonding and different resin removal methods. Dent Press J Orthod. 2015;20(2):61–7.
18. Patel B, Chhabra N, Jain D. Effect of different polishing systems on surface roughness of nano hybrid composites. J Conserv Dent. 2016;19:1. 19. Piacentini C, Sfondrini G. A scanning electron microscopy comparison of
enamel polishing methods after air-rotor stripping. Am J Orthod Dentofac Orthop. 1996;1(09):57–63.
20. Insize. ISR-C100 roughness tester: operation manual. 2006.
21. Uçtaşli MB, Bala O, Güllü A. Surface roughness of flowable and packable composite resin materials after finishing with abrasive discs. J Oral Rehabil. 2004;31:197–202.
22. Bicakci AA, Kocoglu-Altan B, Celik-Ozenci C, Teckcan M, Babacan H, Gungor E. Histopathologic evaluation of pulpal tissue response to various adhesive cleanup techniques. Am J Orthod Dentofac Orthop. 2010;138(1):12. 23. Campbell PM. Enamel surfaces after orthodontic bracket debonding. Angle
Orthod. 1995;65:2.
24. Bishara SE, Trulove TS. Comparisons of different debonding techniques for ceramic brackets: an in vitro study: Part I Background and methods. Am J Orthod Dentofac Orthop. 1990;98:145–53.
25. Jonke E, Weiland F, Freudenthaler JW, Bantleon HP. Heat generated by residual adhesive removal after debonding of brackets. World J Orthod. 2006;7:357–60.
26. Goel A, Singh A, Gupta T, Gambhir RS. Evaluation of surface roughness of enamel after various bonding and clean-up procedures on enamel bonded with three different bonding agents: an in-vitro study. J Clin Exp Dent. 2017; 9(5):608–16.
27. Gracco A, Lattuca M, Marchionni S, Siciliani G, Bonetti GA. SEM-evaluation of enamel surfaces after orthodontic debonding: a 6 and 12-month follow-up in vivo study. Scanning. 2015;37(5):322–6.