Open Access
Research
Effects of social approval bias on self-reported fruit and vegetable
consumption: a randomized controlled trial
Tracy M Miller
1, Madiha F Abdel-Maksoud
1, Lori A Crane
1, Al C Marcus
2and
Tim E Byers*
1Address: 1Department of Preventive Medicine and Biometrics, University of Colorado Denver, 4200 East 9th Avenue, Denver, CO, 80262, USA
and 2AMC Cancer Research Center, 1600 Pierce St., Denver, CO, 80214, USA
Email: Tracy M Miller - [email protected]; Madiha F Abdel-Maksoud - [email protected]; Lori A Crane - [email protected]; Al C Marcus - [email protected]; Tim E Byers* - [email protected] * Corresponding author
Abstract
Background: Self-reports of dietary intake in the context of nutrition intervention research can be biased by the tendency of respondents to answer consistent with expected norms (social approval bias). The objective of this study was to assess the potential influence of social approval bias on self-reports of fruit and vegetable intake obtained using both food frequency questionnaire (FFQ) and 24-hour recall methods.
Methods: A randomized blinded trial compared reported fruit and vegetable intake among subjects exposed to a potentially biasing prompt to that from control subjects. Subjects included 163 women residing in Colorado between 35 and 65 years of age who were randomly selected and recruited by telephone to complete what they were told would be a future telephone survey about health. Randomly half of the subjects then received a letter prior to the interview describing this as a study of fruit and vegetable intake. The letter included a brief statement of the benefits of fruits and vegetables, a 5-A-Day sticker, and a 5-a-Day refrigerator magnet. The remainder received the same letter, but describing the study purpose only as a more general nutrition survey, with neither the fruit and vegetable message nor the 5-A-Day materials. Subjects were then interviewed on the telephone within 10 days following the letters using an eight-item FFQ and a limited 24-hour recall to estimate fruit and vegetable intake. All interviewers were blinded to the treatment condition.
Results: By the FFQ method, subjects who viewed the potentially biasing prompts reported consuming more fruits and vegetables than did control subjects (5.2 vs. 3.7 servings per day, p < 0.001). By the 24-hour recall method, 61% of the intervention group but only 32% of the control reported eating fruits and vegetables on 3 or more occasions the prior day (p = 0.002). These associations were independent of age, race/ethnicity, education level, self-perceived health status, and time since last medical check-up.
Conclusion: Self-reports of fruit and vegetable intake using either a food frequency questionnaire or a limited 24-hour recall are both susceptible to substantial social approval bias. Valid assessments of intervention effects in nutritional intervention trials may require objective measures of dietary change.
Published: 27 June 2008
Nutrition Journal 2008, 7:118 doi:10.1186/1475-2891-7-18
Received: 14 November 2007 Accepted: 27 June 2008
This article is available from: http://www.nutritionj.com/content/7/1/18
© 2008 Miller et al; licensee BioMed Central Ltd.
Background
Dietary assessment methods based on self-reports are widely used in nutritional intervention studies. Conclu-sions drawn from these studies may be impeded, how-ever, by the presence of social desirability (the tendency to respond in such a way as to avoid criticism) and social approval (the tendency to seek praise) biases, which are tendencies for an individual to respond in a manner con-sistent with expected norms [1-3].
Previous dietary studies suggest that survey respondents who exhibit social desirability characteristics are more likely to underreport energy and fat intake [2-6]. Only limited work has been done to determine whether an intervention or knowledge of the goals of an intervention can produce biases using dietary assessment tools com-mon in nutritional epidemiology. Kristal et al, using a brief food frequency measure, elicited significantly lower reports of fat intake from undergraduate students who had been exposed to a brief nutritional message about fats and health than from students not exposed to that mes-sage [6].
Cognitive psychologists term the different types of mem-ory required for dietary recalls vs. food frequency ques-tionnaires (FFQs) as specific vs. generic. Specific memory relies on particular memories about episodes of eating and drinking, as in a 24-hour recall. Generic memory relies on general impressions about one's typical diet, as in a FFQ that directs a respondent to report impressions about usual frequency of eating a food over the previous year. As the time between the behavior and the report increases, respondents rely more on generic memory and less on specific memory General memory may be more subject to social approval bias than are specific recalls of actual recent events [7].
Several studies suggest that women's responses to dietary intake questions may be more affected by social desirabil-ity bias than those of men [2,3,6]. Hebert et al observed a large underestimate of fat and energy intake associated with increased social desirability score in a 7-day diet recall (cognitively similar to the food frequency question-naire), when compared with a 24-hour diet recall. For total energy, this bias was approximately twice as large for women as for men [2]. In a later study, Hebert et al found that energy and fat intake were overestimated by men but underestimated by women who had higher levels of social desirability [3]. Kristal et al reported a similar finding in his study of undergraduate students: underreporting of fat intake from a food frequency questionnaire by women, but not by men [6].
In this study, we sought to estimate the magnitude and direction of social approval bias in reported fruit and
veg-etable intake obtained from a short food frequency ques-tionnaire, as well as from a limited 24-hour recall. Specifically, we hypothesized that a group of women who believed that the study intent was to measure the intake of (healthy) fruits and vegetables might report higher intakes of fruits and vegetables than subjects in a control group, who would believe that the study had a more general pur-pose. We also hypothesized that responses to the food fre-quency questions might be more biased than responses to the 24-hour recall.
Methods
Design
This study was carried out as a blinded randomized con-trolled trial. All subjects were recruited by telephone before random assignment to study groups. At the time of recruitment, subjects were asked if they would complete a short phone interview about food intake and health at a future date for a study of eating habits of women living in Colorado. Upon verbal consent to participate, each sub-ject was then told she would soon receive a letter in the mail followed by a telephone interview within ten days. No specific appointments were made regarding the date or time of the telephone interview. Each subject was instructed to read the letter and have it accessible during the interview.
Subjects
Women residing in the State of Colorado were randomly selected for recruitment from a commercial database of listed telephone households, specifically targeting females, aged 35–64 (Survey Sampling, International). This commercial database is drawn from telephone direc-tories, school registration lists, magazine subscription lists, voter registration lists, and driver's license lists. Recruitment phone call attempts were made to 663 ran-domly selected households from this list. Of the phone numbers attempted, 26% were unreachable after seven attempts and 13% of the phone listings were non-working numbers or the intended person did not reside in the household. One percent of the women contacted were ineligible for the study according to their age or did not speak English. Among the 396 women who were con-tacted and eligible for the study, 206 (52%) agreed to take part. After recruitment, we were unable to contact 34 women (18 controls, 16 intervention subjects) for the die-tary assessment. Five women refused at the time of the interview (2 controls, 3 intervention subjects) and 4 were lost to follow up for other various reasons (1 control, 3 intervention subjects). Therefore, 163 women completed the follow-up phone interview (83 controls, 80 interven-tion subjects).
Phone interviews were typically completed within ten days after the subjects received the letter. The interviews were not scheduled. The phone interviews completed in this study were conducted by trained, professional inter-viewers, calling at random times, with the interviewer being blinded as to which group each subject was assigned. The phone interview consisted of a standard introduction and preparation. Each subject then responded to an 8-item food frequency questionnaire, a brief 24-hour recall specific to fruits and vegetables, demographic questions, questions regarding health sta-tus, and a question about personal beliefs regarding the relationship between fruit and vegetable intake and dis-ease modelled after Trudeau et al [8]. The protocol for this study was reviewed and approved by the Colorado Multi-ple Institutional Review Board.
Food frequency assessment
Eight questions from the Behavioral Risk Factor Surveil-lance System (BRFSS) were used to assess fruit and vegeta-ble intake [9]. In addition, we included the BRFSS questions regarding intake of fluid milk and sweet bread products (doughnuts, cookies, cakes, pastries, and pies), which were not mentioned in the biasing prompt, and are generally considered neutral (milk) or socially undesira-ble (sweets) to determine whether any bias we might observe would be specific to fruits and vegetables. Sub-jects responded with the number of times per day, week, month, or year they consumed each food. From these
reports, the total number of servings per day of fruits and vegetables was determined.
24-hour recall
A brief version of the 2001 California Dietary Practices Survey was used to assess fruit and vegetable intake on the previous day [10]. This recall was a series of eight ques-tions regarding whether the respondent ate each of three meals or a snack the previous day, and (if eaten) whether fruits and/or vegetables were consumed at each of those occasions.
Subjects were also asked questions from the Behavioral Risk Factor Surveillance System interview [11] about fac-tors shown by others to be related to fruit and vegetable intake. These included age, race/ethnicity, education, mar-ital status, smoking, and health status [10-14]. In addi-tion, subjects responded to a question regarding how long it had been since their last doctor's visit for a routine check-up.
Analysis
We used the two-sample t-test for independent samples to evaluate differences in mean values of continuous varia-bles (e.g., age and number of servings of fruits and vegeta-bles per day) between the randomly-assigned study groups. The chi-square test was used to analyze the cate-gorical variables of interest. Multiple linear regression analysis was used to assess the independence of the asso-ciation between fruit and vegetable intake and the inter-vention group, after adjusting for covariates (e.g., education, marital status). Multiple logistic regression was used to assess the independence of associations between intervention group and the categorical outcomes of reported fruits and vegetables servings per day after adjust-ing for potential confoundadjust-ing factors. SAS, Version 8.0 was used to conduct these analyses [15].
Results
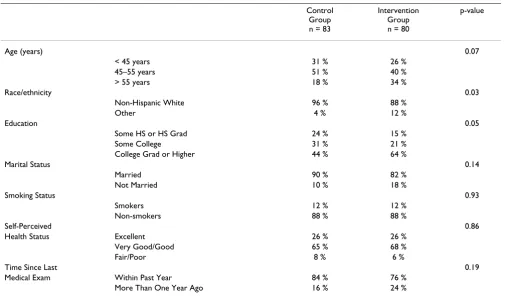
Control and intervention subject groups were similar with respect to most characteristics (Table 1). The majority of participants in both groups were Non-Hispanic White and married, and perceived their health as very good or good, had received a medical check-up within the last year, and were non-smokers. A slightly higher proportion of women randomly assigned to the intervention group were Non-Hispanic White (96% vs. 88%, P = 0.03) and college graduates (64% vs. 44%, P = 0.05) than were women ran-domly assigned to the control group.
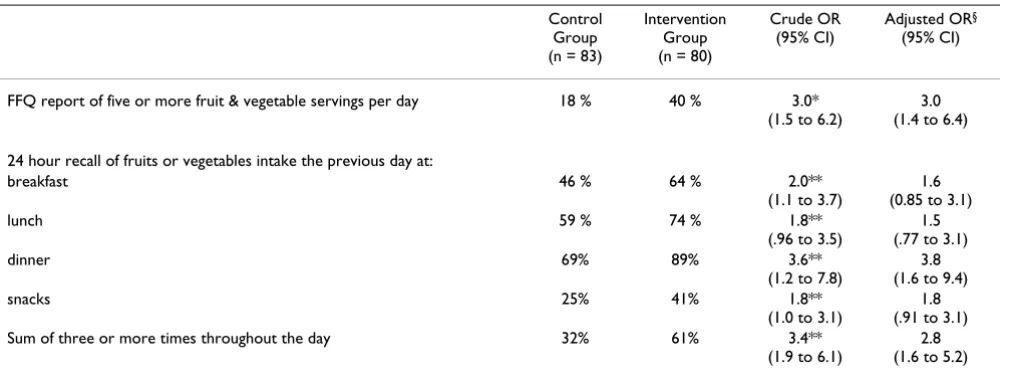
(Table 2). No difference was observed between the inter-vention and control groups with regard to reports of intake of milk, potatoes, or sweet products (doughnuts, cookies, cake, pastries, or pies) (Table 2). A higher propor-tion of intervenpropor-tion subjects were categorized as eating 5 or more servings of fruits and vegetables per day by the FFQ (40% vs. 18%, P = 0.002 (Table 3). Adjustment by multiple logistic regression for age, education level, race/ ethnicity, self-perceived health status, and time since last
check up had little effect on this association (Crude OR = 3.0, 95% CI 1.5 to 6.2; adjusted OR = 3.0, 95% CI 1.4 to 6.4) (Table 3). Multiple linear regression analyses also showed no confounding by age, education level, race, self-perceived health status, and time since last medical check-up on servings per day (data not shown).
In responding to the 24-hour recall questions, a greater proportion of intervention subjects reported
consump-Table 1: Summary of demographic and health characteristics of intervention and control groups
Control Group n = 83
Intervention Group n = 80
p-value
Age (years) 0.07
< 45 years 31 % 26 %
45–55 years 51 % 40 %
> 55 years 18 % 34 %
Race/ethnicity 0.03
Non-Hispanic White 96 % 88 %
Other 4 % 12 %
Education 0.05
Some HS or HS Grad 24 % 15 %
Some College 31 % 21 %
College Grad or Higher 44 % 64 %
Marital Status 0.14
Married 90 % 82 %
Not Married 10 % 18 %
Smoking Status 0.93
Smokers 12 % 12 %
Non-smokers 88 % 88 %
Self-Perceived 0.86
Health Status Excellent 26 % 26 %
Very Good/Good 65 % 68 %
Fair/Poor 8 % 6 %
Time Since Last 0.19
Medical Exam Within Past Year 84 % 76 %
More Than One Year Ago 16 % 24 %
Table 2: Reported mean intake of fruits, vegetables, and other foods collected by food frequency questionnaire
Mean Servings Per Day (± SD)
Control Group n = 83
Intervention Group n = 80
Difference P-value
Milk 0.70 (0.72) 0.88 (0.94) 0.18 0.18
Doughnuts, Cookies, Cake, Pastries, or Pies 0.32 (0.5) 0.35 (0.58) 0.03 0.66
100% Fruit or Vegetable Juice 0.43 (0.5) 0.64 (1.04) 0.21 0.10
Fruit 0.87 (0.69) 1.33 (0.95) 0.46 < 0.001
Carrots 0.30 (0.44) 0.38 (0.34) 0.08 0.21
Potatoes 0.24 (0.28) 0.23 (0.22) 0.01 0.97
Green Salad 0.66 (0.46) 0.83 (0.54) 0.17 0.03
Other Vegetables 1.2 (0.84) 1.8 (1.46) 0.6 0.001
Total Fruit and Juice 1.3 (0.89) 2.0 (1.47) 0.7 < 0.001
Total Vegetables 2.4 (1.26) 3.2 (1.86) 0.8 < 0.001
tion of fruits and/or vegetables the preceding day at break-fast (64% vs. 46%), lunch (74% vs. 59%), dinner (89% vs. 69%), and for snacks (41% vs. 25%) (Table 3). However, only with regard to the dinner meal was the difference sta-tistically significantly higher among the intervention sub-jects. In total, however, a significantly greater proportion of intervention subjects reported consumption of fruits and/or vegetables on three or more occasions throughout the previous day than did control subjects (61% vs. 32%, adjusted OR = 2.8, 95% CI 1.6 to 5.2).
A higher proportion of subjects in the intervention group considered their diets very high or high in fruits and vege-tables than the control group (61% vs. 39%, P = 0.05).
Discussion
In this study, intervention subjects exposed to brief mes-sages about the benefits of fruits and vegetables and 5-A-Day guidelines for consumption in the day preceding die-tary assessment reported substantially higher intakes of fruits and vegetables by both the FFQ and the 24-hour recall methods. Adjustment for factors known to be asso-ciated with fruit and vegetable intake had little effect upon the size of this difference. This difference in behavior could reflect an actual (although most likely temporary) change in behavior or an intention to change. However, the minimal nature of the intervention and the large size of the difference make this explanation unlikely. This study therefore suggests that social approval bias might well be a substantial problem in the interpretation of nutritional intervention effects that are dependent on education and awareness to affect behavior change. The
magnitude of this bias is similar to the intervention effects reported in many studies evaluating changes in fruit and vegetable intake (ranging from 0.93 to 1.25 servings per day) [16-18]. Thus, a major challenge facing nutritional intervention researchers is assessing true behavioral change based on self-reports from reporting bias.
This study employed brief dietary assessment methods that are commonly used in nutritional epidemiologic studies, including intervention trials [16-19]. The esti-mates of mean fruit and vegetable intake per day among control subjects from the food frequency portion of the interview was 3.71 servings, which is consistent with base-line or control mean intake amounts identified in other studies as well as the National Cancer Institute 5-A-Day program evaluation [19-21]. In addition, we observed an association between fruit and vegetable intake and self-perceived health status that is consistent with findings of previous research [10].
We had hypothesized that the 24-hour recall might be less susceptible to the effects of social approval bias because answers are reported according to memory of the previous day's intake instead of being derived from more generic memory, as in the food frequency questionnaire [7]. However, we observed substantial biases in both types of measures. More intervention subjects reported consump-tion of fruits and vegetables than did controls for each meal on the prior day, and substantially more therefore reported eating fruits and vegetables on 3 or more occa-sions on the previous day (61% vs. 32%, p = 0.002). These findings suggest that social approval bias may affect
short-Table 3: Reports of fruits and vegetables intake by food frequency and 24 hour recall methods.
Control Group (n = 83)
Intervention Group (n = 80)
Crude OR (95% CI)
Adjusted OR§ (95% CI)
FFQ report of five or more fruit & vegetable servings per day 18 % 40 % 3.0* (1.5 to 6.2)
3.0 (1.4 to 6.4)
24 hour recall of fruits or vegetables intake the previous day at:
breakfast 46 % 64 % 2.0**
(1.1 to 3.7)
1.6 (0.85 to 3.1)
lunch 59 % 74 % 1.8**
(.96 to 3.5)
1.5 (.77 to 3.1)
dinner 69% 89% 3.6**
(1.2 to 7.8)
3.8 (1.6 to 9.4)
snacks 25% 41% 1.8**
(1.0 to 3.1)
1.8 (.91 to 3.1) Sum of three or more times throughout the day 32% 61% 3.4**
(1.9 to 6.1)
2.8 (1.6 to 5.2)
*OR estimated via multiple logistic regression as the odds of 5 or more servings per day vs. fewer than 5 for intervention group as compared to control group.
** OR is the odds of having reported eating a fruit or vegetable in the specific meal (yes vs. no), or 3 or more times in the day (vs. under 3 times), compared to the control group, as estimated by logistic regression.
term dietary recall methods as well as more general longer-term recall processes used for food frequency reports.
Our findings are consistent with previously established theories regarding the effects of social desirability and social approval bias upon self-reports of usual food intake. Prompting subjects in the intervention group about the benefits of fruits and vegetables likely altered their memory of food intake to be consistent with what is considered "good for health". Responses about other food items included in the food frequency questionnaire, such as milk, potatoes, and sweet bread products, that may be considered neutral or socially undesirable, were unaf-fected by this apparent bias.
Results of this study were obtained from a small sample of the Colorado female population. We were therefore una-ble to assess the impact of reporting bias among men, or among subgroups defined by age, race/ethnicity, or socio-economic status. Future work should examine effects in such subgroups, and should also assess the relationship between the dose and timing of the biasing prompts, and the resulting bias. More detailed assessments of full 24 hour diet recalls (rather than only the fruit and vegetable specific limited recall used in this study) should also be examined in future studies. Future work should also examine the bias in reports of diet over time between intervention and control subjects, where change is meas-ured as the difference in the intervention-control differ-ences over time. Any difference in fruits and vegetables intake between baseline and follow up should be inter-preted with caution as it could be due to either bias from participating in the intervention, or to actual change. Another explanation of the difference in reporting fruits and vegetables intake reported in this study between the study groups could be that the diets between these two groups were really different, and not just on the day of the interview. However, the randomized blinded nature of this study makes this explanation unlikely. The difference in the reported fruits and vegetables intake can also be attributed to the intervention resulting in a temporary behavior change in the intervention group. We believe it is unlikely that such a small "intervention" could account for such a large behavioural change.
Alternatives to self-reported measures of dietary intake in the evaluation of dietary interventions deserve close atten-tion and careful thought in the design of dietary interven-tion studies. Methods of data collecinterven-tion that are more objective in nature will reduce bias and provide more reli-able estimates of intervention effects [22]. Alternatives for consideration may include use of nutritional biomarkers such as carotenoids to assess changes in nutritional intake
throughout the intervention process, as used in the Polyp Prevention Trial [23] and in an assessment of fruit and vegetable intake in Norway [24]. Although use of nutri-tional biomarkers may exhibit some limitations due to cost and compliance, this more objective method of die-tary assessment eliminates the concerns about bias associ-ated with self-reported dietary intake [25,26].
In some settings, where intervention targets are specific to confined groups of people, direct observation of dietary intake before and after an intervention may be feasible as an objective method of dietary assessment. For example, direct observation of children eating in school settings, or workers in worksite cafeterias can provide an objective dietary measure for interventions expected to affect food choices. For community-wide interventions, evaluation of food purchases at markets or purchasing trends at dining establishments are objective measures for interventions expected to change purchasing patterns.
In large dietary intervention trials, comprehensive solu-tions to eliminate the bias in self-reported dietary intake may prove costly and unrealistic for all subjects. However, subgroups can be assessed with biomarkers or other inde-pendent assessments to at least estimate the size of the reporting bias that might be expected to have been induced by the intervention. Bias can also be controlled to some degree by evaluating different intensities of an inter-vention, in which everyone receives at least a minimal prompt for change, rather than evaluating differences between study groups exposed to an intense intervention as compared to those not exposed to any intervention.
Conclusion
Our results show that self-reports of fruit and vegetable intake by means of both food frequency questionnaires and 24-hour recall are susceptible to substantial social approval bias. Attention to this bias in the context of die-tary reports from subjects in nutritional intervention stud-ies is an important consideration in study design, analysis, and interpretation. Continued efforts to improve meth-ods to objectively evaluate nutritional interventions are needed.
Competing interests
The authors declare that they have no competing interests.
Authors' contributions
Publish with BioMed Central and every scientist can read your work free of charge "BioMed Central will be the most significant development for disseminating the results of biomedical researc h in our lifetime."
Sir Paul Nurse, Cancer Research UK
Your research papers will be:
available free of charge to the entire biomedical community
peer reviewed and published immediately upon acceptance
cited in PubMed and archived on PubMed Central
yours — you keep the copyright
Submit your manuscript here:
http://www.biomedcentral.com/info/publishing_adv.asp
BioMedcentral
study, helped with the study coordination and editing the manuscript, and provided study consultation, TEB helped design the study, provided significant professional advice, and helped write and edit the manuscript.
Acknowledgements
Support for this project provided by the University of Colorado at Denver and Health Sciences Center.
References
1. Kristal AR, Baresford SA, Lazovich D: Assessing change in diet-intervention research. Am J Clin Nutr 1994, 59(1 suppl):185S-9S. 2. Hebert JR, Clemow L, Pbert L, Ockene IS, Ockene JK: Social Desir-ability Bias in Dietary Self-Report May Compromise the Validity of Dietary Intake Measures. Int J Epidemiol 1995, 24(2):389-98.
3. Hebert JR, Yunsheng M, Clemow L, Ockene IS, Saperia G, Stanek EJ, Merriam A, Ockene JK: Gender Differences in Social Desirabil-ity and Social Approval Bias in Dietary Self-report. Am J Epi-demiol 1997, 146(12):1046-55.
4. Horner HK, Patterson RE, Neuhouser ML, Lampe JW, Beresford SA, Prentice RL: Participant characteristics associated with errors in self-reported energy intake from the Women's Health Ini-tiative food-frequency questionnaire. Am J Clin Nutr 2002, 76:766-73.
5. Taren DL, Tobar M, Hill A, Howell W, Shisslak C, Bell I, Ritenbaugh C: The association of energy intake bias with psychological scores of women. Eur J Clin Nutr 1999, 53(7):570-8.
6. Kristal AR, Andrilla HA, Koepsell TD, Diehr PH, Cheadle A: Dietary assessment instruments are susceptible to intervention-associated response set bias. J Am Diet Assoc 1998, 98(1):40-43. 7. Smith AF, Jobe JB, Mingay DJ: Retrieval from memory of dietary
information. Appl Cogn Psychol 1991, 5:269-296.
8. Trudeau E, Kristal AR, Li S, Patterson RE: Demographic and psy-chosocial predictors of fruit and vegetable intake differ: Implications for dietary interventions. J Am Diet Assoc 1998, 98(12):1412-17.
9. Serdula M, Coates R, Byers T, Mokdad A, Jewell S, Chavez N, Mares-Perlman J, Newcomb P, Ritenbaugh C, Treiber F, Block G: Evalua-tion of a brief telephone quesEvalua-tionnaire to estimate fruit and vegetable consumption in diverse study populations. Epidemi-ology 1993, 4:455-463.
10. Oppen M, Sugerman S, Foerster SB: California Department of Health Services Cancer Prevention and Nutrition Section.
California Dietary Practices Surveys 1999.
11. Centers for Disease Control and Prevention (CDC): Behavioral Risk Factor Surveillance System Survey Questionnaire Atlanta, Georgia: US Department of Health and Human Services, CDC; 2002.
12. Thompson B, Demark-Wahnefried W, Taylor G, McClelland J, Stables G, Havas S, Feng Z, Topor M, Heimendinger J, Reynolds KD, Cohen N: Baseline fruit and vegetable intake among adults in seven 5-A-Day study centers located in diverse geographic areas. J Am Diet Assoc 1999, 99(10):1241-8.
13. Devine CM, Wolfe WS, Frongillo EA, Bisogni CA: Life-course events and experiences: Association with fruit and vegetable consumption in 3 ethnic groups. J Am Diet Assoc 1999, 99(3):309-314.
14. Palaniappan U, Starkey LJ, O'Loughlin J, Gray-Donald K: Fruit and Vegetable Consumption is Lower and Saturated Fat Intake is Higher Among Canadians Reporting Smoking. J Nutr 2001, 131(7):1952-8.
15. SAS Institute Inc: SAS® Software, Version 8.0, Cary, North Carolina 2002. 16. Stevens VJ, Glasgow RE, Toobert DJ, Karaja N, Smith KS: Rand-omized trial of a brief dietary intervention to decrease con-sumption of fat and increase concon-sumption of fruits and vegetables. Am J Health Promot 2002, 16(3):129-34.
17. Stevens VJ, Glasgow RE, Toobert DJ, Karaja N, Smith KS: One-year results from a brief, computer-assisted intervention to decrease consumption of fat and increase consumption of fruits and vegetables. Prev Med 2003, 36(5):594-600.
18. Berstein A, Nelson ME, Tucker KL, Layne J, Johnson E, Nuernberge A, Castaneda C, Judge JO, Buchner D, Singh MF: A home-based
nutrition intervention to increase consumption of fruits, veg-etables, and calcium-rich foods in community dwelling elders. J Am Diet Assoc 2002, 102(10):1421-7.
19. Marcus AC, Heimendinger J, Wolfe P, Fairclough D, Rimer BK, Morra M, Warnecke R, Himes JH, Darrow SL, Davis SW, Julesberg K, Slevin-Perocchia R, Steelman M, Wooldridge J: A Randomized Trial of a Brief Intervention to Increase Fruit and Vegetable Intake: A Replication Study among Callers to the CIS. Prev Med 2001, 33:204-216.
20. Lanza E, Schatzkin A, Datson C, Corle D, Freedman L, Ballard-Bar-bash R, Caan B, Lance P, Marshall J, Iber F, Shike M, Weissfeld J, Slat-tery M, Paskett E, Mateski D, Albert P, PPT Study Group: Implementation of a 4-y, high-fiber, high-fruit-and-vegeta-ble, low-fat dietary intervention: results of dietary changes in the Polyp Prevention Trial. Am J Clin Nutr 2001, 74(3):387-401. 21. National Institutes of Health, National Cancer Institute: 5-A-Day for
Better Health Program Monograph 2001.
22. Natarajan L, Flatt S, Sun X, Gamst A, Major J, Rock C, Al-Delaimy W, Thompson C, Newman V, Pierce J, The Women's Healthy Eating and Living Study Group: Validity and systematic error in measuring carotenoid consumption with dietary self-report instru-ments. Am J Epidemiol 2006, 163:770-778.
23. Lanza E, Schatzkin A, Ballard-Barbarsh R, Corle D, Clifford C, Paskett E, Hayes D, Bote E, Caan B, Shike M, Weissfeld J, Slattery M, Mateski D, Daston C, Clifford DC: The Polyp Prevention Trial II: dietary intervention program and participant baseline dietary char-acteristics. Cancer Epidemiol Biomarkers Prev 1996, 5(5):385-92. 24. Brevik A, Andersen LF, Karlsen A, Trygg KU, Blomhoff R, Drevon CA:
Six carotenoids in plama used to assess recommended intake of fruits and vegetables in a controlled feeding study.
Eur J Clin Nutr in press. 2004; Mar 31
25. Martini MC, Campbell DR, Gross MD, Grandits GA, Potter JD, Slavin JL: Plasma carotenoids as biomarkers of vegetable intake: the University of Minnesota Cancer Prevention Research Unit Feeding Studies. Cancer Epidemiol Biomarkers Prev 1995, 4(5):491-6.