R E S E A R C H
Open Access
Scalability analysis comparisons of
cloud-based software services
Amro Al-Said Ahmad
1,2*and Peter Andras
1Abstract
Performance and scalability testing and measurements of cloud-based software services are necessary for future optimizations and growth of cloud computing. Scalability, elasticity, and efficiency are interrelated aspects of cloud-based software services’performance requirements. In this work, we use a technical measurement of the scalability of cloud-based software services. Our technical scalability metrics are inspired by metrics of elasticity. We used two cloud-based systems to demonstrate the usefulness of our metrics and compare their scalability performance in two cloud platforms: Amazon EC2 and Microsoft Azure. Our experimental analysis considers three sets of comparisons: first we compare the same cloud-based software service hosted on two different public cloud platforms; second we compare two different cloud-based software services hosted on the same cloud platform; finally, we compare between the same cloud-based software service hosted on the same cloud platform with two different auto-scaling policies. We note that our technical scalability metrics can be integrated into a previously proposed utility oriented metric of scalability. We discuss the implications of our work.
Keywords:Measurement, Performance, Scalability, Software-as-a-service (SaaS), Metrics
Introduction
Cloud-based applications are increasing rapidly as host-ing cost have been reduced and computhost-ing resources be-come more available and efficient. In order to maximize the scalability and performance of any software system, it is essential to incorporate performance and scalability testing and assessment into the development lifecycle. This will provide an important foundation for future optimization and will support the Service Level Agree-ment (SLA) compliant quality of cloud services [1, 2]. There are three typical requirements that are associated with the performance of cloud-based applications: scal-ability, elasticity, and efficiency [3,4].
In this study, we adopt technical definitions of these performance features, which were identified by Lehrig et al. [5]. Scalability is the ability of the cloud layer to increase the capacity of the software service delivery by expanding the quantity of the software service that is provided. Elasti-city is the level of autonomous adaptation provided by the cloud layer in response to variable demand for the software
service. Efficiency is the measure of matching the quantity of software service available for delivery with the quantity of demand for the software service. However, we note that alternative, utility-oriented (i.e. economic cost/benefit fo-cused) approaches are also used in the literature for the conceptualization and measurement of these performance aspects of cloud-based services [6,7]. Technical scalability measurements and testing is key to assessing and measur-ing the performance of cloud-based software services [1,8]. Both elasticity and efficiency aspects depend on scalability performance.
Cloud Computing, auto-scaling and load-balancing features provide the support for cloud-based applications to be more scalable, which allows such applications to be able to deal with sudden workload by adding more of instance(s) at runtime. Furthermore, as cloud-based ap-plications are being offered as Software as a Services (SaaS), and the use of multi-tenancy architectures [9]; emphasizes the need for scalability that supports the availability and productivity of the services and on-de-mand resources.
A relevant systematic literature review reports, only a few research works (e.g. project reports, MSc theses) which try to address the assessment of technical
© The Author(s). 2019Open AccessThis article is distributed under the terms of the Creative Commons Attribution 4.0 International License (http://creativecommons.org/licenses/by/4.0/), which permits unrestricted use, distribution, and reproduction in any medium, provided you give appropriate credit to the original author(s) and the source, provide a link to the Creative Commons license, and indicate if changes were made.
* Correspondence:[email protected]
1School of Computing and Mathematics, Keele University, Newcastle-under-Lyme ST5 5BG, UK
2
scalability of cloud-based software services [5]. However, recently a number of publications addressed the tech-nical measurement of the elasticity of cloud-based provision of software services [5,10]. On the other hand, other recent publications address the scalability of cloud-based software services from utility perspective [5–7,11].
In order to try to improve the scalability of any software system, we need to understand the system’s components that effect and contribute to scalability performance of the service. This could help to design suitable test scenarios, and provides a basis for future opportunities aiming to maximize the services scalability performance. Assessing scalability from utility perspective is insufficient for the above purpose, as it works from an abstract perspective which is not necessarily closely related to the technical com-ponents and features of the system.
In this paper, we use technical scalability measurements and metrics for scalability [12] of cloud-based software ser-vices, inspired by earlier technical measures of cloud elasti-city [13–15], this work is extended from previous works [12,
16]. We demonstrate the metrics application using two cloud-based software services (OrangeHRM and/or Media-Wiki) run through the Amazon EC2 and Microsoft Azure clouds. We perform three comparisons, the first one be-tween the same cloud-based software service hosted on two different public cloud platforms. The second comparison is between two different cloud-based software services hosted on the same cloud platform. The third comparison is be-tween the same cloud-based software service hosted on the same cloud platform with different auto-scaling policies. We show how the metrics can be used to show differences in the system behavior based on different scaling scenarios. We discuss how we can use these metrics for measuring and testing the scalability of cloud-based software services.
The rest of the paper is organized as follows: Related work section presents related works. A description of our approach to measuring the scalability of cloud-based soft-ware services and our metrics based on this measurement
approach are presented in Scalability performance
meas-urement section. Experimental setup and results Section
presents our experiments and analyses using two different usage scenarios, and three sets of comparisons to demon-strate the measurement approach and metrics results. Next, we discuss the implications and importance of the ap-proach and metrics in Discussion section. Finally, we present our conclusions and future works in Conclusions
and future worksection.
Related work
Related reviews [17,18] highlight scalability and perform-ance testing and assessment for cloud-based software ser-vices, as promising research challenges and directions. Another related mapping study [19] highlights that the majority of the studies in software cloud testing present early results, which indicates growing interests across the field and also the potential for much more research to fol-low the early results.
A relevant systematic literature review [5] covers cloud performance assessments and metrics in terms of scaling, elasticity, and efficiency. Highlights of their key findings are: most of the reviewed papers focus on elasticity, and in the term of scalability, they report that the papers were ei-ther early and preliminary result or initial ideas of research students. The review [5] provides the definitions of the key performance aspects (scalability, elasticity, and effi-ciency) which have been adopted in this study. Other similar recent surveys [20, 21] focus primarily on cloud service elasticity.
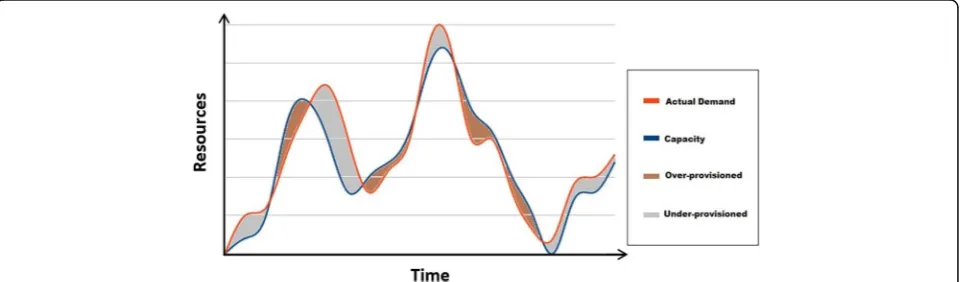
The majority of the studies focus on measuring the elasticity of cloud services from a technical perspective [4, 10, 15, 22–26]. For example, Herbst et al. [4] sets a number of key concepts that allows measuring cloud service elasticity in technical term (see Fig. 1) such as the quantity and time extents for periods of time when the service provision is either below or above what is required by the service demand. Elasticity measures defined by [4, 22] is: the timeshares and average time
lengths in under-provisioned and over-provisioned states; the amounts of the over-provisioned and under-provi-sioned resources per time unit; the averages of the excess and lacking resources; and the jitter, which is the number of resource adaptations during a specific time of provi-sioning the service. The up-elasticity and the down-elasti-city metrics are defined as the reciprocal value of the product of the average under-provisioned/over-provi-sioned time length and average lack of resources. Further elaboration [23] that extended the above metrics intro-duced other factors and ways such as reconfiguration time, functions of resource inaccuracy, and scalability.
From the utility-oriented perspective of measuring and quantifying scalability, we note the work of Hwang et al. [7, 11]. Their production-driven scalability metric in-cludes the measurement of a quality-of-service (QoS) and the cost of that service, in addition to the perform-ance metric from a technical perspective [7, 11]. This approach is useful from a utility perspective, as it de-pends on multiple facets of the system (including cost measures), it is improbable to be able to provide useful and specific information in terms of contribution of sys-tem components to scalability in a technical perspective.
Technical-oriented measurements or metrics for cloud-based software scalability research are limited. Such as [4] provides a technical scalability metric, however, this is a rather elasticity driven metric which measures the sum of over- and under-provisioned resources over the total length of time of service provision. While, Jayasinghe et al. [13, 14] provides a technical scalability measure in terms of throughput and CPU utilization of the virtual machines, but the work does not provide a metric or measure. Jamal et al. [27] describe practical measurements of systems throughput with and without multiple virtual machines (VMs), without clearly formulating specific measurements or metric of scalability. Gao et al. [15] evaluate software as services (SaaS) performance and scalability from the cap-acity of the system perspective, by using the system load and capacity as measurements for scalability. Another recent work [28] focuses on building a model that helps to measure and compare different deployment configura-tions in terms of costs, capacity, and elasticity. Brataas et al. [29] offered two scalability metrics, one based on the relationship between the capacity of cloud software ser-vices and its use of cloud resources; the second is the cost scalability metric function that replaces cloud resources with cost, in order to demonstrate the metrics, they used CloudStore application hosted in Amazon EC2 with dif-ferent configurations. In an earlier work, [30] provides a theoretical framework of scalability for mobile multi-agent systems, however, which remains limited to theory and modeling results.
In terms of comparisons, we note that [13, 14] com-pared the performance and scalability of two
applications (RUBBoS and/or Cloudstone) on three pub-lic clouds (Amazon, Open Cirrus, and Emulab), and three private clouds that have been built using the three mainstream hypervisors (XEN, KVM and CVM). As we mentioned above the comparison were based on CPU utilization and throughput without providing any metric or measure. Similarly, Hwang et al. [7, 11] introduces a set of experiments involving five benchmarks, three clouds, and set of different workload generators. Only three benchmarks were considered for scalability mea-surements, the comparison was based on the scaling scenarios, and what the effect on performance and scal-ability. Gao et al. [15] run the same experiments in two different AWS EC2 instance types, one with load-balan-cing and one without. While Vasar et al. [31] introduces a framework for testing web application scalability on the cloud, run the same experiments settings to measure response time on three different EC2 instance types.
Scalability performance measurement
Scalability is the ability of the cloud-based system to increase the capacity of the software service delivery by expanding the quantity of the software service that is provided when such increase is required by increased demand for the service over a period of time during which the service is exposed to a certain variation in demand for the service (i.e. a demand scenario) [5]. Our focus is whether the system can expand in terms of quantity (scalability) when required by demand over a sustained period of service provision, according to a cer-tain demand scenario. We are not concerned with short-term flexible provision of the resources (elasticity of the service provision) [22]. The purpose of elasticity is to match the service provision with actual amount of the needed resources at any point in time [22]. Scalability is the ability of handling the changing needs of an applica-tion within the confines of the infrastructure by adding resources to meet application demands as required, in a given time interval [5, 32]. Therefore, the elasticity is scaling up or down at a specific time, and scalability is scaling up by adding resources in the context of a given time frame. The scalability is an integral measurement of the behavior of the service over a period of time, while elasticity is the measurement of the instantaneous behavior of the service in response to changes in service demand. Furthermore, we are not concerned with the ef-ficiency of the cloud-based software services delivery, which is usually measured by the consumption of re-sources (i.e. cost and power consumption) required to complete the desired workload [5].
of service through multiple instances of the same soft-ware, or a combination of these two approaches. Gener-ally, we expect that if a service scales up the increase in demand for service should be matched by the propor-tional increase in the service’s provision without degrad-ation in terms of quality. In this work, the quality of the service may be seen for example in terms of response time.
The ideal scaling behavior of the service system should be substantial over a sufficiently long time-scale, in contrast with cloud elasticity that looks at short-term mismatches between provision and de-mand. If the system does not show ideal scaling be-havior, it will increase the volume of the service without changing the quality of that service. Ordinar-ily, real systems are expected to behave below the level of the ideal scaling and the aim of scalability testing and measurements is to quantify the extent to which the real system behavior differs from the ideal behavior.
To match the ideal scaling behavior, we expect that the system will increase the quantity of the software instances proportionately with the rise in demand for the software services, i.e. if the demand is doubled, we would ideally expect the base number of software instances to also double. We also expect that the system maintains quality of service in terms of maintaining the same average response time irrespective of the volume of service requests, i.e. if demand was increased by 25%, we would ideally expect no increase in average response time. Formally, let us assume that D and D’are two ser-vice demand volumes, D’> D. Let I and I′be the corre-sponding number of software instances that are deployed to deliver the service, and let tr and t’rbe the
corresponding average response times. If the system scales ideally we expect that for any levels of service de-mand D and D’we have that
D0=D¼I0=I ð1Þ
tr¼t0r ð2Þ
Equation (1) means that the volume of software in-stances providing the service scale up linearly with the service demand. Equation (2) means that the quality of service, in terms of average response time, remains the same for any level of service demand.
In order to measure the values of I and tr the system
must perform the delivery of the service over a period of time, such that short-term variations corresponding to system elasticity do not influence the measurements. This means that the measurements should be based on an average number of software instances and average re-sponse time measured regularly (e.g. every second) dur-ing the execution of a demand scenario followdur-ing a
particular pattern of demand variation. The same demand pattern should be executed multiple times to get reliable averages.
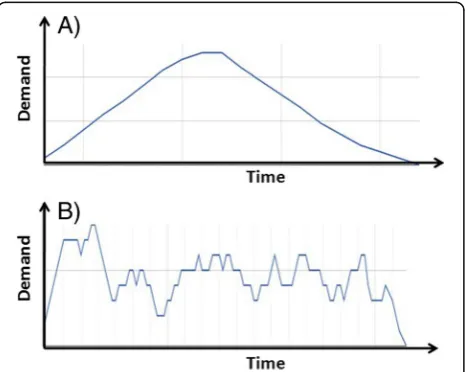
Demand scenarios may follow certain patterns ex-pected to test the scalability of the system in specific ways. Two kinds of demand patterns that appear as nat-ural and typical choices are the steady increase followed by a steady decrease of the demand with a set level of the peak, and the stepped increase and decrease, again with a set peak level of demand. The second scenario is a stepped increase and decrease, again with a set peak level of demand; with this scenario, we schedule to start with 10% of the demand size, then stepped increase 10% through time, while stepped down 10% through time. These two demand scenarios are shown in Fig. 2. The purpose of having two scenarios is to see how the auto-scaling service (services that automatically help to ensure that an application has the proper number of ainstances dynamically, can handle the workload during runtime [33, 34]) handles cloud-based software services with different patterns of growth of workloads and to verify that the cloud resources covers the target system’s needs without experiencing a drop in performance. A demand scenario is characterized by a summary measure of the demand level, which may be the peak level or the average or total demand level. This characteristic of a demand scenario is denoted as D.
Fig. 2Demand scenarios:aSteady rise and fall of demand;b
In general, real-world cloud-based systems are unlikely to deliver the ideal scaling behavior. Given the difference between the ideal and the actual system scaling behavior, it makes sense to measure technical scalability metrics for cloud-based software services using as reference the ideal scalability behavior defined in (Eqs.1and2).
In terms of provision of software instances for the de-livery of the services, the scaling is deficient if the num-ber of actual instances is lower than the ideally expected number of scaling instances. To quantify the level of deficiency we pick a demand scenario and start with a low level of characteristic demand D0and measure the
corresponding volume of software instances I0. Then we
measure the number of software instances Ik
corre-sponding to a number (n) of increasing demand levels Dk following the same demand scenario, we can then
calculate how close are the Ik values to the ideal I*k
values (in general we expect Ik< I*k). Following the ideal
scalability assumption of Eq. (1) we get for the ideal I*k
values:
Ik¼ðDk=D0Þ I0 ð3Þ
Considering the ratio between the area defined by the (Dk, Ik) values, k = 0,…,n, and the area defined by the
(Dk, I*k) values we get the metric of service volume
scal-ability of the systemηI:
A¼X
k¼1;…;nðDkDk−1Þ I
kþIk−1
ð Þ=2 ð4Þ
A¼X
k¼1;…;nðDkDk−1Þ ðIkþIk−1Þ=2 ð5Þ
ηI ¼A=A ð6Þ
where A and A*are the areas under the curves evaluated piecewise as shown in Fig. 3a calculated for actual and ideal I values andηIis the volume scalability performance metric of the system. The system is close to the ideal vol-ume scalability ifηIis close to 1. If the opposite is the case andηIis close to 0, then the volume scalability of the sys-tem is much less than ideal.
We define the system quality scalability in a similar manner by measuring the service average response times tkcorresponding to the demand levels Dk. Here, the
sys-tem average response time measures as the average time that the system takes to process a request once it was received. We approximate the ideal average response time as t0, following the ideal assumption of Eq. (2). The
system quality scalability is less than ideal if the average response times for increasing demand levels increase, i.e. tk> t0. By considering the ratio between the areas
defined by the (Dk, tk) values, k = 0,…,n, and the area
defined by the (Dk, t0) values we get a ratio that defines
a metric of service quality scalability for the systemηt:
B¼X
k¼1;…;nðDkDk−1Þ t0
¼ðDnD0Þ t0 ð7Þ
B¼X
k¼1;…;nðDkDk−1Þ ðtkþtk−1Þ=2 ð8Þ
ηt ¼B=B ð9Þ
where B and B*are the areas under the curves evaluated piecewise as shown in Fig. 3b calculated for actual and
Fig. 3The calculation of the scalability performance metrics:athe volume scalability metric isηI, which is the ratio between the areas
A and A*–see Eq. (6);bthe quality scalability metric isη t, which is
the ratio between the areas B*and B–see Eq. (9). The red lines
ideal t values and ηt is the quality scalability perform-ance metric of the system. If ηtis close to 1 the system is close to ideal quality scalability. On the other hand, if
ηtis close to 0 the quality scalability of the system is far from the ideal.
Figure3 illustrates the calculation of the two scalabil-ity performance metrics. In Fig.3a, A*is the area under the red line showing the ideal expectation about the scaling behavior (see Eq. (1)) and A is the shaded area under the blue curve, which corresponds to the actual volume scaling behavior of the system. The blue curve is expected in general to be under the ideal red line, indi-cating that the volume scaling is less efficient than the ideal scaling. In Fig.3b, B* is the shaded area under the red line indicating the expected ideal behavior (see Eq. (2)) and B is the area under the blue curve, showing the actual quality scaling behavior of the system. Again, in general, we expect that the blue curve is above the ideal red line, indicating that the quality scaling is below the ideal. We chose nonlinear curves for the examples of actual scaling behavior (blue curves in Fig.3) to indicate that the practical scaling of the system is likely to re-spond in a nonlinear manner to changing demand.
The above-defined scalability metrics allow the effect-ive measurement of technical scalability of cloud-based software services. These metrics do not depend on other utility factors such as cost and non-technical quality aspects. This allows us to utilize these metrics in tech-nically focused scalability tests that aim to spot compo-nents of the system that have a vital impact on the technical measurability, and additionally the testing of the impact of any change in the system on the technical system scalability. The scalability performance refers to the service volume and service quality scalability of the software service; these two technical measurements reflect to the performance of the scalability of the cloud-based software services.
Applying these metrics to different demand scenarios allows the testing and tuning of the system for particular usage scenarios and the understanding of how system performance can be expected to change as the pattern of demand varies. Such application of these metrics may highlight trade-offs between volume scaling and quality scaling of the system that characterize certain kinds of demand pattern variation (e.g. the impact of the transi-tion from low-frequency peak demands to high-frequency
peak demands or to seasonal change of the demand). Un-derstanding such trade-offs can help in tailoring the sys-tem to its expected or actual usage.
Experimental setup and results
To validate the volume and quality metrics, we performed experiments on Amazon AWS and Microsoft Azure cloud platforms, we used OrangeHRM and Mediawiki as cloud-based software services. Mediawiki is an open-source wiki software system available from https://www.mediawiki. org, OrangeHRM is an open source human resource man-agement software system available from https://www.
orangehrm.com. The reason for using these two
cloud-based software services (OrangeHRM and MediaWiki) is based on the REST-based nature of the applications, which is highly adopted by cloud and application pro-viders. As the architecture of these applications support REST caching to improve performance and scalability; by caching the data and the code, which will reduce the amount of time required to execute each HTTP request and therefor improving response times by serving data more quickly [35,36].
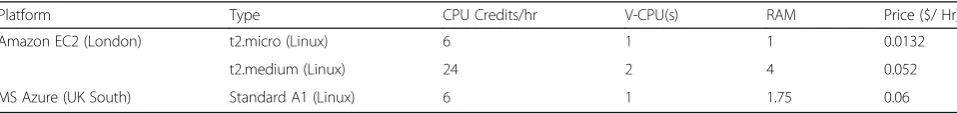
The purpose is to check the scalability performance of cloud-based applications using different cloud environ-ments, configuration settings, and demand scenarios. We applied the similar experimental settings for the same cloud-based system (OrangeHRM) in two different cloud environments (EC2 and Azure). We have changed the parameters for Mediawiki, which runs a different type of instance on AWS EC2 environment. Table 1 il-lustrates the hardware configurations for both cloud platforms.
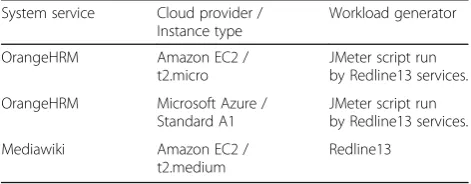
To provide the scaling of the services we relied on the Auto-Scaling and Load-Balancer services provided by both Amazon AWS and Microsoft Azure. Furthermore, Amazon CloudWatch and Azure Monitor services have been configured in order to monitor the parameters. The Auto-scaling polices (the default policies that are of-fers by the cloud providers when setting up an auto-scal-ing group) that have been used for the first two set of experiments are given in Table2.
In this study, we perform three kinds of comparisons, one between the same cloud-based software hosted on two different cloud platforms (EC2 and Azure). The sec-ond comparison is between two different cloud-based software services hosted on the same cloud platform
Table 1Hardware configrations for cloud platforms
Platform Type CPU Credits/hr V-CPU(s) RAM Price ($/ Hr)
Amazon EC2 (London) t2.micro (Linux) 6 1 1 0.0132
t2.medium (Linux) 24 2 4 0.052
(EC2). The third is between the same cloud-based soft-ware service hosted on the same cloud platform (EC2) with different Auto-scaling polices. The parameters of these experiments are listed in Table3.
For OrangeHRM experiments (hosted on EC2 and Azure), we simulate the workload using an Apache JMe-ter script (http://jmeter.apache.org/) and run through Redline13 services after connecting our cloud accounts to the service (https://www.redline13.com).
We used Redline13 services by uploading the test script into our account; which allows us to easily deploy JMeter test plans inside our cloud domain and repeat the tests without the need to reset the test parameters again. This allows efficient extraction of the data. The experimental data has been collected through both Red-line13 management portal and the monitoring services from EC2 and Azure. The service requests consisted of an HTTP request to all pages and links of OrangeHRM by gaining login access using the following steps via the Apache JMeter:
Path = /.
Method = GET.
Parameters = username, password and login button.
We used the Redline13 Pro services to test Mediawiki, which allows us to test the targeted application by cover-ing HTTP requests for all pages and links, includcover-ing get-ting authentication (log in) to the application’s admin page. In this paper, we report the behavior of the service software in response to the most basic service request, i.e. a generic HTTP request. The JMeter script allows us to send an HTTP/HTTPS request to the targeted appli-cation, and parses HTML files for images and other em-bedded resources (i.e. applets, stylesheets (CSS), external scripts, frames, iframes, background images…etc.), and
sends HTTP retrieval requests [37]. For our purposes it was sufficient to issue the simplest HTTP Request, i.e. logging in to the software service and getting in response an acceptance of the login request. Figure 4 illustrates our way to test the scalability of cloud-based software services.
Experimental process
The cloud resources must be adequately configured to measure up to the workload in order to achieve efficient performance and scalability. We considered two demand scenarios as shown in Fig. 2. The first scenario follows the steady rise and fall of demand pattern (see Fig. 2a). The second scenario consists of a series of stepwise increases and falls in demand as shown in Fig.2b. Exam-ples of the two kinds of experimental demand patterns (users running) are shown in Fig. 5. Figure 5a is an ex-ample of experiments on Mediawiki in AWS EC2 and Fig.4b is an example of experiments on OrangeHRM in Microsoft Azure. We varied the volume of demand and experimented with four demand scenarios: 100, 200, 400 and 800 service requests in total.
All experimental settings were repeated 20 times, in total 640 experimental were conducted. The average number of simultaneously active software instances and the average response time for all service requests for each experimental run has been calculated. In this study, the system average response time was measured as the average time that the targeted system takes to process an HTTP request once it was received. The averages and standard deviations of simultaneously active software instances and average response times over the 20 experi-mental runs have been calculated. The standard devia-tions are included alongside the averages in the results graphs.
Measured cloud-based software services result
Results for the same cloud-based software system on EC2 and Azure
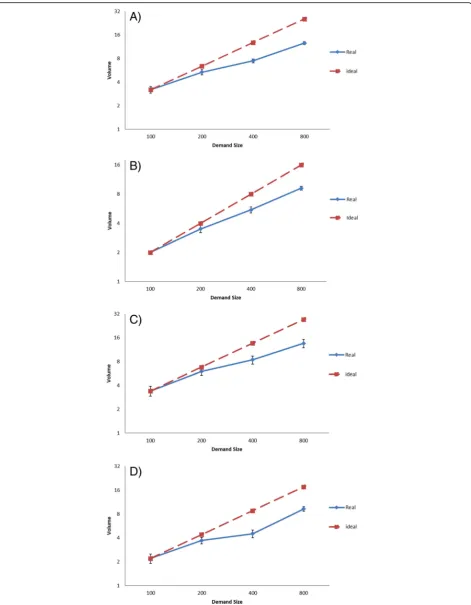
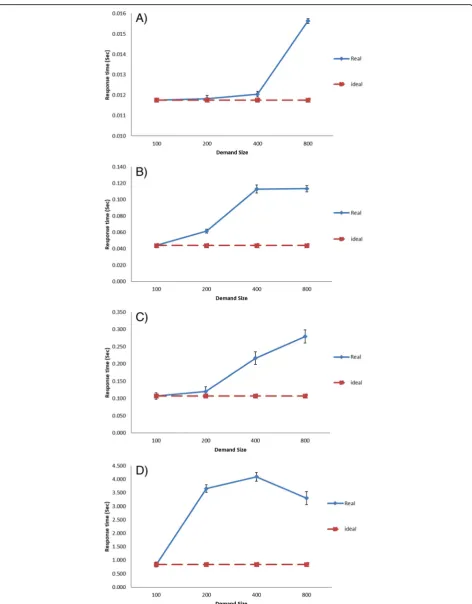
To achieve fair comparisons between two public clouds, we used similar software configurations, hardware set-tings, and a workload generator in the experiments. To measure the scalability for the proposed demand scenar-ios for the first cloud-based software service (Oran-geHRM) hosted in EC2 and Azure. The average number of OrangeHRM instances for both scenarios and for the four demand workloads are shown in Fig.6. The average response times for both scenarios and four demand workloads are shown in Fig.7. In both figures, the‘Ideal’ lines show the expected value of average response time, assuming that the scaling of the software service works perfectly. The ‘Real’ curves show the actual measured average response times.
Table 2Auto-Scaling polices
Auto-Scaling Policies
Add Instance When 80% > = CPUUtilization < +infinity
Remove Instance When 30% < = CPUUtilization >−infinity
Table 3Cloud-based services, workload, and cloud platform
System service Cloud provider / Instance type
Workload generator
OrangeHRM Amazon EC2 / t2.micro
JMeter script run by Redline13 services.
OrangeHRM Microsoft Azure / Standard A1
JMeter script run by Redline13 services.
Mediawiki Amazon EC2 / t2.medium
We note that there are variations in average response times for the same cloud-based application hosted on two different cloud platforms (EC2 and Azure). So we checked all configurations for instances, Auto-Scaling, and Load-Balancer services for both cloud accounts, to make sure that all settings match. We re-ran a number of tests to make sure that the variations in results are not caused by configuration differences.
We note that there have been other investigations about variations in average response times for cloud-based appli-cations by [38, 39]. There are a number of factors that could cause variations such as: bursty workload, software component management strategies, bursts in system con-sumption of hardware resources, and network latency. However, all software configurations, hardware settings, and workload generator are similar in our experiments.
The observed average response time values for Azure for the stepped rise and fall of demand scenario are
shown in Fig.7d. Starting from the demand size of 200 the response time increases significantly. Once the de-mand size reached 800 the average response time began to decline significantly. In contrast, response time values for EC2 for the same scenario which shown in Fig. 7c, have increased gradually with less variation.
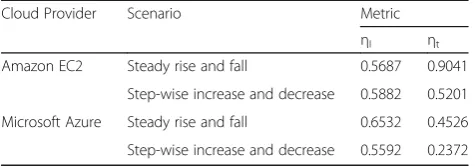
We calculated the scalability metrics ηIand ηtfor the
two demand scenarios for the cloud-based application for both cloud platforms. The values of the scalability metrics are shown in Table4. The calculated metrics for EC2 show that in terms of volume scalability the two scenarios are similar, the scaling being slightly better in the context of the step-wise increase and decrease of de-mand scenario. In contrast, Azure shows better volume scaling in the first scenario (Steady rise and fall) with around 0.65, while in the second scenario the volume scaling performance for the Azure is slightly less than the corresponding performance for the EC2.
In terms of quality scalability, the EC2 hosted system scales much better in the context of the first scenario, steady rise and fall of demand, than in the case of the second scenario with step-wise increase and decrease of demand. In contrast, Azure shows lower quality scalabil-ity than EC2 in this respect, with the metric being 0.45 in the first scenario, and 0.23 for the second scenario.
We note from the values of both metricsηIand ηtfor
both clouds that software system performed better with respect to both volume and quality in the first scenario, steady rise and fall of demand, which is more realistic and simpler demand scenario for many cloud-based soft-ware services. In general, we conclude that OrangeHRM performed better in Amazon EC2, in the terms of quality scalability, while performed slightly better in Azure in the terms of volume scalability for the steady rise and fall demand scenario. In the case of the variable rise and fall of demand, the OrangeHRM performs considerably better on the EC2 than on the Azure.
The big difference in the average response times for the software system running on the two cloud platforms Fig. 4Scalability testing plan
indicates that either the software system is tailored bet-ter to the provisions of the EC2 system or that the Azure might have issues with the speed of service delivery for the kind of service software systems like the Oran-geHRM (or for some particular kind of technical aspect of this software system). Both options raise interesting questions and opportunities for further investigation of the technical match between a software system and the cloud platforms on which it may run.
Results for different cloud-based software systems on EC2
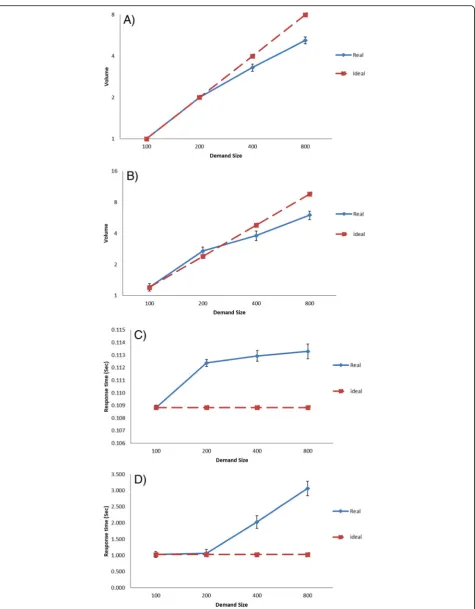
We used different software configurations, hardware set-tings, and workload generator in this set of experiments to measure the scalability of the two scenarios for both cloud-based software services that have been hosted in EC2. We changed the instance type and the workload generator in order to see the changes in scalability per-formance when using different and larger experimental settings. The purpose of this kind of comparison is to see the effects on the scalability performance using the same cloud platform while using different types of instances and workload generators. The average number of OrangeHRM instances for both scenarios and for the four demand workload levels are shown in Fig.6a and c. The average numbers of MediaWiki instances for both scenarios and for the four workload levels are shown in Fig. 8a and b. The average response times of Oran-geHRM for both scenarios and four demand workload levels are shown in Fig.7a and c. The average response times of MediaWiki for both scenarios and for the four workload levels are shown in Fig.8c and Fig.6d.
We note that in the case of the MediaWiki we found a case of over-provisioning of software instances, i.e. when the measured average number of software instances is larger than what would be expected as ideal perform-ance according to Eq. (1) – see Fig. 8b. Given that we found this for the scenario with many stepwise up and down changes of the demand, a possible reason for this is the slow or delayed down-elastic response of the cloud platform. Our volume performance metric does not ac-count for over-provision as it assumes by default under-provision. Consequently, the over-provision, in this case, distorts somewhat the performance metric (increases it). One way to correct for this is to include a penalty for
over-provisioning. Considering the symmetric nature of the deviation from the idea (downward or upward) in terms of its impact on the performance and on the geo-metric calculations in Eq. (5), we can modify this equa-tion as follows:
A¼X
k¼1;…;nðDkDk−1Þ ðIk2 IkI
k
½ þ
þIk−12½Ikþ1Ikþ1þÞ=2
ð10Þ
where [x]+represents the value of x if it is positive and 0 otherwise. This change of the calculation avoids the dis-tortion of the metric caused by potential over-provision.
Table 5 shows the calculated values for the scalability metricsηIandηtfor the two demand scenarios for both
OrangeHRM and MediaWiki cloud-based systems. The corrected volume scalability performance metric, ac-cording to Eq. (10), for the MediaWiki for the second scenario is reported in Table5in italics.
The calculated metrics show that in terms of volume scaling the two scenarios give similar performance met-rics for both systems. The scaling is slightly better in the context of the scenario with step-wise increase and decrease of demand for OrangeHRM. In contrast, for MediaWiki, the performance metrics indicate that the software performs slightly better in the first scenario, steady rise and fall of demand than in the second sce-nario. In terms of quality scalability, both systems scale much better in the context of the first scenario, steady rise and fall of demand, than in the case of the second scenario with step-wise increase and decrease of demand.
Comparing the two software systems running on the EC2, the metrics show that the MediaWiki runs at a considerably higher volume scalability performance than the OrangeHRM in both demand scenarios. The quality scalability metrics show at the MediaWiki has higher performance than the OrangeHRM in this respect in the first scenario and the performances are relatively close in this sense in the case of the second scenario. One pos-sible factor behind the different volume scalability perform-ance is that we ran the MediaWiki on t2.medium virtual machines, while the OrangeHRM was run on t2.micro vir-tual machines. Interestingly this difference in the virvir-tual machines made no major difference to the quality scaling of the two software systems. In principle, the difference in the volume scalability performance may point to the pos-sibility that technical solutions in the MediaWiki system support more the volume scaling of the system than the corresponding solutions in the OrangeHRM. A deeper insight and investigation into the components of these systems responsible for the performance difference could deliver potentially significant improvements to the system with the weaker scalability performance metrics.
Table 4Scalability metrics values
Cloud Provider Scenario Metric
ηI ηt Amazon EC2 Steady rise and fall 0.5687 0.9041
Step-wise increase and decrease 0.5882 0.5201
Microsoft Azure Steady rise and fall 0.6532 0.4526
Results for the same cloud-based software system on EC2 with different auto-scaling policies
We used the same software configurations, hardware settings, and workload generator in this set of experi-ments to measure the scalability of the two scenarios for the same cloud-based software services that have been hosted in EC2, with different Auto-Scaling policies. The first set of policies are the default policies that are pro-vided by EC2 cloud when setting up an Auto-Scaling group (option 1). We pick out random scaling policies for the second set of experiments (option 2). The Auto-scaling policies that have been used for this set of exper-iments are given in Table6.
The purpose of this kind of comparison is to see the effects on the scalability performance using the same cloud platform while using same types of instances and workload generators, with different auto-scaling policies. The average number of MediaWiki instances (Option 2) for both scenarios are shown in Fig. 9a, b. The average response times of MediaWiki (Option 2) for both sce-narios shown in Fig. 9 c, d. The average response times and number of software instances for MediaWiki in EC2 (Option 1) - see Fig.8.
We note two cases of over-provisioning of MediaWiki software instances for both 200 and 400 demand size, when we used new set of auto-scaling policies–see Fig.
8b. Table7shows the calculated values for the scalability metricsηIandηtfor the two demand scenarios for
Med-iaWiki cloud-based systems for both auto-scaling pol-icies options. The corrected volume scalability performance metric, according to Eq. (10), for the sec-ond scenario is reported in Table7in italics.
In the term of average response time, we note that there are big differences in the average of response times for the second scenario as it gradually from 2.035 s for
demand size 100 to 9.24 s for demand size 800. While it graduates from 1.02 s for demand size 100 to 3.06 s for demand size 800, for the second scenario- Step-wise increase and decrease.
We note in term of volume scaling that the experi-ments of MediaWiki with the second option of auto-scaling policies, increased 4% and 11% for the first and second scenarios respectively. While in term of quality scaling the the values has decresed 4.5% and 10% for the first and second scenarios respectively. If we draw a comparison between the two options of auto-scaling pol-icies, we note that efficiency is increased when we used the default auto-scaling policies (option 1).
Discussion
The scalability metrics [12] address both volume and quality scaling of cloud-based software services and pro-vide a practical measure of these features of such sys-tems. This is important in order to support effective measurement and testing the scalability of cloud-based software systems. These metrics are distinct from elasti-city oriented metrics [4].
We used two demand scenarios to demonstrate the ef-fect of demands patterns on scaling metrics. Using more than one scenario can be used to improve cloud-based software services to fit specified demand scenario expec-tations. This can be useful, to track changes in such sce-narios that trigger interventions in terms of systems upgrade or maintenance or direct investment of software engineering resources in the development of focused up-grades for the system. Demand scenarios combined with multi-aspects of quality scaling metric can also be used to determine rational QoS expectations and likely varia-tions depending on changes in demand scenarios.
Here we use the quality scalability metric defined by considering the system average response time. Alterna-tive quality scaling metrics may be defined by consider-ing other quality aspects of the system such as system throughput or recovery rate [11]. Expanding the range of quality measurements provides a multiple factor view of quality scalability to support the trade-off options in the context of QoS offerings in the case of service scaling.
We understand the importance and need for utility-perspective scalability metric and measurements. There-fore, our proposed metrics can be integrated into the utility-oriented scalability metric proposed by Hwang et al. [11], by combining our metrics as the performance and/or quality components of their utility-oriented scal-ability metric. This will allow the analysis of the scalabil-ity of cloud-based software services from both technical and production-driven perspectives. The utility oriented productivity metric (P(Λ)) is given as [11]:
Table 5Scalability metrics values
Cloud-Based System
Scenario Metric
ηI ηt
OrangeHRM Steady rise and fall 0.5687 0.9041
Step-wise increase and decrease
0.5882 0.5201
MediaWiki Steady rise and fall 0.7556 0.9664
Step-wise increase and decrease
0.7421
0.7183 0.5012
Table 6Auto-Scaling polices
Auto-Scaling Policies
Option 1 Add Instance When 80% > = CPUUtilization < +infinity
Remove Instance When 30% < = CPUUtilization >−infinity
Option 2 Add Instance When 70% > = CPUUtilization < +infinity
Pð Þ ¼Λ pð Þ Λ ω Λð Þ=cð ÞΛ ð11Þ
where Λ is the system configuration, p(Λ) is the per-formance component of the metric –in our case this is the volume scalability metric,ω(Λ) is the quality compo-nent of the metric –in our case this is the quality scal-ing metric, and c(Λ) is the cost component of the metric. This leads to a re-definition of the utility-ori-ented metric as:
Pð Þ ¼Λ ηIð Þ Λ ηtð ÞΛ =cð ÞΛ ð12Þ
We calculated the integrated scalability metric (see costs in Table 1) for the two demand scenarios for all cloud-based applications for both cloud platforms. The values of the utility-oriented scalability metrics are shown in Table 8 – note that the MediaWiki experi-ments used more powerful and more expensive virtual machines than the experiments with the OrangeHRM on the EC2. Our utility oriented scalability calculations show that in the case of the systems that we compared the best choice is to use smaller and cheaper virtual ma-chines on the EC2. The corrected integrated scalability metric, based on Eq. (10), for the MediaWiki for the sec-ond scenario, is reported in Table8in italics.
The technical scalability metrics that we used in this paper allow exploring in more detail the contribution to
the system scalability of various components and tech-niques used in software systems. By instrumenting the software system [40] it becomes possible to determine these contributions and using this information to im-prove the system. Potentially, different components, technologies or technical solutions may fit different degree with the cloud platform’s provisions. The tech-nical scalability metrics that we used here combined with instrumentation could allow the identification of best matches that can improve the system scalability.
Conclusions and future work
In this paper, we demonstrate the use of two technical scalability metrics for cloud-based software services for the comparison of software services running on the same and also on different cloud platforms. The under-lying principles of the metrics are conceptually very sim-ple and they address both the volume and quality scaling performance and are defined using the differences between the real and ideal scaling carves. We used two demand scenarios, two cloud-based open source soft-ware services (OrangeHRM and MediaWiki) and two public cloud platforms (Amazon AWS and Microsoft Azure). Our experimental results and analysis show that the metrics allow clear assessments of the impact of de-mand scenarios on the systems, and quantify explicitly the technical scalability performance of the cloud-based software services. The results show that the metrics can be used effectively to compare the scalability of software on cloud environments and consequently to support de-ployment decisions with technical arguments.
Some interesting scalability behavior has been noted through the analysis, such as big variations in average response time for similar experimental settings hosted in different clouds. A case of over provision state has been accrued when using higher capacity hardware configura-tions in the EC2 cloud.
We believe that the technical-based scalability metrics can be used in designing and performing scalability test-ing of cloud-based software systems, in order to identify system components that critically contribute to the tech-nical scaling performance. We have shown the integra-tion of our technical scalability metrics into a previously proposed utility oriented metric. Our metrics can also be extended, by considering multiple service quality as-pects and combined with a range of demand scenarios to support the fine-tuning of the system. Such things can help the identification of QoS trade-offs, and estima-tion of genuine scalability performance expectaestima-tions about the system depending on demand scenarios.
Future work will include the consideration of other cloud platforms (e.g. Google Cloud, IBM), demand workload generators, and other cloud-based software services, in order to extend the practical validity of the
Table 7Scalability metrics values
Cloud-Based System Scenario Metric ηI ηt MediaWiki (Auto-Scaling
policies option 1)
Steady rise and fall 0.7556 0.9664
Step-wise increase and decrease
0.7421
0.7183 0.5012 MediaWiki (Auto-Scaling
policies option 2)
Steady rise and fall 0.7923 0.9202
Step-wise increase and decrease
0.8510
0.8217 0.4060
Table 8Integrated scalability metric values
Cloud-Based System / Cloud provider
Scenario Integrated
Metrics
OrangeHRM / EC2 Steady rise and fall 38.95
Step-wise increase and decrease
23.18
OrangeHRM / Azure Steady rise and fall 4.93
Step-wise increase and decrease
2.21
MediaWiki (Auto-Scaling policies option 1)
Steady rise and fall 14.04
Step-wise increase and decrease
7.15 6.92
MediaWiki (Auto-Scaling policies option 2)
Steady rise and fall 14.02
Step-wise increase and decrease
work. We also aim to consider further demand patterns (such as variable width sudden peaks in demand, sea-sonal demand) to see the impact of these scenarios on the scalability performance of cloud-based software ser-vices. Another aspect of future work will focus on using whole code instrumentation technique in order to iden-tify the software system or cloud platform components that contribute critically to variations in average re-sponse times for the same cloud-based application with the similar experimental settings in different clouds.
Abbreviations
D and D’:Service demand volumes; I and I′: The corresponding number of software instances; QoS: Quality of service; SaaS: Software as services; SLA: Service level agreement; trand t’r: The corresponding average response
times; VMs: Virtual machines;ηI: Volume scalability metric;ηt: Quality scalability metric
Acknowledgements
This research is supported by a PhD scholarship from Philadelphia University
–Jordan for Amro Al-Said Ahmad.
Authors’contributions
The core of this paper is based on work developed for ASA PhD project at the University of Keele, supervised by PA. Both authors read, edited, and approved the final manuscript.
Authors’information
Amro Al-Siad Ahmad has a PhD in scalability analysis of cloud-based systems (2019) from Keele University, UK. Prior to his PhD, he obtained bachelor degree in Software Engineering (2009) from Philadelphia University in Jordan, and a Master Degree in Computer Science (2014) with distinction from Amman Arab University, Jordan. He works in the areas of scalability of cloud computing and software engineering.
Peter Andras has a BSc in computer science (1995), an MSc in artificial intelligence (1996) and a PhD in mathematical analysis of neural networks (2000), all from the Babes-Bolyai University, Cluj, Romania. He is a Professor in the School of Computing and Mathematics, Keele University, UK. He has published 2 books and over 100 papers. He works in the areas of complex systems, computational intelligence and computational neuroscience. Dr. Andras is Senior Member of IEEE, member of the International Neural Network Society, of the Society for Artificial Intelligence and Simulation of Behaviour, and Fellow of the Royal Society of Biology.
Funding
Not applicable.
Availability of data and materials
Not applicable.
Competing interests
The authors declare that they have no competing interests.
Received: 4 December 2018 Accepted: 16 July 2019
References
1. Liu HH (2011) Software performance and scalability: a quantitative approach. Wiley, Hoboken
2. Atmaca T, Begin T, Brandwajn A, Castel-Taleb H (2016) Performance evaluation of cloud computing centers with general arrivals and service. IEEE Trans Parallel Distrib Syst 27:2341–2348.https://doi.org/10.1109/TPDS.2015.2499749 3. Becker M, Lehrig S, Becker S (2015) Systematically deriving quality metrics for
cloud computing systems. In: Proceedings of the 6th ACM/SPEC international conference on performance engineering - ICPE‘15. ACM, New York, pp 169–174 4. Herbst NR, Kounev S, Reussner R (2013) Elasticity in cloud computing: what
it is , and what it is not. In: Presented as part of the 10th international conference on autonomic computing. USENIX, San Jose, pp 23–27
5. Lehrig S, Eikerling H, Becker S (2015) Scalability, elasticity, and efficiency in cloud computing: a systematic literature review of definitions and metrics. In: Proceedings of the 11th international ACM SIGSOFT conference on quality of software architectures - QoSA‘15, pp 83–92
6. Buyya R, Ranjan R, Calheiros RN (2010) InterCloud : utility-oriented Federation of Cloud Computing Environments for scaling of. In: Hsu C-H, Yang LT, Park JH, Yeo S-S (eds) Algorithms and architectures for parallel processing (10th International Conference, ICA3PP 20). Springer, Berlin, Heidelberg, pp 13–31 7. Hwang K, Shi Y, Bai X (2015) Scale-out vs. scale-up techniques for cloud
performance and productivity. In: Proceedings of the international conference on cloud computing technology and science, CloudCom, pp 763–768 8. Blokland K, Mengerink J, Pol M (2013) Testing cloud services: how to test
SaaS, PaaS & IaaS, Rocky Nook, Inc.
9. Aljahdali H, Albatli A, Garraghan P, et al (2014) Multi-tenancy in cloud computing. In: Proceedings - IEEE 8th international symposium on service oriented system engineering, SOSE, 2014. Oxford, pp 344–351
10. Islam S, Lee K, Fekete A, Liu A (2012) How a consumer can measure elasticity for cloud platforms. In: Proceedings of the third joint WOSP/SIPEW international conference on performance engineering - ICPE‘12. ACM, New York, p 85 11. Hwang K, Bai X, Shi Y et al (2016) Cloud performance modeling with
benchmark evaluation of elastic scaling strategies. IEEE Trans Parallel Distrib Syst 27:130–143.https://doi.org/10.1109/TPDS.2015.2398438
12. Al-Said Ahmad A, Andras P (2018) Measuring the scalability of cloud-based software services. In: 2018 IEEE World Congress on Services (SERVICES). IEEE, San Francisco, pp 5–6.https://doi.org/10.1109/SERVICES.2018.00016 13. Jayasinghe D, Malkowski S, Wang Q et al (2011) Variations in performance
and scalability when migrating n-tier applications to different clouds. In: Proceedings - 2011 IEEE 4th international conference on CLOUD computing, CLOUD 2011, pp 73–80
14. Jayasinghe D, Malkowski S, Li J et al (2014) Variations in performance and scalability: an experimental study in IaaS clouds using multi-tier workloads. IEEE Trans Serv Comput 7:293–306.https://doi.org/10.1109/TSC.2013.46 15. Gao J, Pattabhiraman P, Bai X, Tsai WT (2011) SaaS performance and
scalability evaluation in clouds. In: Proceedings - 6th IEEE international symposium on service-oriented system engineering, SOSE 2011. IEEE, Irvine, pp 61–71
16. Al-Said Ahmad A, Andras P (2018) Measuring and testing the scalability of cloud-based software services. In: 2018 fifth international symposium on innovation in information and communication technology (ISIICT), Amman, pp 1–8.https://doi.org/10.1109/ISIICT.2018.8613297.
17. Jennings B, Stadler R (2015) Resource Management in Clouds: survey and research challenges. J Netw Syst Manag 23:567–619.https://doi.org/10.1007/ s10922-014-9307-7
18. Gao J, Bai X, Tsai WT, Uehara T (2013) SaaS testing on clouds - issues, challenges, and needs. In: Proceedings - 2013 IEEE 7th international symposium on service-oriented system engineering, SOSE 2013, pp 409–415 19. Al-Said Ahmad A, Brereton P, Andras P (2017) A systematic mapping study of
empirical studies on software cloud testing methods. In: Proceedings 2017 IEEE international conference on software quality, reliability and security companion, QRS-C 2017, pp 555–562.https://doi.org/10.1109/QRS-C.2017.94 20. Geetha N, Anbarasi MS (2015) Ontology in cloud computing: a survey. Int J
Appl Eng Res 10(23):43373–43377.https://doi.org/10.1007/s12243-014-0450-7 21. Hu Y, Deng B, Peng F et al (2016) A survey on evaluating elasticity of cloud
computing platform. In: World automation congress proceedings, pp 1–4 22. Herbst NR, Kounev S, Weber A, Groenda H (2015) BUNGEE: an elasticity
benchmark for self-adaptive IaaS cloud environments. In: Proceedings - 10th international symposium on software engineering for adaptive and self-managing systems, SEAMS 2015, pp 46–56
23. Bauer A, Herbst N, Kounev S (2017) Design and evaluation of a proactive, application-aware auto-scaler. In: Proceedings of the 8th ACM/SPEC on international conference on performance engineering - ICPE‘17. ACM, New York, pp 425–428
24. Beltran M (2016) Defining an elasticity metric for cloud computing environments. In: Proceedings of the 9th EAI international conference on performance evaluation methodologies and tools. ICST (Institute for Computer Sciences, social-informatics and telecommunications engineering). ICST, Brussels, pp 172–179 25. Kuhlenkamp J, Klems M, Röss O (2014) Benchmarking scalability and elasticity of
distributed database systems. Proc VLDB Endow 7:1219–1230.https://doi.org/1 0.14778/2732977.2732995
the 8th ACM/SPEC on international conference on performance engineering - ICPE‘17. ACM, New York, pp 75–86
27. Hasan Jamal M, Qadeer A, Mahmood W et al (2009) Virtual machine scalability on multi-core processors based servers for cloud computing workloads. In: Proceedings - 2009 IEEE international conference on networking, architecture, and storage, NAS 2009, pp 90–97
28. Lehrig S, Sanders R, Brataas G et al (2018) CloudStore—towards scalability, elasticity, and efficiency benchmarking and analysis in cloud computing. Futur Gener Comput Syst 78:115–126.https://doi.org/10.1016/j.future.2017.04.018 29. Brataas G, Herbst N, Ivansek S, Polutnik J (2017) Scalability analysis of cloud
software services. In: Proceedings - 2017 IEEE international conference on autonomic computing, ICAC 2017, pp 285–292
30. Woodside M (2001) Scalability metrics and analysis of Mobile agent systems. In: Wagner T, Rana OF (eds) Infrastructure for agents, multi-agent systems, and scalable multi-agent systems. Springer Berlin Heidelberg, Berlin, Heidelberg, pp 234–245
31. Vasar M, Srirama SN, Dumas M (2012) Framework for monitoring and testing web application scalability on the cloud. In: Proceedings of the WICSA/ECSA 2012 companion volume on - WICSA/ECSA‘12, p 53 32. Autili M, Di Ruscio D, Paola I, et al (2011) CHOReOS dynamic development
model definition (D2. 1), Technical report.
33. Xiao Z, Chen Q, Luo H (2014) Automatic scaling of internet applications for cloud computing services. IEEE Trans Comput 63:1111–1123
34. Amazon EC2 (2019) What Is Amazon EC2 Auto Scaling?https://docs.aws. amazon.com/autoscaling/ec2/userguide/what-is-amazon-ec2-auto-scaling. html. Accessed 23 Jan 2019
35. OrangeHRM OrangeHRM REST APIS.https://api.orangehrm.com/?url=/ apidoc/index.html. Accessed 14 Feb 2019
36. Microsoft Azure (2017) Caching.https://docs.microsoft.com/en-us/azure/ architecture/best-practices/caching. Accessed 15 Mar 2019
37. JMeter (2019) JMeter HTTP Request.https://jmeter.apache.org/usermanual/ component_reference.html#HTTP_Request. Accessed 1 Apr 2019 38. Wang Q, Kanemasa Y, Li J et al (2012) Response time reliability in cloud
environments: an empirical study of n-tier applications at high resource utilization. In: Proceedings of the IEEE symposium on reliable distributed systems, pp 378–383
39. Butler B (2016) Who’s got the best cloud latency?https://www. networkworld.com/article/3095022/cloud-computing/who-s-got-the-best-cloud-latency.html,. Accessed 19 Mar 2018
40. Jayathilaka H, Krintz C, Wolski R (2017) Performance monitoring and root cause analysis for cloud-hosted web applications. In: Proceedings of the 26th international conference on world wide web - WWW‘17. International World Wide Web Conferences Steering Committee, Republic and Canton of Geneva, pp 469–478
Publisher’s Note