R E G U L A R A R T I C L E
Open Access
Data-driven modeling of collaboration
networks: a cross-domain analysis
Mario V Tomasello
1,2, Giacomo Vaccario
1*and Frank Schweitzer
1*Correspondence: [email protected]
1Department of Management, Technology and Economics, ETH Zurich, Weinbergstrasse 56/58, Zurich, 8092, Switzerland Full list of author information is available at the end of the article
Abstract
We analyze large-scale data sets about collaborations from two different domains: economics, specifically 22,000 R&D alliances between 14,500 firms, and science, specifically 300,000 co-authorship relations between 95,000 scientists. Considering the different domains of the data sets, we address two questions: (a) to what extent do the collaboration networks reconstructed from the data share common structural features, and (b) can their structure be reproduced by the same agent-based model. In our data-driven modeling approach we use aggregated network data to calibrate the probabilities at which agents establish collaborations with either newcomers or established agents. The model is then validated by its ability to reproduce network features not used for calibration, including distributions of degrees, path lengths, local clustering coefficients and sizes of disconnected components. Emphasis is put on comparing domains, but also sub-domains (economic sectors, scientific
specializations). Interpreting the link probabilities as strategies for link formation, we find that in R&D collaborations newcomers prefer links with established agents, while in co-authorship relations newcomers prefer links with other newcomers. Our results shed new light on the long-standing question about the role of endogenous and exogenous factors (i.e., different information available to the initiator of a
collaboration) in network formation.
Keywords: agent-based model; complex network
1 Introduction
The availability of large-scale and time resolved data sets about economic, scientific or social activities opens new venues to address the long standing question of how we col-laborate. This question becomes more important as globalization leads to a vast increase of collaborations in many areas of human activity, including science and economics [–]. In these areas, progress is mainly generated in collaboration and almost never in isolation. Hence, by understanding how we collaborate, we can re-design funding schemes and poli-cies to allocate resources efficiently, and better foster innovation.
One could argue that collaboration patterns change with respect to the actors and the domain of activity, but there may be also evidence for common features across different domains. In the latter case, we could hypothesize that a unified modeling approach should be able to reproduce, and to explain, the structural and the dynamic features of collabora-tions in different domains. To demonstrate this is the aim of our paper. By this, we provide a new flexible model that allows to understand collaboration patterns.
The present study is focused on two domains with a large impact on human develop-ment, (i) economy and (ii) science. Specifically, we refer to (i) firms collaborating in Re-search and Development (R&D) alliances and (ii) scientists collaborating in co-authored publications. For both cases large, comprehensive and structured data sets about individ-ual collaboration activities have become available. The data sets analyzed in this study are (i) the Thomson Reuters SDC Platinum database, listing around , inter-firm R&D alliances and (ii) a data set of over , co-authored papers in physics, which was ob-tained from the American Physical Society (APS) scholars database with additional dis-ambiguation of authors names. For the details we refer to Section ..
The time-aggregated data about these collaboration events can be conveniently repre-sented by means of a complex network, where the nodes are the actors, oragentsas we denote them in the following, and the links are the recorded collaborations. The struc-tural features of such collaboration networks have been already investigated in different domains. Previous works have, for instance, discussed the presence ofclusters, or commu-nities, both in R&D networks of firms [, ] and in co-authorship networks of scientists []. The existence of such communities also impacts performance criteria [, ] and affect knowledge transfer [, ] and the ability to innovate [–]. Other topological analyses focus on importance measures to characterize nodes [–].
However, even the most refined topological characterization of collaboration networks can only constitute a first step toward their comprehensive and systematic understand-ing. This has to include the mechanisms that shape the structure and dynamics of such networks at the level of nodes, or agents. In particular, we need to identify therules, or strategies, that agents follow in choosing their collaboration partners - such that at the end the observed collaboration networks emerge.
To combine the empirical analysis with a formal approach of the network formation we have proposeddata-driven modelingas a suitable methodology. It is, for the application at hand, comprised of the following four steps: (a) proposition of anagent-based model (ABM) that shall explain the formation of collaboration networks, (b)reconstructionof the collaboration networks using the empirical data from two different domains, (c) cal-ibrationof the free parameters of the ABM for each domain by means of the empirical networks, (d)validationof the ABM for each domain by reproducing network features not used for the calibration.
This leaves us with the question about agent-based models that are suitable for being used in a data-driven approach. Some ABM rooted in economics propose a utility func-tion for an agent which weight costs and benefits of collaborafunc-tions [, ]. Agents create or maintain links only if this mutually increases their utility, and delete existing links other-wise. Such ABM allow to prove general features of, e.g., R&D networks such as sparseness or stability, dependent on certain cost functions. But because of theoretical assumptions about the utility function and the partner selection they cannot easily be calibrated against network data. Therefore, we have developed an ABM in the context of R&D collaborations [] which assumes simple rules of link formation that are followed by agents with certain probabilities (see Section for details). Such probabilities can be calibrated against avail-able network data.
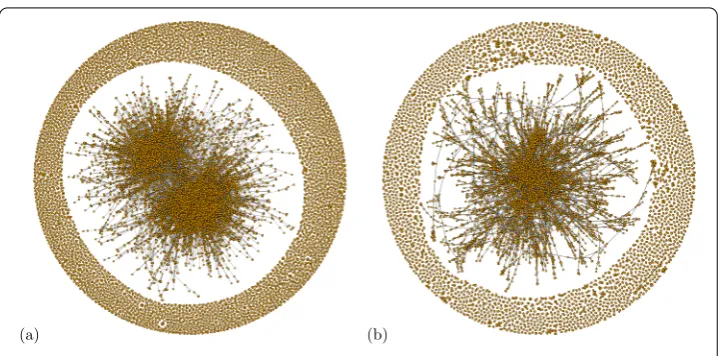
Figure 1 Visualization of collaboration networks: (a) R&D alliances of firms, (b) co-authorship relations of scientists.For the data sets see Section 3.1. We show the complete R&D network with about 14,000 nodes and 21,000 links, but only a sampled co-authorship network with about 11,000 nodes and 32,000 links (i.e. 10% of randomly chosen co-authors). For both networks we use the layout algorithm of [22].
same agent-based model can reproduce the topology of both R&D and co-authorship net-works. On the other hand, we want to identify similarities and differences - at the micro-scopiclevel - with respect to the agents’ choice of collaboration partners. To the best of our knowledge no study has tried yet to unify findings in these two domains and find sys-tematic, reproducible and universal patterns in collaboration networks. This investigation can also provide some evidence to our initial conjecture whether there may be a unified modeling approach for collaboration networks in different domains (see Figure ).
2 Agent-based model of collaborations
How do economic actors or scientists choose their collaboration partners? At first, one would argue that scientists as decision makers are quite different from firms. In addition, inside their respective domain, how they choose partners may very much depend on the specific economic sector or scientific discipline. Thus, there is no ad-hoc evidence that such a problem can be addressed using the same modeling framework.
On the other hand, in order to reproduce a macroscopic structure such as a collaboration network, we may not need to include all the microscopic details that distinguish economic from social agents. Instead, an agent-based model should abstract from these details, to capture only the essential features of the decision making process. In this sense, we aim at an agent-based model that includes a minimalistic set of microscopic rules. We argue that this agent-based model is correct if it is able to reproduce a specific set of macroscopic properties of the different collaboration networks, namely degree distribution, path length distribution, distribution of community sizes, that arenotused for the calibration of the model. At the same time, the agent-based model has to provide degrees of freedom to allow a proper calibration to reflect the differences of the domains in their respective empirical data.
match the same macroscopic features. In order to distinguish between them, we adopt a Maximum-Likelihood approach that uses the mean degree, the mean path length, and the global clustering coefficient of the resulting collaboration network as quantities to be exactly matched.
In the model, agents represent nodes in a collaboration network and links between nodes represent collaboration events. Each agent is characterized by two individual attributes, activityaiand label li.Activityreflects the propensity to participate in a collaboration,
whilelabelrepresents the membership of the agent in a recognized ‘circle of influence’. In other words, it models the belonging of the firm or of the scientist to different groups implicitly defined by shared practices and behaviors. Such a membership attribute is in agreement with the analysis of real-world networks reported by [, ]. The agent’s dy-namics can be divided in two steps:first, the agent decides with whom to link, which im-pacts the network topology and the size of the network if a newcomer is chosen.Second, she adjusts her label, i.e. she keeps her previous label if she already has one, or she adopts the label of the counterparty if she is a newcomer, or she receives a new label, as discussed below.
2.1 Activation
The model is initialized by assigning individual activitiesaito agents which are sampled
without replacement from the empirical distribution of activities (see Section .). Hence, these activities are different for each agent and kept constant in time for the simulation. Next, at each time step, we select an agent to initiate a collaboration with probabilitypi
proportional to its activity,pi=ηai, whereηis a rescaling parameter that we fix by
im-posing thatipiis equal to the number of collaboration event empirically observed per
day.
2.2 Non-labeled versus labeled agents
Activated agents can belong to two different groups: (a) newcomers, if they never engaged in a collaboration before, or (b) established agents, if they were already part of a previous collaboration. We distinguish between these groups by means of the agent labelli.
New-comers are non-labeled,li= , whereas established agents get a label depending on their
first collaboration,li> .
2.3 Collaboration size
When an agent is activated, she initiates a collaboration. The number of partners for her collaboration,mi, is obtained by sampling at random from the empirical size distribution
of collaborating groups (see Section .). The selection of partners is independent of the activity or other characteristics of the agent.
2.4 Collaboration partners
Given the size of the collaboration, the initiator chooses partners either from the group of newcomers or from the group of established agents. This choice also depends on the label of the initiator herself and can be expressed by five probabilities. A labeled initiator links to another agent with thesamelabel with probabilitypL
s, to an agent with adifferentlabel
anothernewcomerwith probabilitypNL
n . Because the probabilities have to sum up to one,
we have two constrainspL
s+pLd+pLn= andpNLn +pNLl = .
2.5 Link formation
The probabilities to choose collaboration partners only consider the two groups, newcom-ers and established agents. To specify which of the specific agents from these groups are chosen, we adopt the preferential attachment rule. Precisely, the initiatoriselects, among all agents from the specific group, agentjas collaborator with a probability proportional to the degreekjofj. If the initiator chooses a non-labeled agent (kj= ) as collaborator,
she will select uniformly at random from all non-labeled agents. After selecting themi
partners, we link all of them to the initiator, this way creating a clique of sizem+ .
2.6 Label dynamics
In our model, agents are initialized as non-labeled agents, i.e. they are considered as new-comers. An agent receives a label only when entering the network (which may consist of disconnected communities). This can happen in two different ways: either the agent ini-tiates a collaboration, or the agent is chosen as partner by an activated agent. In the first case, the agent gets a new label assigned that was not used before. In the second case, the agent adopts the label from the initiator of the collaboration. The label is a unique attribute of an agent, i.e. once an agent has obtained a label, this cannot be changed.
Let us emphasize that labels are dynamically generated during the computer simula-tions. This implies that the total number of distinct labels varies during each simulation and from one simulation to another.
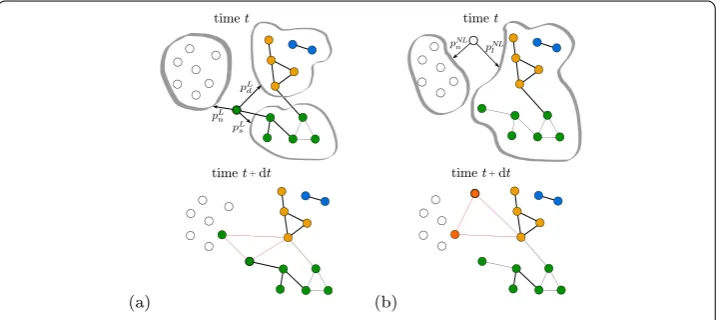
Figure summarizes the agent-based model described above. It illustrates the possible choices for the two different groups, newcomers and established agents. We note again that this choice progresses in three steps: First, activated agents choose (mtimes) between newcomers and established agents as partners. Subsequently, if activated agents already have a label assigned, they have the choice between the group with the same label or groups with a different label. Finally, within the groups, agents choose their partners with respect
Figure 2 Two representative examples of collaboration selection and of label propagation. (a)A labeled agent (whose label is depicted in green) is activated at timetand has to form an alliance with
to their degree. Obviously, the number of agents in each group and the degree of agents change dynamically as the network evolves.
3 Model calibration
3.1 Data sources
Our agent-based model, as already mentioned, will be calibrated and validated against data sets from two different domains, covering inter-firm R&D alliances and co-authorship of scientific papers. In the following, we describe the two data sets and afterwards how they are used as input for the model.
.. R&D network
To reconstruct the R&D network of collaborating firms we useSDC Platinumdatabase.a
It contains data about approximately , announced alliances from all countries be-tween and with daily resolution. The economic actors participating in these alliances are of several types, e.g. investors, manufacturing firms and universities, but for simplicity we address them asfirms. Eachactorlisted in the data set is associated with a SIC (Standard Industrial Classification) code that allows us to unambiguously assign its corresponding industrial sector. Further, the purpose of eachallianceis characterized by various flags, e.g. manufacturing, licensing, research and development (R&D). We restrict ourselves to all alliances with the flag ‘R&D’, which gives us , alliances connecting , firms. The number of partners involved in each alliance can vary (see Section . for details). In most cases the alliance size is two, however it can also be three or higher.
In order to reconstruct the R&D network, we focus on the time-aggregated data set. Each firm engaged in a R&D alliance becomes a node and un-directed links connect nodes involved in the same alliance. By adopting this procedure, the , R&D alliances result in a total of , links connecting , nodes. To compare collaborations in different industrial sectors, we reconstruct six distinct R&D networks for the six largest industrial sectors. According to our data set, these are related to computer software, pharmaceuti-cals, R&D laboratory and testing, computer hardware, electronic components and com-munications equipment. An alliance is considered as part of a given sector if one of the collaborating firms has a matching SIC code. The details for the sectoral networks are given in Table . Additionally, we compare these sectoral networks with an aggregated R&D network, previously analyzed by [], which was obtained by considering all the R&D alliances together, i.e. more than just the six largest industrial sectors.
.. Co-authorship network
To reconstruct the collaboration network of scientists, we use the data set from the Amer-ican Physical Society about papers published in any APS journal, namely Physical Review Letters, Reviews of Modern Physics, and all Physical Review journals (APS).bFrom this
data set we use the PACSccodes of the papers to assign the papers to different research
areas. We restrict ourselves to six specific PACS codes (more details follow) and to the period from to , for which we use the time-aggregated data. By this, we analyze the same time range for both the R&D and the co-authorship data.
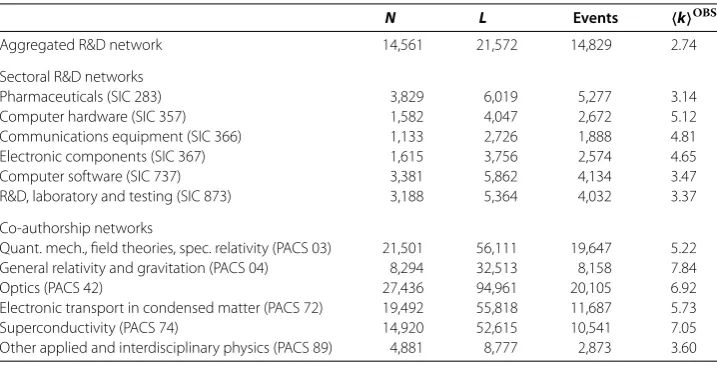
Table 1 Number of nodesN, linksL, collaboration eventsEand average degreekOBS= 2L/N
for the aggregated R&D network, the six largest sectoral R&D networks, and the six representative co-authorship networks
N L Events kOBS
Aggregated R&D network 14,561 21,572 14,829 2.74
Sectoral R&D networks
Pharmaceuticals (SIC 283) 3,829 6,019 5,277 3.14
Computer hardware (SIC 357) 1,582 4,047 2,672 5.12 Communications equipment (SIC 366) 1,133 2,726 1,888 4.81 Electronic components (SIC 367) 1,615 3,756 2,574 4.65 Computer software (SIC 737) 3,381 5,862 4,134 3.47 R&D, laboratory and testing (SIC 873) 3,188 5,364 4,032 3.37
Co-authorship networks
Quant. mech., field theories, spec. relativity (PACS 03) 21,501 56,111 19,647 5.22 General relativity and gravitation (PACS 04) 8,294 32,513 8,158 7.84
Optics (PACS 42) 27,436 94,961 20,105 6.92
Electronic transport in condensed matter (PACS 72) 19,492 55,818 11,687 5.73 Superconductivity (PACS 74) 14,920 52,615 10,541 7.05 Other applied and interdisciplinary physics (PACS 89) 4,881 8,777 2,873 3.60
For all domains, we consider the respective cumulative networks, i.e. the networks obtained by keeping all the links at any time.
but time consuming, data processing. The latter involves matching the titles of the papers in the APS data set with Microsoft Academic Search (MSAS) service, where both papers and authors have unique identifiers. The MSAS is a search engine which mines data from a bibliographic database containing information about scholars and their publications from different disciplines. We have used the Application Programming Interface (API) of MSAS to obtain information about scholars publishing on APS. This way, we obtain a list of unique authors that we can use.
It is worth noticing that the matching procedure at article level was not perfect. About % of the articles were not matched. These unmatched articles often had titles contain-ing special characters needed to write latex formulas and/or Greek letters. This problem affected mainly papers belonging to PACS . Among the matched articles we have sam-pled at random articles and checked the authors’ list. We have found these lists were correct % of the times. The most common error was that one or two authors’ names were missing from the authors’ lists. More details about the coverage of MSAS and the accuracy of the disambiguation procedure are given in Appendix .
To reconstruct the co-authorship network, each unique author is represented by a node and links connect nodes that have co-authored at least one paper in the aggregated data set. Following this procedure, the , papers listed in the data set result in , links connecting , nodes.
(superconductivity) and (other areas of applied and interdisciplinary physics, that for example includes network theory). We report the sizes of these networks in Table .
3.2 Input quantities
Based on the two data sets, we now calculate the two empirical inputs needed for our agent-based model, namely the size distribution of the collaboration events and the activ-ity distribution of the agents.
.. Size of collaboration events
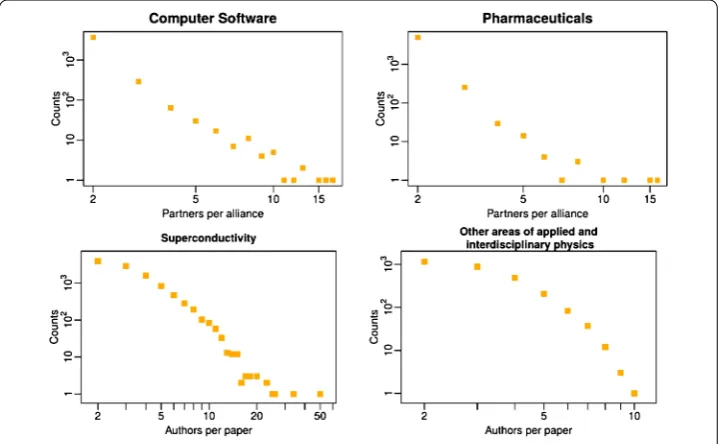
In the SDC alliance data set, the size of a collaboration event is the number of firms per R&D alliance, while in the co-authorship data set it is the number of co-authors per paper. To study these, we analyzed the distributions of partners per collaboration event,P(m), in both considered data sets.
With respect to our six sectoral R&D networks, we find that the size distribution is right-skewed with values ranging between and . It should be noted that the identification of the functional form of these distributions (e.g., power-law, exponential, log-normal and so on) is outside of the scope of this study, therefore we leave it as a possible extension. Most of the collaborations are stipulated between two partners, but some alliances - the so-calledconsortia- involve three or more partners. In Figure we report such distribu-tions for two represetative industrial sectors. Results for four more industrial sectors are presented in Appendix , confirming that the right-skewed distribution holds for all sec-toral R&D networks, with only small differences in the tails of the respective distributions. These results are in line with the ones presented in [] for the aggregated R&D network. Regarding the size of scientific collaborations, we find results similar to the R&D al-liances. I.e., most papers in our APS-MSAS data set have two co-authors with a broad
Figure 3 Distribution of the size of collaboration events.For two representative industrial sectors, computer software (top left) and pharmaceutics (top right), distribution of the number of partners per alliance as measured from the SDC data set. For two representative co-authorship networks,
right-skewed size distribution for all PACS numbers investigated. From our analysis, we have excluded all papers written by only one author because we are interested in collabo-ration networks, whereas such papers would only generate isolated nodes.dAlso, in every
economic data set on inter-firm alliances, a collaboration of size could not exist by defi-nition. Hence, to the purpose of comparing R&D and co-authorship networks, we do not consider single-author papers and the size of the collaboration events starts from in all of our plots. Figure gives representative examples from two PACS numbers. Differently from the sectoral R&D networks, the co-authorship networks exhibit a larger degree of variability among PACS numbers. This is due to the fact that the typical number of au-thors per paper strongly depends on the field. To give an example, the field of applied and interdisciplinary physics is characterized by significantly fewer authors per paper (at most ) than the field of general relativity and gravitation (whose right tail reaches authors per paper). In Figure and Figure in Appendix , we show the distribution of col-laboration sizes for respectively the six sectoral R&D networks and the six co-authorship networks.
.. Agents’ activity
This is one of the two key attributes assigned to agents in our model. We apply a measure developed in the setting of temporal networks [], which has been already used to analyze various data sets [–], also in the context of R&D and co-authorship networks [, ]. Following these approaches, we argue that activity reflects the propensity of an agent to participate in a collaboration event. Precisely, we define the empirical activity of an agenti at timetas the number of collaboration events,et
i,t, involving agentiduring a time window
tending at timetdivided by thetotal numberof collaboration events,Et
t , involving any
agent during the same period of time:
ai,tt= e t i,t
Et t
. ()
For both the SDC alliance and APS-MSAS data sets, we measure the empirical distribu-tion of activity,P(a), for four different time windows,t= , , and . When the time window is shorter than years (the entire data set observation period), we compute the activity by shifting the time window in -year increments and then we average the results. For simplicity, from now on, we will writeai,t= years asai, which is the activity over the
longest time window. Interestingly, we find that these distributions are independent of the size of the time window, which is a robust feature for both R&D and co-authorship collaborations. In Figure , we report these results for two representative sectoral R&D networks and two representative co-authorship networks. For a visualization of the com-plete results for the six sectoral R&D networks see [] (Supplementary information) and for the six co-authorship networks see Figure in Appendix .
3.3 Implementation and optimal model selection
To reproduce the collaboration networks from the two domains, we implement the agent-based model described in Section . For the simulations, we take the number of agents,N, and the total number of collaboration events,E, from the respective empirical networks. The two input parameters, size of the collaboration event,mi, and agent activity,ai, are
Figure 4 Complementary cumulative distribution function (CCDF) of activities.At the top CCDF of the empirical firm activities, measured for two representative industrial sectors (from the SDC data set, [19] Supplementary information). At the bottom CCDF of the empirical author activities, measured for two representative co-authorship networks (from the APS-MSAS data sets). We considered for 4 different time windowstof 1, 5, 10 and 26 years.
free parameters in our model are the five probabilitiespL
s,pLd,pLn,pNLn ,pNLn which we vary
in order to find which combination gives the best match between the simulated and the observed network. For more information about the exploration of the parameter space see Appendix . For the comparison we use the following quantities: average degree,k, aver-age path length,l, and global clustering coefficient,C, and define the respective relative errorsεk,εlandεCbetween the observed and the simulated quantities. We require that
these errors have to be smaller than a thresholdε. For all probability combinations we
perform simulations. We then select the combination that gives us the highest fraction of networks that match the criterionε<ε. The optimal probabilities are indicated using
a star (e.g.p∗L s ).
In Table we report the optimal set of probabilities for the collaboration networks from the two different domains. The network simulated using the optimal set of probabilities will be namedoptimal simulated networks. In Table in Appendix , we report thek,l andCof the optimal simulated networks and they can be compared with the respective values for the observed networks. With this, we are set for thevalidationof our agent-based model which of course has to include features of the network that were not used for thecalibrationof the model.
4 Model validation
4.1 Reproducing four distributions
Table 2 Optimal sets of probabilities to simulated the collaboration networks
p∗sL p∗dL p∗ L
n p∗lNL p∗ NL nl Aggregated R&D network 0.30 0.30 0.40 0.75 0.25
Sectoral R&D networks
Pharmaceuticals (SIC 283) 0.35 0.35 0.30 0.80 0.20
Computer hardware (SIC 357) 0.55 0.30 0.15 0.90 0.10 Communications equipment (SIC 366) 0.75 0.15 0.10 0.80 0.20 Electronic components (SIC 367) 0.65 0.20 0.15 0.90 0.10 Computer software (SIC 737) 0.55 0.20 0.25 0.95 0.05 R&D, laboratory and testing (SIC 873) 0.40 0.40 0.20 0.20 0.80
Co-authorship networks
Quant. mech., field theor., spec. relativity (PACS 03) 0.85 0.05 0.10 0.45 0.55 General relativity and gravitation (PACS 04)† 0.50 0.05 0.45 0.05 0.95
Optics (PACS 42) 0.60 0.05 0.35 0.35 0.65
Electronic transport in condensed matter (PACS 72) 0.50 0.05 0.45 0.30 0.70 Superconductivity (PACS 74) 0.55 0.05 0.40 0.35 0.65 Other applied and interdisciplinary physics (PACS 89) 0.65 0.05 0.30 0.25 0.75
The optimal probabilities are indicated using∗. Recall that the probability of a labeled agent to select an agent with the same label ispLs, to select an agent with a different label ispLdand to select a non-labeled agent ispLn. While, the probability of a non-labeled agent to select a labeled agent ispNLl and to select a non-labeled agent ispNLnl. The probabilitiespLs,pLdandpLn sum up to 1; likewise,pNL
l andpNLnl sum up to 1.†Only for the co-authorship network in general relativity and gravitation (PACS 04) the model is unable to generate a network matching all the three measuresk,landCat the same time. Onlyl
andCcan be retrieved with an accuracy of 30%, while the generatedkis not compatible with the empirical measure. Even though we report these values for completeness, they cannot be considered representative of the real network.
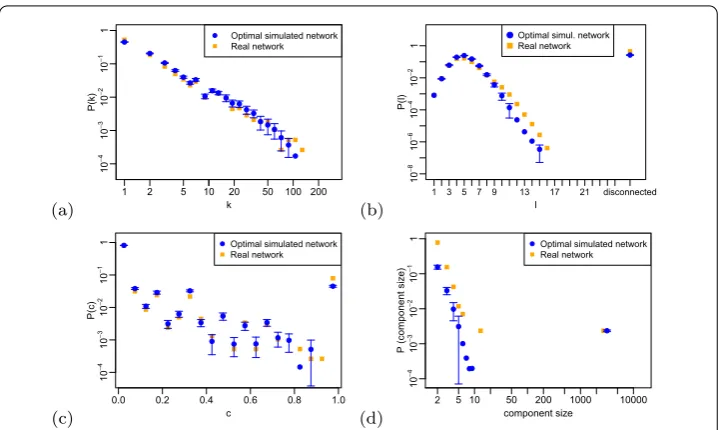
we use macroscopic features such as distributions of degrees, path lengths, local clustering coefficients and sizes of the disconnected components. Additionally, we also investigate microscopic, or agent centric, features such as labels. The validation procedure is similar to the one described in []. To validate the above mentioned distributions, we emphasize that for the calibration we didnotuse information about the distributions, but only about the respective average values,k,landC, to calculate the relative errors.
Figure and Figure show these distributions for one representative sectoral R&D net-work and one co-authorship netnet-work. We observe a remarkable match between the simu-lated and the empirical distributions for all four quantities. In particular, the model repro-duces the emergence of a giant component in both networks, together with many smaller components down to size two.
4.2 Community structures and groups of influence
The second part of our validation regards the modular structure of the collaboration net-works in terms of communities. We start by evaluating and comparing the community structure of the observed networks and of the simulated ones using the optimal set of probabilities. Then, we verify that the groups of influence defined by the agents’ labels well reproduce the community structure of the simulated networks.
.. Community structure of empirical and simulated networks
Figure 5 Distributions of node degrees (a), path lengths (b), local clustering coefficients (c) and component sizes (d) for the real and the 25 optimal simulated networks in ‘Pharmaceuticals’(SIC code 283).The blue circles in our plots correspond to the mean values and the error bars correspond to the standard deviations of all the quantities we analyze on the 25 realizations of each optimal simulated collaboration network. In many cases, the error bars are not visible, because the values are very narrowly distributed across these 25 realizations.
Figure 6 Distributions of node degrees (a), path lengths (b), local clustering coefficients (c) and component sizes (d) for the real and the 25 optimal simulated networks in applied and interdisciplinary physics (PACS number 89).
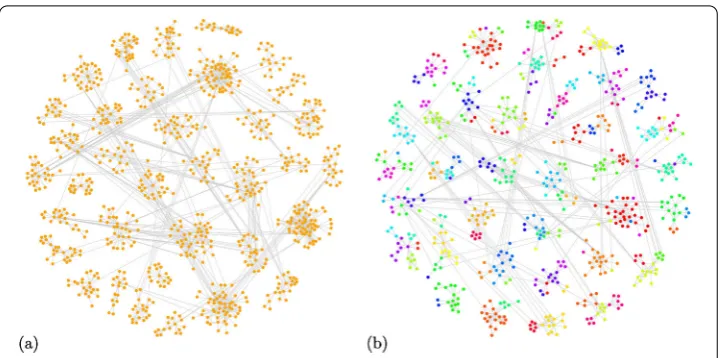
Figure 7 Co-authorship network in applied and interdisciplinary physics (PACS number 89). (a)Visual representation of the empirical network, considering only the 30 largest clusters detected by theInfomap
algorithm. Distinct clusters are represented by grouping nodes in distinct regions of the plot area.(b)Visual representation of one realization of the simulated network, considering only the 30 largest clusters detected by theInfomapalgorithm. Distinct clusters are represented by node groups in distinct regions of the plot area. In addition, we depict our node labels by using different colors: most of the nodes in a given cluster share the same label.
Figure 8 Size distribution of (i) the circles of influence in the 25 realizations of the optimal simulated network, (ii) theInfomapclusters in the 25 realizations of the optimal simulated network and (iii) the
Infomapclusters in the empirical network for ‘Pharmaceuticals’ (SIC code 283) (a) and ‘Applied and interdisciplinary physics’ (PACS number 89) (b).
are characterized by a high modularity as reported in Table in Appendix . Precisely, all theQscores for partitions originated byInfomapare significantly higher than the equiv-alent scores on randomly generated networks with the same degree sequence, especially in the domain of co-authorship networks. We can safely conclude that our highQvalues are indicative of a real modular structure, and not a simple artifact of the network’s size and density [].
Another evidence of their similarity is the modularity score of the optimal simulated networks -Q∗= .±. for the Pharmaceuticals R&D network, andQ∗= .±. for the co-authorship network in interdisciplinary physics. These values are close to their empirical equivalents, . and . respectively. In all cases, the modularity scores are significantly greater (with ap-value computationally indistinguishable from zero) than the ones obtained for a set of randomly generated networks with the same degree sequence, proving that the obtained modularity cannot be expected or explained simply with the degree sequence.
.. Community structure using the agents’ labels
In order to estimate the overlap between the communities detected using theInfomap
algorithm and the group of influence defined by our agents’ labels, we use the normalized mutual information coefficientInorm[]. We find that labels are actually able to reproduce
the community structures of collaboration networks coming from both the economic and the scientific domains.Inorm(Labels, Infomap clusters) = .±. for the
‘Pharma-ceuticals’ R&D network, andInorm(Labels, Infomap clusters) = .±. for the
co-authorship network in interdisciplinary physics. This result is even more remarkable if we consider that theInfomapalgorithm detects structural clusters based on the probability flow of random walks in the network, while our label propagation mechanism consists of an assignment of a fixed membership attribute - which is not only closer to a real phe-nomenon, but also computationally easier.
4.3 Distribution of path lengths at link formation
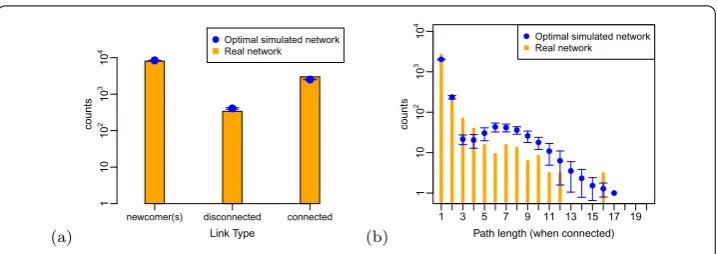
Finally, we compare the empirical and the simulated networks with respect to the dis-tribution of path lengths between every pair of agentsat the moment preceding the link formation. This is different from the distribution of path lengths analyzed before, which was computed on thetime-aggregatednetworks. Now we are interested to know whether agents preferably form links with agents already part of the same connected component or with agents from another component or with newcomers. The respective distribution of link types is shown in Figure for the ‘Pharmaceuticals’ R&D network, and in Figure for the co-authorship network in interdisciplinary physics. In all cases, there is a higher
Figure 10 Temporal path length analysis for the co-authorship network in applied and interdisciplinary physics (PACS number 89). (a)Distribution of link types for empirical and simulated networks: ‘newcomer(s)’ means that at least one of the agents was isolated (i.e. not yet part of the network) before the link formation; ‘disconnected’ refers to agents already belonging to the network, but placed in two disconnected components; ‘connected’ refers to agents already belonging to the same network component prior to the link formation.(b)Distribution of path lengths at the moment of link formation (only for agents belonging to the same connected component).
number of links with agents inside the same connected component or with newcomers. We emphasize the very good match between the empirical and the simulated frequencies of link types.
For links connecting agents which are already in the same connected component we can further discuss the network distance, or path length between two agents. It is inter-esting whether agents at larger network distances are still able to know each other and to form a link. Trivially, agents at distance have already a collaboration (and can start a new one), whereas agents at distance have one collaborator in common (triadic closure). We report our findings about the path length between agents before they engage in a collab-oration in Figure for the ‘Pharmaceuticals’ R&D network, and in Figure for the co-authorship network in interdisciplinary physics. We see that in the case of R&D networks agents preferably choose close collaborators for a new collaboration (path length up to ), whereas for co-authorship networks agents prefer previous collaborators or collaborators at distance .
Let us emphasize that our model well reproduces two important characteristics of col-laboration networks: the high number of repeated interactions and the phenomenon of triadic closure. These are known to have a positive impact on productivity [] and to be a driving force in the formation of new collaborations []. This result is far from being trivial as we have not included neitherad hocmicroscopic rules nor information to reproduce such characteristics.
In conclusion, the model correctly predicts the formation of links between agents irre-spectively of whether they are already in the same network component and gives an exact calculation of the shortest path length at the moment of link formation. In addition, it well captures repeated interactions and the triadic closure phenomenon without using anyad hocmicroscopic information.
5 Discussion and conclusion
5.1 Commonalities in collaboration networks
between scientists. Despite their different origin, these collaboration networks share a number of common features that can be even found on the sub-domain level (SIC and PACS numbers). These empirical features include the right-skewed distribution of collab-oration sizes (Figure ), the distribution of activities to engage in a collabcollab-oration (Figure ) which are very stable across domains and over time, the pronounced community structure of the networks and the existence of a giant-connected component (Figure ).
These commonalities motivated us to use the same agent-based model to explain the structure and dynamics of these collaboration networks. Precisely, we have compared the outcome on thesystemic level, i.e. the networks simulated by the agent-based model and the observed networks, to conclude whether our assumptions for the interactions on the agent levelare justified. We remark that reproducing systemic features along very different dimensions indeed lends evidence to the validity of our agent-based model, because it can-not simply be obtained by a fitting procedure. Specifically, our model is able to reproduce the distributions of degree, of path length, of local clustering coefficients, of component sizes and of path lengths between every pair of agents at the moment of link formation, without imposing any constraints on these features during the calibration procedure.
5.2 Strategies of agents choosing collaboration partners
The agent-based model builds on five probabilities to form a link with another agent, which depend on the label of the initiator (newcomer vs. established agent) and on the counterparty (newcomer vs. established agent with the same or a different label). These agent-centric probabilities are calibrated using only three macroscopic features of the em-pirical networks (mean values of degree, path length and clustering coefficient). Remark-ably, we find that these probabilities have very similar values, regardless of the domains (R&D networks vs. co-authorship networks) and the sub-domains (SIC and PACS num-bers).
Interpreting these probabilities asstrategiesof an agent to choose a collaboration part-ner, we can obtain the following insights:
(i) For all R&D and co-authorship networks, established agents prefer to form links with other established agents (p∗sL+p∗dL> %).
(ii) When forming a link with an established agent, the initiator tends to select a counterparty with the same label, i.e. belonging to the same community (p∗L
s ≥p∗dL).
Comparing the two domains, we find that this general tendency is times larger in co-authorship networks. The probability to select a co-author from adifferent communityp∗dLequals the lowest possible value, %, in all cases.
(iii) A difference between domains is observed in the strategy of the newcomers. For R&D networks, newcomers tend to enter the network by forming links with established agents(p∗NL
l >p∗nlNL). This finding is consistent with empirical evidence
[, ]. However, for all co-authorship networks newcomers tend to enter the network by forming links with othernewcomers(p∗nlNL>p∗lNL). So, the fact that p∗nlNL≥.in co-authorship networks clearly supports this hypothesis.
5.3 Network-endogenous and -exogenous factors
Following the distinction in the literature [] we argue that the strategies of agents in choosing their collaboration partners are determined by both endogenous and exogenous factors. These are known to be crucial in the formation and evolution of the R&D alliances []. However, they have been usually considered separately by empirical and theoretical works [, –], and to our knowledge no study has analyzed their importance in co-authorship networks.
Network-endogenousfactors cover the information that the initiator has about the net-work, for instance information about the network position (i.e. social capital) of its poten-tial partners. Thus, these factors take into account collaboration patterns already present in the networks. These factors are captured by the probabilities to link to alabeled agent, pL
s,pLdandpNLl .Network-exogenousfactors do not consider such information, but instead
use external information such as the technological, scientific or geographical proximity of the agents. These factors are captured by the probabilities to link to anewcomer,pL
nand
pNL nl .
Comparing the two types of factors, we find thatnetwork-endogenousfactors are pre-dominant in the formation of new collaborations in each of the collaboration networks analyzed in this study. In other words, the existing network structures explain most of the newly formed links. In terms of linking probabilities, this means thatp∗L
s +p∗dL+p∗lNLis
always bigger thanp∗L
nl +p∗nlNL(where∗ refers to the optimal probability) for all sectoral
R&D networks and co-authorship networks. This result is also in line with the empirical finding [, ] that firms in R&D networks prefer to establish alliances with other firms which have an history of previous alliances.
5.4 Reconstruction of communities by means of labels
In our model, labels represent the fact that agents belong to certain communities. This way, newcomers and established agents can be distinguished. Moreover, different labels allow to further differentiate between groups of agents with a certain interest. The label dynamics explained in Section provides a mechanism of label propagation.
We point out that our assumption about the label attribute is in agreement with the re-sults reported by [], that have identified the presence of communities based on ground truth in real networks. Such communities include nodes that do not necessarily share fea-tures such as the same geographical provenience, or the belonging to the same institution. They are rather defined dynamically, through consecutive interactions and link formation. The same reasoning holds for both R&D and co-authorship networks, where communi-ties of collaborating agents do not depend on their geographical or knowledge distance, but are defined by the subsequent propagation of a (virtual) membership attribute, which is the ‘label’.
communities is an empirical fact, therules for their formationare not fully understood. With this work, we provide evidence that such rules can be inferred from the empirical networks and are not only able to reproduce the community structure, but also other, more sophisticated features of the networks.
Appendix 1
Empirical distribution of event sizes
We report the distributions of partners per collaboration event for the two analyzed data sets. In the R&D network, this quantity represents the number of firms per R&D alliance, and in the co-authorship network the number of authors per paper. Four representative distributions (two from each domain) were shown in Figure in Section ..
Most of the collaborations (%) are stipulated between two partners, but some alliances - the so-calledconsortia- involve three or more partners. These features are found also when considering separately the six largest industrial sectors with only small differences in the tails of the respective distributions. The plots of the distributions for the six largest industrial sectors are in Figure .
In Figure we report the size distribution of collaboration events for the different PACS number. Let us point out that in the General relativity and gravitation the observed strong
Figure 12 Distribution of the number of authors per paper for our six representative co-authorship networks, as measured from the APS-MSAS data set.
increase of number of papers co-authored by about people is an artifact of the data set. As a matter of fact, we recognize that papers produced by large international collabora-tions, such as LIGO, may have many more than co-authors, but their author lists have been cut to a maximum of co-authors. For most fields, this does not play any role since few papers are produced by such large collaborations. PACS (General relativity and gravitation) is an exception and we argue that this missing information makes the ABM unable to reproduce with good precision the network structure (see Appendix ).
Empirical distribution of activities
We report the distribution of activities for all our representative co-authorship networks in Figure . As discussed in Section ., this distribution are not dependent of the chosen time window and always show a right-skewed distribution. Note that the distribution of activities for the six sectoral R&D networks are already reported in [] (Supplementary information).
Coverage of MSAS and accuracy of the author disambiguation procedure
Figure 13 Complementary cumulative distribution function (CCDF) of the empirical , measured for the six selected co-authorship networks in the APS-MSAS data set with 4 different time windowst
of 1, 5, 10 and 26 years.
, papers. To retrieve authors we searched and matched the article titles listed in the APS data in MSAS. When an article listed in the APS data was found in MSAS, we were taking the authors name reported in MSAS. We matched about , articles between -- and -- and , between -- and --.
When considering only PACS , , , , and between -- and --, we have about , distinct articles in the APS data set. By using the titles of these , articles and MSAS, we matched about , articles, i.e. about the % of them. Thanks to MSAS, we also obtained the authors’ names and authors’ unique identi-fication number of these articles, , distinct authors. Among these authors we have calculated about , co-authorship links. We do not have the co-authorship links for the APS data by itself as we have not used its authors’ information. As mentioned in the Section , in the APS data the authors name are given as strings and are not disambiguated. Hence, they cannot be used to reconstruct the collaboration network.
The coverage of MSAS was not perfect as we did not match about % of the papers. For of these unmatched papers we have manually checked the titles. We have found that % of the titles contained special characters, such as round/squared parenthesis, Greek letters and/or the symbols_andˆ. When manually checking matched titles, only % of the them contained such special characters. Therefore articles containing the above mentioned special characters were often not matched. This problem affected principally paper of belonging to the field of superconductivity (PACS ). From this PACS only % of the articles were matched. We also find a negative correlation of –. between the fraction of articles matched with the year in which they were printed. This means that older paper in our time period were matched more easily compared to newer ones.
articles the authors’ names were split in two (resulting as two distinct authors), for article there was an extra author in the author list, for articles there were two missing authors and for articles there was one missing author. In addition, similarly to [] we have sam-pled pairs of matched articles (in total other articles) assigned to the same author. We manually checked how many times the pairs were correctly assigned to the same au-thor by looking at scholar profiles, institution websites, coauau-thors lists, etc. We find that % of the pairs correctly correspond to the same author, % of the pairs were incorrect and for the remaining % we were not able to determine if they were correctly assigned or not to the same author. In other words, for this last % we could not determine if both articles had a common co-author or not.
Appendix 2
Exploration of the parameter space
In Section ., we have discussed how we simulate the collaboration networks and how select the optimal set of probabilities from the simulations. Here we would like to give some details about the simulations. For each of the examined collaboration network, we explore the parameter space by varying the values ofpLs,pLdandpNLnl between (, ) by steps of .. SincepLs andpLd are the probabilities of two mutually exclusive events, we also have to consider the condition pLn= –pLs –pLd> . This procedure gives /. – = values for pNLnl and (/. – )(/. – )/ = ∗/ combinations of values for (pLs,pLd) creating a parameter space made of , points. Thus, to explore the parameter space requires a remarkable computational effort because each of the collaboration networks originates a parameter space composed of , points, for each of which we run computer simulations - for a total of around million simulations.
Average degree, path length and clustering coefficient for observed and optimal simulated networks
In Table , we report the average degreek, average path lengthland global clustering coefficientCfor the empirical networks and for the simulated ones using the optimal set of probabilities. We also report the considered threshold. It should be noted that - given the extreme variability of the networks we test, in terms of size, density and modularity - we are forced to adjust the error threshold valueε[], in order to find a meaningful number of parameter configurations that are able to reproduce the empirical network with a pre-cisionε. In particular for some co-authorship networks, we are not able to retrievek,
landCwith an accuracy as low as % (which we could achieve for the time-aggregated R&D network, []). However, all the values we obtain for our simulated networks are fairly accurate and deviate from the empirical values by less than %. The only exception is represented by the co-authorship network in the field of general relativity and gravitation (PACS number ), for which the model fails to generate a network matching all the three measuresk,landCat the same time. We argue that this is due to incomplete informa-tion in our data set and the consequent arising of a bimodal distribuinforma-tion of the number of partners per collaboration - or, precisely, authors per paper - in this scientific field. Thus the linking probabilities and all the other results associated to this co-authorship network cannot be considered representative of the real network.
dif-Table 3 Summary of average statistics for the empirical and optimal simulated networks
kOBS lOBS COBS ε0 k∗ l∗ C∗
Aggregated R&D network 2.74 5.41 0.101 2% 2.76 5.33 0.098
Sectoral R&D networks
Pharmaceuticals (SIC 283) 3.14 4.94 0.097 2% 3.13 4.95 0.097 Computer hardware (SIC 357) 5.12 3.70 0.161 6% 5.37 3.59 0.175 Communications equipment (SIC 366) 4.81 3.75 0.203 2% 4.83 3.76 0.210 Electronic components (SIC 367) 4.65 3.80 0.168 2% 4.76 3.83 0.174 Computer software (SIC 737) 3.47 4.33 0.138 3% 3.56 4.27 0.141 R&D, laboratory and testing (SIC 873) 3.37 5.15 0.205 3% 3.30 5.22 0.200
Co-authorship networks
Quant. mech., field theor., spec. relativity (PACS 03) 5.22 6.43 0.379 12% 5.83 5.58 0.392 General relativity and gravitation (PACS 04) 7.84 6.27 0.666 >30% 16.64 4.39 0.535
Optics (PACS 42) 6.92 6.40 0.425 10% 7.60 5.79 0.451 Electronic transport in condensed matter (PACS 72) 5.73 7.06 0.448 8% 6.15 6.58 0.471 Superconductivity (PACS 74) 7.05 5.87 0.443 7% 7.51 5.51 0.465 Other areas of applied and interdisciplin. physics (PACS 89) 3.60 8.28 0.462 8% 3.82 7.82 0.501
For the empirical collaboration networks, we report the average degree,kOBS, average path length,lOBS, and global clustering coefficient,COBS. For optimal simulated network, we report the mean values over the 25 network realizations of average degree,k∗, average path length,l∗and global clustering coefficient,C∗. We also report the error threshold or accuracyε0.
Figure 14 Pearson-correlation coefficients and scatter plots between the calibration errors,ε0, and 4
macroscopic properties of the analyzed networks: number of nodes,N(top left), number of links,L
(top right), average path length,lOBS(bottom left) and global clustering coefficient,COBS(bottom
right).The dots in red and blue are respectively the R&D and the co-authorship networks.
ferent beginnings of the observation period (from to ), and the results remained qualitatively unchanged.
Table 4 Modular properties for the aggregated R&D network, the six largest sectoral R&D networks, and the six representative co-authorship networks
Clusters Q Qrand
Aggregated R&D network 3,561 0.679 0.570±0.001
Sectoral R&D networks
Pharmaceuticals (SIC 283) 860 0.607 0.438±0.002
Computer hardware (SIC 357) 783 0.623 0.502±0.002 Communications equipment (SIC 366) 749 0.653 0.461±0.002 Electronic components (SIC 367) 302 0.502 0.311±0.002 Computer software (SIC 737) 354 0.531 0.333±0.002 R&D, laboratory and testing (SIC 873) 256 0.527 0.317±0.003
Co-authorship networks
Quant. mech., field theories, spec. relativity (PACS 03) 3,029 0.779 0.2344±0.0004 General relativity and gravitation (PACS 04) 1,207 0.795 0.128±0.016
Optics (PACS 42) 2,853 0.794 0.195±0.002
Electronic transport in condensed matter (PACS 72) 2,411 0.832 0.2609±0.0004 Superconductivity (PACS 74) 1,663 0.769 0.208±0.003 Other applied and interdisciplin. physics (PACS 89) 966 0.920 0.395±0.001
For all domains, we consider the respective cumulative networks, i.e. the networks obtained by keeping all the links at any time. For each network, we report the number of clusters detected by theInfomapalgorithm, the modularity scoreQof the network, and (as robustness check) the modularity scoreQrandobtained in a set of 100 randomly generated networks with the same size and degree sequence as the network under examination.
always positive and greater than .. This indicates that the model performs worst when it has to reconstruct more complicated topologies. From this analysis, we have excluded the co-authorship network of PACS as the ABM failed to reproduce such network.
Appendix 3
Modularity for the empirical collaboration networks
In Table , we report the number of communities detected byInfomapon the empir-ical networks and the normalized modularity scoreQfor the empirical networks given
theInfomappartitions. These values should be compared to the normalized modularity
scoreQrandobtained from a set of randomly generated networks using the degree
se-quence from the empirical networks. On each of the random network we have detected cluster of nodes usingInfomapand computed the normalized modularity. Thus,Qrands
reported in Table are the mean normalized modularity scores from the randomly generated networks for each sub-domain with their respective variance. As discussed in Section ., the modularity scores of the empirical networks are always higher than the ones coming from the randomly generated networks indicating that the detected modular structure is not an artifact of the degree sequence.
Funding
GV acknowledges support from the Swiss State Secretariat for Education, Research and Innovation (SERI), Grant No. C14.0036 as well as from EU COST Action TD1210 KNOWeSCAPE. MVT acknowledges support from the ETH Risk Center through the Seed Project: Performance and Resilience of Collaboration Networks.
Abbreviations
Agent-based model (ABM). Research and Development (R&D). Standard Industrial Classification (SIC). American Physical Society (APS). Physics and Astronomy Classification Scheme (PACS). Microsoft Academic Search (MSAS).
Availability of data and materials
available at the website http://thomsonreuters.com/sdc-platinum. Feel free to get in contact with the corresponding author in case you need more information.
Ethics approval and consent to participate
Not applicable.
Competing interests
The authors declare that they have no competing interests.
Consent for publication
Not applicable.
Authors’ contributions
MVT and FS have conceived and designed the research. MVT and GV have analyzed the data and produced the results. All authors discussed the research, wrote and approved the final version of the manuscript.
Author details
1Department of Management, Technology and Economics, ETH Zurich, Weinbergstrasse 56/58, Zurich, 8092, Switzerland. 2Ernst & Young, Maagplatz 1, Zürich, 8005, Switzerland.
Endnotes
a http://thomsonreuters.com/sdc-platinum/ b http://www.aps.org/
c Physics and Astronomy Classification Scheme (PACS).
d With this approach, we have excluded 11,347 articles and 2,359 authors from our analysis.
Publisher’s Note
Springer Nature remains neutral with regard to jurisdictional claims in published maps and institutional affiliations.
Received: 18 April 2017 Accepted: 23 August 2017
References
1. Narin F (1991) Globalization of research, scholarly information, and patents - ten year trends. Ser Libr 21(2-3):33-44 2. Luukkonen T, Persson O, Sivertsen G (1992) Understanding patterns of international scientific collaboration. Sci
Technol Human Values 17(1):101-126
3. Georghiou L (1998) Global cooperation in research. Res Policy 27(6):611-626. doi:10.1016/S0048-7333(98)00054-7 4. Hagedoorn J (2002) Inter-firm R&D partnerships: an overview of major trends and patterns since 1960. Res Policy
31(4):477-492
5. Rosenkopf L, Padula G (2008) Investigating the microstructure of network evolution: alliance formation in the mobile communications industry. Organ Sci 19(5):669-687
6. Tomasello MV, Napoletano M, Garas A, Schweitzer F (2017) The rise and fall of R&D networks. Ind Corp Change 26(4):617-646. doi:10.1093/icc/dtw041
7. Newman MEJ (2001) Clustering and preferential attachment in growing networks. Phys Rev E 64:025102. doi:10.1103/PhysRevE.64.025102
8. Guimera R, Uzzi B, Spiro J, Amaral LAN Team assembly mechanisms determine collaboration network structure and team performance. Science 308(5722):697-702 (2005)
9. Sarigöl E, Pfitzner R, Scholtes I, Garas A, Schweitzer F (2014) Predicting scientific success based on coauthorship networks. EPJ Data Sci 3(1):9. doi:10.1140/epjds/s13688-014-0009-x
10. Tomasello MV, Tessone CJ, Schweitzer F (2016) A model of dynamic rewiring and knowledge exchange in R&D networks. Adv Complex Syst 19(1-2):1-23. doi:10.1142/S0219525916500041
11. Sorenson O, Rivkin JW, Fleming L (2006) Complexity, networks and knowledge flow. Res Policy 35(7):994-1017. doi:10.1016/j.respol.2006.05.002
12. König MD, Battiston S, Napoletano M, Schweitzer F (2011) Recombinant knowledge and the evolution of innovation networks. J Econ Behav Organ 79(3):145-164
13. Sammarra A, Biggiero L (2008) Heterogeneity and specificity of inter-firm knowledge flows in innovation networks. J Manag Stud 45(4):800-829. doi:10.1111/j.1467-6486.2008.00770.x
14. Valverde S, Sole RV, Bedau MA, Packard N (2007) Topology and evolution of technology innovation networks. Phys Rev E 76:056118
15. Scholtes I, Wider N, Garas A (2016) Higher-order aggregate networks in the analysis of temporal networks: path structures and centralities. Eur Phys J B 89(3):1-15. doi:10.1140/epjb/e2016-60663-0
16. Estrada E, Rodríguez-Velázquez JA (2005) Subgraph centrality in complex networks. Phys Rev E, Stat Nonlinear Soft Matter Phys 71(5):056103
17. Borgatti SP (2005) Centrality and network flow. Soc Netw 27(1):55-71
18. König MD, Battiston S, Napoletano M, Schweitzer F (2012) The efficiency and stability of R&D networks. Games Econ Behav 75(2):694-713
19. Tomasello MV, Perra N, Tessone CJ, Karsai M, Schweitzer F (2014) The role of endogenous and exogenous mechanisms in the formation of R&D networks. Sci Rep 4:5679. doi:10.1038/srep05679
20. Tomasello MV, Tessone CJ, Schweitzer F (2015) Quantifying knowledge exchange in R&D networks: a data-driven model. J Evol Econ. doi:10.2139/ssrn.2635945
22. Fruchterman TMJ, Reingold EM (1991) Graph drawing by force-directed placement. Softw Pract Exp 21(11):1129-1164
23. Yang J, Leskovec J (2012) Defining and evaluating network communities based on ground-truth. In: Proceedings of the ACM SIGKDD workshop on mining data semantics (MDS’12). ACM, New York, pp 3:1-3:8.
doi:10.1145/2350190.2350193
24. Holme P, Saramäki J (2012) Temporal networks. Phys Rep 519(3):97-125
25. Barabasi A-L (2005) The origin of bursts and heavy tails in human dynamics. Nature 435(7039):207-211 26. Barabasi A-L, Albert R (1999) Emergence of scaling in random networks. Science 286:509-512
27. Pastor-Satorras R, Vazquez A, Vespignani A (2001) Dynamical and correlation properties of the Internet. Phys Rev Lett 87(25):Article ID 258701. doi:10.1103/PhysRevLett.87.258701
28. Perra N, Goncalves B, Pastor-Satorras R, Vespignani A (2012) Activity driven modeling of time varying networks. Sci Rep 2:469. doi:10.1038/srep00469
29. Rosvall M, Bergstrom CT (2008) Maps of random walks on complex networks reveal community structure. Proc Natl Acad Sci 105(4):1118-1123
30. Reichardt J, Bornholdt S (2006) When are networks truly modular? Phys D: Nonlinear Phenom 224(1):20-26 31. Danon L, Diaz-Guilera A, Duch J, Arenas A (2005) Comparing community structure identification. J Stat Mech Theory
Exp 2005(09):09008
32. Petersen AM (2015) Quantifying the impact of weak, strong, and super ties in scientific careers. Proc Natl Acad Sci 112(34):4671-4680. doi:10.1073/pnas.1501444112
33. Powell WW, Koput KW, Smith-Doerr L (1996) Interorganizational collaboration and the locus of innovation: networks of learning in biotechnology. Adm Sci Q 41(1):116-145
34. Walker G, Kogut B, Shan W (1997) Social capital, structural holes and the formation of an industry network. Organ Sci 8(2):109-125
35. Cowan R, Jonard N (2004) Network structure and the diffusion of knowledge. J Econ Dyn Control 28(8):1557-1575 36. Burt RS (1992) Structural holes: the social structure of competition. Harvard University Press, Cambridge 37. Gulati R (1995) Social structure and alliance formation patterns: a longitudinal analysis. Adm Sci Q 40(4):619-652 38. Podolny JM (1993) A status-based model of market competition. Am J Sociol 98(4):829-872