DOI 10.1007/s12651-011-0079-1
R E S E A R C H PA P E R
A research note on the determinants and consequences
of outsourcing using German data
John T. Addison·Lutz Bellmann·André Pahnke· Paulino Teixeira
Accepted: 21 April 2011 / Published online: 12 May 2011 © Institut für Arbeitsmarkt- und Berufsforschung 2011
Abstract Using German data from the Institute for Em-ployment Research Establishment Panel, this paper con-structs two main measures of outsourcing and examines their determinants and consequences for employment. There are some commonalities in the correlates of the two mea-sures of outsourcing, as well as agreement on the absence of adverse employment effects across all industries. For one specification, however, some negative effects are reported for manufacturing industry, balanced by positive effects for the services sector for another. But there are no obvious in-dications of survival bias. This is because the association be-tween outsourcing and plant closings is predominantly neg-ative, albeit poorly determined.
Keywords Outsourcing·Organizational change· Employment change·Plant closings·Value added JEL Classification F16·J23
J.T. Addison (
)Department of Economics, Moore School of Business, University of South Carolina, Columbia, SC 29208, USA e-mail:[email protected]
J.T. Addison·P. Teixeira IZA, Bonn, Germany
L. Bellmann
Institut für Arbeitsmarkt- und Berufsforschung, Bundesagentur für Arbeit, Department of Economics, University Erlangen-Nuremberg, Nuremberg, Germany
A. Pahnke
Institut für Arbeitsmarkt- und Berufsforschung der Bundesagentur für Arbeit, Nuremberg, Germany
P. Teixeira
Faculdade de Economia, Universidade de Coimbra, Coimbra, Portugal
Einige Bemerkungen zu den Bestimmungsgründen und Auswirkungen von Outsourcing auf Basis deutscher Daten
Zusammenfassung Auf der Basis der Daten des IAB-Betriebspanels werden in dem Papier zwei Outsourcing- In-dikatoren gebildet und die Determinanten dafür sowie die Beschäftigungseffekte untersucht. Beide Indikatoren wei-sen Gemeinsamkeiten bei den Korrelationen mit anderen Variablen auf. In keinem Fall zeigen sich in unseren Re-gressionsmodellen für alle Wirtschaftszweige negative Be-schäftigungseffekte. Bei einer Modellspezifikation werden jedoch negative Beschäftigungseffekte für das Verarbeiten-de Gewerbe, aber auch positive Beschäftigungseffekte für den Dienstleistungssektor bei einer anderen Modellspezifi-kation ermittelt. Wir finden auch keine Hinweise auf Ver-zerrungen, die durch das Überleben der Betriebe bestimmt sind. Dies liegt daran, dass für die Beziehung zwischen Out-sourcing und Betriebsschließungen ein im Wesentlichen ne-gativer Zusammenhang besteht, der allerdings nur schwach ausgeprägt ist.
1 Introduction
an international trade context (see Amiti and Wei 2005; Feenstra and Hanson 1999; Hijzen et al. 2005).1,2 In any event, the backdrop to our study is, therefore, a contin-uing paucity of studies using German micro data of any kind, with the notable exceptions of papers by Becker et al. (2005a,2005b), Becker and Muendler (2008), Görzig et al. (2005), and Wagner (2009). And, returning to the interna-tional context, there are only a few investigations that dis-tinguish between the manufacturing and the service sectors. Abramovsky and Griffith (2006) consider the impact of in-formation and communication technology as an influential factor in the firm’s business service outsourcing decision. Our distinction between manufacturing and service reveals some interesting preliminary insights in this regard.
But more generally, the present treatment takes a differ-ent track in examining the determinants and consequences of outsourcing. Specifically, it uses German data from the In-stitute for Employment Research (Institut für
Arbeitsmarkt-und Berufsforschung, or IAB) Establishment Panel to
inves-tigate the role of plant characteristics in determining (two measures of) outsourcing and the role of outsourcing in em-ployment change and plant survival. The consideration of plant survival assists our understanding of the effects of out-sourcing on employment since it may either encourage the persistence of firms or indicate subsequent market difficul-ties. Our empirical discussion of outsourcing and plant clo-sure does not point to any obvious survival bias.
2 Measuring outsourcing at establishment level
The IAB Establishment Panel was initiated in 1993 (1996 for eastern Germany). It contains around 16,000 establish-ments. Data are collected in personal interviews with the owners or senior managers of the establishment by profes-sional interviewers. The questions cover such themes as the number of employees and their qualifications, the number of temporary and agency workers, working hours (every sec-ond year since 2002), coverage by a collective agreement at industry or firm level, establishment sales turnover, the expected development of turnover, the share of sales at-tributed to intermediate inputs and external costs (which we use to construct our first measure of outsourcing), export share, the share of total investment (comprising both expan-sion investments and, until 2007, investments in information and communications technology), the total wage bill, profit
1For studies using micro data, however, see Görg et al. (2008a,2008b), and Görg and Hanley (2005,2007). Whereas these studies focus on in-ternational outsourcing, Girma and Görg (2004) and Görg and Hanley (2004) consider the determinants and effects of outsourcing in general (see also Görzig et al.2005; Ohnemus2009; Broedner et al.2009). 2The problem with firm-level data is that the effect of acquiring es-tablishments from other firms may counteract any observed tendency toward outsourcing on the part of the (acquiring) firm.
sharing (irregularly in the five surveys since 1998 but com-parably since 2000), together with the technological status of the establishment (except in 2004), its legal status and corporate form, age, and overall economic performance, re-organization measures undertaken and process/product in-novations introduced (every third year), and company fur-ther training activities (every ofur-ther year). Since 2000 the works council status of the plant has been asked every year after an hiatus in the 1990s, and (for 2006 alone) the qual-ity of the works council from the perspective of the manager respondent. Further, the second outsourcing variable used in the present exercise is taken from a question on major organizational change including whether or not the estab-lishment had increased its purchases of products/services from outside sources over the course of the preceding two years. This question was initiated in 1998 and has been asked every third year from 2001. These variables have been used to construct regressors in dynamic labor demand equa-tions in the usual manner (e.g. Bellmann and Pahnke2006; Addison et al.2008).
As we have intimated, the key outsourcing measures con-tained in the IAB Panel pertain to the share of sales
at-tributed to intermediate inputs and external costs (in the
year preceding the survey)3and organizational change over the course of the preceding two years involving a greater
ac-quisition of goods and services (i.e. from outside the firm).4
Specifically, the former share is converted to an absolute (Euro) value and then expressed as a share of value added. We note parenthetically that we also experimented with us-ing the answers to this question directly, expressus-ing the de-rived value of externally sourced inputs as a percentage of the total wage bill after Görg and Hanley (2005). Unfortu-nately asking respondents to estimate a ‘share of X in Y’ variable is problematic, leading as it does to back-of-the-envelope calculations on the part of the respondent. Not sur-prisingly the results of using such measures are mixed; ex-amples are available from the authors upon request.
3The actual survey question is as follows: “What share of sales was at-tributed to intermediate inputs and external costs [in the previous year], i.e. all raw materials and supplies purchased from other businesses and institutions, merchandise, wage work, external services, rents and other costs (e.g. advertising and agency expenses, travel costs, com-missions, royalties, postal charges, insurance premiums, testing costs, consultancy fees, bank charges, contributions to chambers of trade and commerce and professional associations)?
We used the value of externally sourced inputs as a share of value added in both levels and differences, while recog-nizing that changes in the ratio need not necessarily repre-sent changes in outsourcing but may instead reflect changes in either input or output prices—as well as how establish-ments manage their inventories of finished goods.
Our second measure of outsourcing is in principle unaf-fected by changes in either input or output prices since it merely inquires of the manager respondent whether or not there was increased reliance on bought-in products and ser-vices over a two-year interval. This measure although inno-vative has the downside that we do not know the magnitudes in question (viz. the degree of outsourcing) merely the direc-tional influence.
By way of summary, our two broad measures of out-sourcing are not without blemish. The virtue of the former measure is that we can observe the current level of out-sourcing, even if we must remain cautious about measured changes in outsourcing derived from differences in levels. The second measure allows us to identify outsourcing es-tablishments without conveying any information about the extent of the process. Expressed differently, given the non-contiguous timing of the surveys, we cannot use information on increased reliance on outsourcing from the organizational change question to identify an acceleration or deceleration of outsourcing over time.
We use a common set of covariates for the determinants and consequences of outsourcing. These comprise sales per employee (measured in units of thousand euro (kEUR)), the share of sales attributable to exports, expectations of ris-ing future sales, dummies for investment in information and communication technology and investment in production fa-cilities, an advanced state of technology dummy constructed from a five-element question where the management respon-dent is asked to assess the plant’s overall state of on tech-nology relative to other establishments in the same indus-try, number of employees, wages per employee (kEUR), the shares of high-skilled workers and workers on fixed-term contracts, the separation or labor turnover rate, works coun-cil presence,5 coverage by a collective agreement at either sectoral or plant level, and whether the plant was located in western (as opposed to eastern) Germany. In addition, a number of plant characteristics were included, namely, dum-mies indicating if the plant was established before 1990, whether it was a singestablishment firm, and the exact le-gal form of the enterprise.6Finally, our regressions include
5Since works councils may only be formed in establishments with at least five permanent employees, our sample excludes plants employing fewer than this number of employees.
6We distinguish between sole traders (the omitted category), partner-ships, limited liability corporations, companies limited by shares, pub-lic corporations/foundations, and other legal forms (e.g. cooperatives).
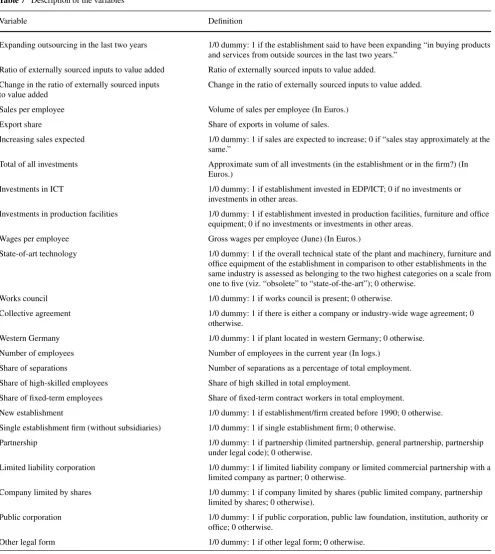
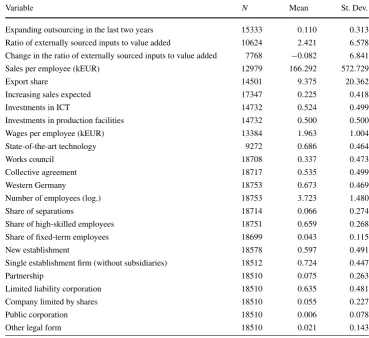
in excess of 30 industry dummies, where the exact number depends on the dependent variable. We restricted our sample period mainly to the interval 2002–2004, extended to 2006 for the survival component of the analysis.7(Variable def-initions and descriptive statistics are provided in Tables7 and8, respectively.)
3 Findings
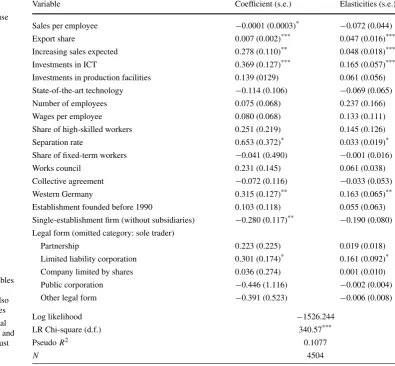
Results on the determinants of outsourcing are provided in Tables1 and2. Table 1 presents logit results for the ‘or-ganizational change’ measure, namely, expanded usage of bought-in products over the two-year interval ending on June 30, 2004. (Marginal effects of the covariates on the in-dicator variable appear alongside the coefficient estimates.) Plants with increasing recourse to outsourcing can be seen to be disproportionately export-led, to have made investments in information and communications technology, to have ex-pectations of expanded business volume over the course of the current year, and to be located in western Germany. They also record higher labor turnover. Outsourcing is also higher in limited liability corporations than other legal forms, but single-plant enterprises clearly engage in less outsourcing. Despite the importance of investments in information and communications technology—here corroborating the results obtained by Abramovsky and Griffith2006—there is no in-dication that the technological status of the plant matters, or that mature plants outsource more. On this measure, neither industrial relations institution (viz. works councils and col-lective bargaining coverage) nor workforce characteristics seem to influence outsourcing.8
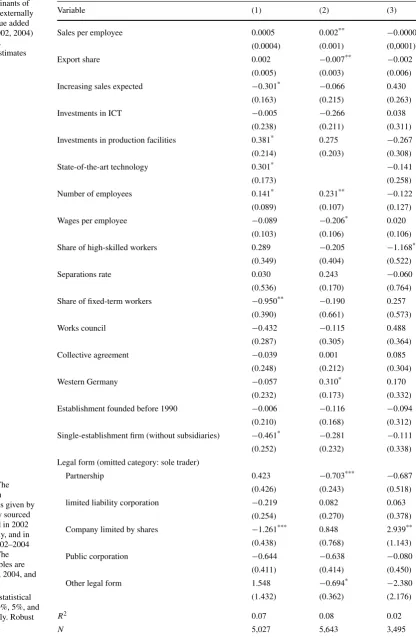
Material on the other measure of outsourcing is contained in Table2. The first two columns give results for the ratio of externally sourced inputs to value added in levels form for 2002 and 2004. The third column presents findings for changes in that ratio between 2002 and 2004. Beginning with the levels results, the first observation to make is that, with the exception of number of employees, no variable is consistently statistically significant. Second, while a number of variables achieve statistical significance in either year— examples include investments in production facilities, state-of-the-art technology (not surveyed in 2004), location in western Germany, share of fixed-term contract workers, and single-firm establishments—there are also some sign rever-sals (e.g. export share in 2004 where the coefficient estimate
7We also investigated other time intervals (e.g. 1999–2001). Results are available from the authors upon request.
Table 1 The determinants of
outsourcing, organizational change measure: expanded use of bought-in products and services, 2002–2004, logit model
Notes: Right-hand side variables are base-year (2002)
characteristics. The model also includes 31 industry dummies *,**, and***denote statistical significance at the 10%, 5%, and 1% levels, respectively. Robust standard errors are in parentheses
Variable Coefficient (s.e.) Elasticities (s.e.)
Sales per employee −0.0001 (0.0003)* −0.072 (0.044)
Export share 0.007 (0.002)*** 0.047 (0.016)***
Increasing sales expected 0.278 (0.110)** 0.048 (0.018)***
Investments in ICT 0.369 (0.127)*** 0.165 (0.057)***
Investments in production facilities 0.139 (0129) 0.061 (0.056) State-of-the-art technology −0.114 (0.106) −0.069 (0.065)
Number of employees 0.075 (0.068) 0.237 (0.166)
Wages per employee 0.080 (0.068) 0.133 (0.111)
Share of high-skilled workers 0.251 (0.219) 0.145 (0.126)
Separation rate 0.653 (0.372)* 0.033 (0.019)*
Share of fixed-term workers −0.041 (0.490) −0.001 (0.016)
Works council 0.231 (0.145) 0.061 (0.038)
Collective agreement −0.072 (0.116) −0.033 (0.053)
Western Germany 0.315 (0.127)** 0.163 (0.065)**
Establishment founded before 1990 0.103 (0.118) 0.055 (0.063) Single-establishment firm (without subsidiaries) −0.280 (0.117)** −0.190 (0.080) Legal form (omitted category: sole trader)
Partnership 0.223 (0.225) 0.019 (0.018)
Limited liability corporation 0.301 (0.174)* 0.161 (0.092)*
Company limited by shares 0.036 (0.274) 0.001 (0.010)
Public corporation −0.446 (1.116) −0.002 (0.004)
Other legal form −0.391 (0.523) −0.006 (0.008)
Log likelihood −1526.244
LR Chi-square (d.f.) 340.57***
PseudoR2 0.1077
N 4504
changes from positive and statistically insignificant to neg-ative and statistically significant). Third, there are few com-monalities with Table1; for example, expectations of higher sales in 2002 and a higher export share in 2004 are now as-sociated with a reduced ratio of externally sourced inputs to value added. For their part, the results in the third col-umn of the table indicate almost no statistically significant determinants of (changes in) the outsourcing ratio—and a disappointingly low coefficient of determination. The sole exceptions are companies limited by shares and the share of high-skilled employees, where the associations are positive and negative, respectively.
Summarizing our findings with respect to the determi-nants of outsourcing, there are few signs from the evidence on changes in outsourcing at least that the phenomenon is associated with reduced sales per employee, technological sluggishness, or low-wage firms. Although there is some supporting evidence from the analysis in levels of variables (e.g. the positive influence of state-of-the-art technology and investments in production facilities), there are also some contrary indications (the negative and marginally
statisti-cally significant coefficient estimate for wages per employee in 2004). On balance, then, we might have expected to draw on more direct evidence than we have uncovered (i.e. be-yond the positive associations with export share, expected sales, and investments in information and communications technology and here only for one of the outsourcing mea-sures). And, although outsourcing might be viewed as an al-ternative form of workforce flexibility, note that the inverse association between the share of fixed-term workers and out-sourcing was never statistically significant in the change in outsourcing equations (only for outsourcing in levels for 2002).
Table 2 The determinants of
outsourcing, ratio of externally sourced inputs to value added measure in levels (2002, 2004) and changes in levels (2002–2004), OLS estimates
Notes: See Table1. The dependent variable in columns (1) and (2) is given by the ratio of externally sourced inputs to value added in 2002 and 2004, respectively, and in column (3) by the 2002–2004 change in the ratio. The right-hand side variables are measured as of 2002, 2004, and 2002, respectively
*,**, and***denote statistical significance at the 10%, 5%, and 1% levels, respectively. Robust standard errors are in parenthesis
Variable (1) (2) (3)
Sales per employee 0.0005 0.002** −0.00002
(0.0004) (0.001) (0,0001)
Export share 0.002 −0.007** −0.002
(0.005) (0.003) (0.006)
Increasing sales expected −0.301* −0.066 0.430
(0.163) (0.215) (0.263)
Investments in ICT −0.005 −0.266 0.038
(0.238) (0.211) (0.311)
Investments in production facilities 0.381* 0.275 −0.267
(0.214) (0.203) (0.308)
State-of-the-art technology 0.301* −0.141
(0.173) (0.258)
Number of employees 0.141* 0.231** −0.122
(0.089) (0.107) (0.127)
Wages per employee −0.089 −0.206* 0.020
(0.103) (0.106) (0.106)
Share of high-skilled workers 0.289 −0.205 −1.168**
(0.349) (0.404) (0.522)
Separations rate 0.030 0.243 −0.060
(0.536) (0.170) (0.764)
Share of fixed-term workers −0.950** −0.190 0.257
(0.390) (0.661) (0.573)
Works council −0.432 −0.115 0.488
(0.287) (0.305) (0.364)
Collective agreement −0.039 0.001 0.085
(0.248) (0.212) (0.304)
Western Germany −0.057 0.310* 0.170
(0.232) (0.173) (0.332)
Establishment founded before 1990 −0.006 −0.116 −0.094
(0.210) (0.168) (0.312)
Single-establishment firm (without subsidiaries) −0.461* −0.281 −0.111
(0.252) (0.232) (0.338)
Legal form (omitted category: sole trader)
Partnership 0.423 −0.703*** −0.687
(0.426) (0.243) (0.518)
limited liability corporation −0.219 0.082 0.063
(0.254) (0.270) (0.378)
Company limited by shares −1.261*** 0.848 2.939**
(0.438) (0.768) (1.143)
Public corporation −0.644 −0.638 −0.080
(0.411) (0.414) (0.450)
Other legal form 1.548 −0.694* −2.380
(1.432) (0.362) (2.176)
R2 0.07 0.08 0.02
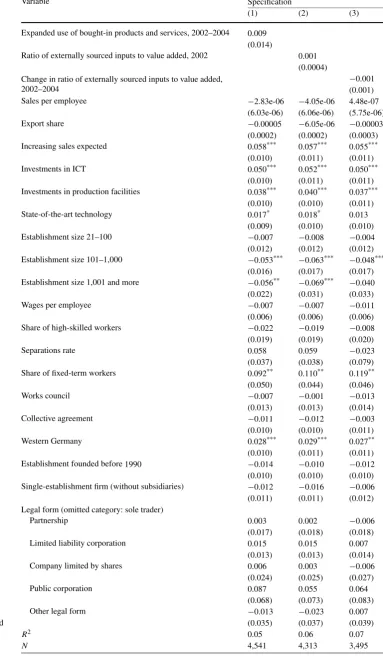
Table 3 The effect of
outsourcing on employment change, 2002–2004, OLS estimates
Notes: See Table1. The model includes 35 industry dummies *,**, and***denote statistical significance at the 10%, 5%, and 1% levels, respectively. Robust standard errors are in parentheses
Variable Specification
(1) (2) (3)
Expanded use of bought-in products and services, 2002–2004 0.009 (0.014)
Ratio of externally sourced inputs to value added, 2002 0.001 (0.0004) Change in ratio of externally sourced inputs to value added,
2002–2004
−0.001 (0.001)
Sales per employee −2.83e-06 −4.05e-06 4.48e-07
(6.03e-06) (6.06e-06) (5.75e-06)
Export share −0.00005 −6.05e-06 −0.00003
(0.0002) (0.0002) (0.0003)
Increasing sales expected 0.058*** 0.057*** 0.055***
(0.010) (0.011) (0.011)
Investments in ICT 0.050*** 0.052*** 0.050***
(0.010) (0.011) (0.011) Investments in production facilities 0.038*** 0.040*** 0.037***
(0.010) (0.010) (0.011)
State-of-the-art technology 0.017* 0.018* 0.013
(0.009) (0.010) (0.010)
Establishment size 21–100 −0.007 −0.008 −0.004
(0.012) (0.012) (0.012) Establishment size 101–1,000 −0.053*** −0.063*** −0.048***
(0.016) (0.017) (0.017) Establishment size 1,001 and more −0.056** −0.069*** −0.040 (0.022) (0.031) (0.033)
Wages per employee −0.007 −0.007 −0.011
(0.006) (0.006) (0.006)
Share of high-skilled workers −0.022 −0.019 −0.008
(0.019) (0.019) (0.020)
Separations rate 0.058 0.059 −0.023
(0.037) (0.038) (0.079)
Share of fixed-term workers 0.092** 0.110** 0.119**
(0.050) (0.044) (0.046)
Works council −0.007 −0.001 −0.013
(0.013) (0.013) (0.014)
Collective agreement −0.011 −0.012 −0.003
(0.010) (0.010) (0.011)
Western Germany 0.028*** 0.029*** 0.027**
(0.010) (0.011) (0.011) Establishment founded before 1990 −0.014 −0.010 −0.012 (0.010) (0.010) (0.010) Single-establishment firm (without subsidiaries) −0.012 −0.016 −0.006 (0.011) (0.011) (0.012) Legal form (omitted category: sole trader)
Partnership 0.003 0.002 −0.006
(0.017) (0.018) (0.018)
Limited liability corporation 0.015 0.015 0.007
(0.013) (0.013) (0.014)
Company limited by shares 0.006 0.003 −0.006
(0.024) (0.025) (0.027)
Public corporation 0.087 0.055 0.064
(0.068) (0.073) (0.083)
Other legal form −0.013 −0.023 0.007
(0.035) (0.037) (0.039)
R2 0.05 0.06 0.07
sourced inputs to value added in 2002, and column (3) for the change in this ratio between 2002 and 2004. As is ap-parent, the effects of outsourcing are always statistically in-significant.9 As far as the other arguments are concerned, employment change is negatively associated with establish-ment size, while it is positively associated with the dummies capturing investments in information and communications technology and investment in production facilities, expec-tations of increased sales, advanced technology, location in western Germany and, interestingly, with the share of fixed-term contract workers.
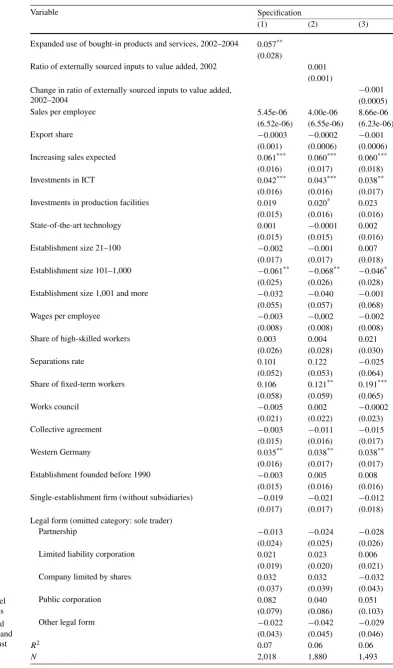
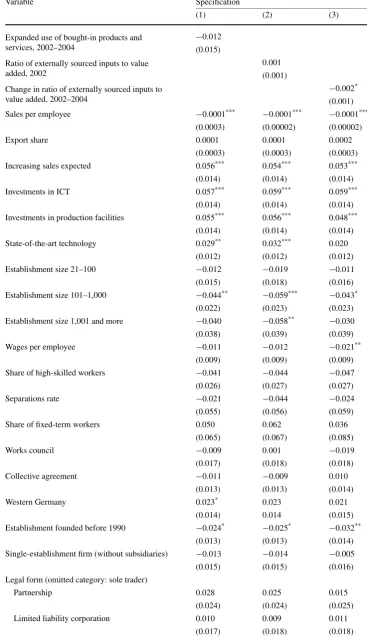
Tables4and5provide disaggregated results for services and manufacturing, respectively. For services, although the outsourcing coefficient estimates are unchanged (albeit sta-tistically insignificant) for the ratio measures, we obtain a
positive and statistically significant coefficient estimate for
the organizational change measure of outsourcing. This is the first estimate of which we are aware that points to rising employment in association with outsourcing in this sector. The influence of the other regressors is broadly as observed for industry as a whole.
The results for manufacturing are differentiated from those obtained for services. Specifically, we obtain sta-tistically significant negative coefficient estimates for the change in the ratio of externally sourced inputs to value added, but not for this ratio and for the organizational change measure. The rest of the results are also somewhat different from before. For example, the share of workers on fixed-term contracts is statistically significant, whereas the vari-able for the establishment founded before 1990 becomes negatively significant at the 10% level. There is also some suggestion that the very largest firms and not just larger firms have lower employment growth rates than their smaller counterparts.
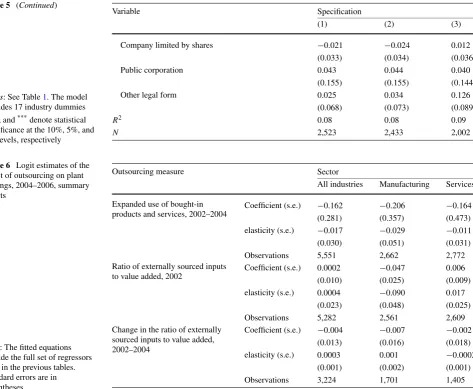
As a final exercise, we sought to determine whether our outsourcing measures had any effect on plant closings.10 Since the latest (publicly) available survey refers to 2006, this exercise amounts to examining the effects of outsourc-ing on plant failures over the interval 2004–2006. Usoutsourc-ing the IAB panel we can identify plant closings in the following manner. As of 2006, we have data on the ‘current’ state of each establishment that participated in 2004. Of course not all plants ‘missing’ from the survey in 2006 are deaths: some are establishments where the interviewer is unable to figure out what had happened to them, while other plants will sim-ply be those that have been self-rotated out of the sample.
9Our results are in line with a consensus that has emerged from em-pirical studies on offshoring surveyed by Geishecker et al. (2008) and Crinó (2009), as well as the recent investigation by Wagner (2009) who reports employment effects that are either broadly neutral or even mod-estly benign.
10See Wagner (1994) and Heckmann (2009) for an overview of the relevant German literature.
Additional information from the German Federal Employ-ment Agency establishEmploy-ment file was then used to check on whether a 2004 participant was still extant in 2006. The file contains information on each German establishment with at least one employee covered by social insurance, and is used to draw the sample for the Establishment Panel. The estab-lishment identifiers of plants with missing data on survival in the panel were compared with the establishment identi-fiers in the file. A missing establishment was adjudged to have failed if no match could be found in the file. Alterna-tively put, former missing observations for which a match was found were added back in as survivors. In this way, we were able to obtain virtually complete information on sur-vivals/deaths of all plants that were part of the Establishment Panel in 2004. After all such calculations, we arrive at a to-tal of 199 plant failures for all industries as of 2006 for the organizational change measure of outsourcing. Correspond-ing plant failures for the ratio of externally sourced inputs to value added are 185 and 120 for the levels and change measures, respectively.
The probability of failure was modeled using a logistic regression in which the RHS variables are identical to those used in the employment change equations. The dependent variable is assigned the value of 1 for those plants that failed between 2004 and 2006, 0 otherwise. All regressors have values set at the time of the 2004 wave.
The logit results are presented in summary form in Ta-ble6. Beginning with the organizational change measure of outsourcing, we see that all the point estimates are nega-tive, although none achieves statistical significance at con-ventional levels. The same results obtain for the change in the ratio of externally sourced inputs to value added between 2002 and 2004, that is, all coefficients are again negative and insignificant. For the level of externally sourced inputs in 2004, however, two out of three coefficient estimates are positive (for all sectors and for services). The results for manufacturing are opposite in sign but remain statistically insignificant. Although one might conclude from this evi-dence that outsourcing might weakly indicate a solution to problems of survivability rather than hinting at a source of competitive difficulty, we would instead incline to the view that there is nothing in the data to suggest that the employ-ment change results reported earlier in Table3are subject to survivor bias.
4 Conclusions
Table 4 The effect of
outsourcing on employment change in the services sector, 2002–2004, OLS estimates
Notes: See Table1. The model includes 18 industry dummies *,**, and***denote statistical significance at the 10%, 5%, and 1% levels, respectively. Robust standard errors are in parentheses
Variable Specification
(1) (2) (3)
Expanded use of bought-in products and services, 2002–2004 0.057** (0.028)
Ratio of externally sourced inputs to value added, 2002 0.001 (0.001) Change in ratio of externally sourced inputs to value added,
2002–2004
−0.001 (0.0005)
Sales per employee 5.45e-06 4.00e-06 8.66e-06
(6.52e-06) (6.55e-06) (6.23e-06)
Export share −0.0003 −0.0002 −0.001
(0.001) (0.0006) (0.0006)
Increasing sales expected 0.061*** 0.060*** 0.060***
(0.016) (0.017) (0.018)
Investments in ICT 0.042*** 0.043*** 0.038**
(0.016) (0.016) (0.017) Investments in production facilities 0.019 0.020* 0.023
(0.015) (0.016) (0.016)
State-of-the-art technology 0.001 −0.0001 0.002
(0.015) (0.015) (0.016)
Establishment size 21–100 −0.002 −0.001 0.007
(0.017) (0.017) (0.018) Establishment size 101–1,000 −0.061** −0.068** −0.046*
(0.025) (0.026) (0.028) Establishment size 1,001 and more −0.032 −0.040 −0.001 (0.055) (0.057) (0.068)
Wages per employee −0.003 −0,002 −0.002
(0.008) (0.008) (0.008)
Share of high-skilled workers 0.003 0.004 0.021
(0.026) (0.028) (0.030)
Separations rate 0.101 0.122 −0.025
(0.052) (0.053) (0.064)
Share of fixed-term workers 0.106 0.121** 0.191***
(0.058) (0.059) (0.065)
Works council −0.005 0.002 −0.0002
(0.021) (0.022) (0.023)
Collective agreement −0.003 −0.011 −0.015
(0.015) (0.016) (0.017)
Western Germany 0.035** 0.038** 0.038**
(0.016) (0.017) (0.017)
Establishment founded before 1990 −0.003 0.005 0.008
(0.015) (0.016) (0.016) Single-establishment firm (without subsidiaries) −0.019 −0.021 −0.012 (0.017) (0.017) (0.018) Legal form (omitted category: sole trader)
Partnership −0.013 −0.024 −0.028
(0.024) (0.025) (0.026)
Limited liability corporation 0.021 0.023 0.006
(0.019) (0.020) (0.021)
Company limited by shares 0.032 0.032 −0.032
(0.037) (0.039) (0.043)
Public corporation 0.082 0.040 0.051
(0.079) (0.086) (0.103)
Other legal form −0.022 −0.042 −0.029
(0.043) (0.045) (0.046)
R2 0.07 0.06 0.06
Table 5 The effect of
outsourcing on employment change in the manufacturing sector, 2002–2004, OLS estimates
Variable Specification
(1) (2) (3)
Expanded use of bought-in products and services, 2002–2004
−0.012 (0.015)
Ratio of externally sourced inputs to value added, 2002
0.001 (0.001)
Change in ratio of externally sourced inputs to value added, 2002–2004
−0.002* (0.001)
Sales per employee −0.0001*** −0.0001*** −0.0001***
(0.0003) (0.00002) (0.00002)
Export share 0.0001 0.0001 0.0002
(0.0003) (0.0003) (0.0003)
Increasing sales expected 0.056*** 0.054*** 0.053***
(0.014) (0.014) (0.014)
Investments in ICT 0.057*** 0.059*** 0.059***
(0.014) (0.014) (0.014)
Investments in production facilities 0.055*** 0.056*** 0.048***
(0.014) (0.014) (0.014)
State-of-the-art technology 0.029** 0.032*** 0.020
(0.012) (0.012) (0.012)
Establishment size 21–100 −0.012 −0.019 −0.011
(0.015) (0.018) (0.016)
Establishment size 101–1,000 −0.044** −0.059*** −0.043*
(0.022) (0.023) (0.023)
Establishment size 1,001 and more −0.040 −0.058** −0.030
(0.038) (0.039) (0.039)
Wages per employee −0.011 −0.012 −0.021**
(0.009) (0.009) (0.009)
Share of high-skilled workers −0.041 −0.044 −0.047
(0.026) (0.027) (0.027)
Separations rate −0.021 −0.044 −0.024
(0.055) (0.056) (0.059)
Share of fixed-term workers 0.050 0.062 0.036
(0.065) (0.067) (0.085)
Works council −0.009 0.001 −0.019
(0.017) (0.018) (0.018)
Collective agreement −0.011 −0.009 0.010
(0.013) (0.013) (0.014)
Western Germany 0.023* 0.023 0.021
(0.014) 0.014 (0.015)
Establishment founded before 1990 −0.024* −0.025* −0.032**
(0.013) (0.013) (0.014)
Single-establishment firm (without subsidiaries) −0.013 −0.014 −0.005
(0.015) (0.015) (0.016)
Legal form (omitted category: sole trader)
Partnership 0.028 0.025 0.015
(0.024) (0.024) (0.025)
Limited liability corporation 0.010 0.009 0.011
Table 5 (Continued)
Notes: See Table1. The model includes 17 industry dummies *,**, and***denote statistical significance at the 10%, 5%, and 1% levels, respectively
Variable Specification
(1) (2) (3)
Company limited by shares −0.021 −0.024 0.012
(0.033) (0.034) (0.036)
Public corporation 0.043 0.044 0.040
(0.155) (0.155) (0.144)
Other legal form 0.025 0.034 0.126
(0.068) (0.073) (0.089)
R2 0.08 0.08 0.09
N 2,523 2,433 2,002
Table 6 Logit estimates of the
effect of outsourcing on plant closings, 2004–2006, summary results
Note: The fitted equations include the full set of regressors used in the previous tables. Standard errors are in parentheses
Outsourcing measure Sector
All industries Manufacturing Services
Expanded use of bought-in products and services, 2002–2004
Coefficient (s.e.) −0.162 −0.206 −0.164
(0.281) (0.357) (0.473)
elasticity (s.e.) −0.017 −0.029 −0.011
(0.030) (0.051) (0.031)
Observations 5,551 2,662 2,772
Ratio of externally sourced inputs to value added, 2002
Coefficient (s.e.) 0.0002 −0.047 0.006
(0.010) (0.025) (0.009)
elasticity (s.e.) 0.0004 −0.090 0.017
(0.023) (0.048) (0.025)
Observations 5,282 2,561 2,609
Change in the ratio of externally sourced inputs to value added, 2002–2004
Coefficient (s.e.) −0.004 −0.007 −0.002
(0.013) (0.016) (0.018)
elasticity (s.e.) 0.0003 0.001 −0.0002
(0.001) (0.002) (0.001)
Observations 3,224 1,701 1,405
other, and in each case consistent with the aggregate find-ings these different results derive from different outsourcing measures. These respective (positive and negative) results for the two sectors offer sustenance to the more enthusiastic opponents and supporters of outsourcing alike. But if so, it remains rather thin gruel. Third, it appears that we can reject the notion that the employment consequences are benign by reason of survival bias. That is to say, there are no signs that outsourcing aggravates plant closings.
Further research is required. One limitation of our study is that we were unable formally to account for the possible endogeneity of certain right-hand variables, perhaps most notably investments in ICT. This deficit needs to be tackled with new data sets. Another issue is the impact of outsourc-ing on productivity and not just employment, trackoutsourc-ing sim-ilar such studies for Ireland, Italy, Austria, the U.K. and the U.S.A.11The IAB Establishment Panel is integral to this end
11Daveri and Jona-Lasinio (2008); Geishecker and Görg (2008a, 2008b); Geishecker et al. (2008,2010); Görg (2005); Girma and Görg
because it permits the construction of the relevant time se-ries. Information on insourcing has also been observed since 2008. Use of these new data would allow us to determine po-tential structural breaks in outsourcing or complementarity between the two forms. Finally, the research effort should also be widen to accommodate differences between domes-tic outsourcing on the one hand and international outsourc-ing/offshoring on the other.
Executive summary
Despite the practice in many western European nations of international outsourcing or offshoring parts of their pro-duction processes to low-wage countries being very much in vogue, research on the correlates and consequences of outsourcing using establishment data is still sparse. In this
study, German data from the Institute for Employment Re-search Establishment Panel are used to examine the determi-nants and consequences of outsourcing. Summarizing our findings with respect to the determinants of outsourcing, there are few overt signs that the phenomena is associated with reduced sales per employee, technological sluggish-ness, or low wages in offshoring firms. Further, although outsourcing might be viewed as an alternative form of work-force flexibility, our results are not in line with this hypoth-esis either.
Our findings with respect to the employment conse-quences are mixed and may be summarized as follows. First, across all industries, there is no convincing evidence that outsourcing costs jobs. Second, some negative effects are re-ported for manufacturing industry, balanced by positive ef-fects for the service sector. If the results for these two sectors are to be taken as offering sustenance to the more enthusias-tic opponents and supporters of outsourcing, it is evidently rather thin gruel. Third, it appears that we can reject the no-tion that the employment consequences are benign simply by reason of survival bias; that is, there are no signs that outsourcing aggravates plant closings.
Further research is nonetheless required. One limitation of our study is that we are unable formally to account for the possible endogeneity of certain right-hand variables, per-haps most notably investments in ICT. This deficit needs to be tackled with new data sets. Another issue is the impact of outsourcing on productivity and not just employment, taking a cue from extant studies for Ireland, Italy, Austria, the U.K. and the U.S.A. Here the IAB Establishment Panel is inte-gral to this end because it now permits the construction of the relevant time series. Information on insourcing has also been observed since 2008. Use of these new data would al-low us to determine potential structural breaks in outsourc-ing or complementary between the two forms. Finally, the research effort should also be widened to accommodate dif-ferences between domestic outsourcing on the one hand and international outsourcing/offshoring on the other.
Kurzfassung
Obwohl in vielen westeuropäischen Ländern internationales
outsourcing oder offshoring in Niedriglohnländer Teil des
Produktionsprozesses ist, sind Forschungserkenntnisse über
die Korrelationen und Konsequenzen von outsourcing ba-sierend auf Betriebsdaten rar. Im vorliegenden Artikel wur-den deutsche Daten des IAB-Betriebspanels genutzt, um die Determinanten und Konsequenzen von outsourcing zu un-tersuchen. Zusammenfassend zeigen die Ergebnisse bezüg-lich der Determinanten von outsourcing dass nur wenig dar-auf hinweist, dass outsourcing mit Lohnsenkung, techni-scher Stagnation oder Niedriglöhnen in den Unternehmen, die Niederlassungen im Ausland aufbauen, verbunden ist. Außerdem wiedersprechen unsere Ergebnisse den Hypothe-sen, dass outsourcing als eine alternative Form der Arbeits-flexibilität betrachtet werden kann.
Unter Beachtung der Konsequenzen für die Arbeitneh-mer zeigen unsere Ergebnisse folgendes: Erstens kann über alle Branchen hinweg nicht festgestellt werden, dass durch
outsourcing Arbeitsplätze verloren gehen. Zweitens
wer-den leicht negative Einflüsse im Verarbeitenwer-den Gewerbe durch positive Effekte im Dienstleistungssektor ausgegli-chen. Wenn jedoch die Ergebnisse in diesen beiden Sek-toren als Grundlage für enthusiastische Gegner und Befür-worter von outsourcing genutzt werden, bewegen sich diese auf dünnem Eis. Drittens scheint es, dass unsere Ergebnis-se die Auffassung zurückweiErgebnis-sen, dass die BeschäftigungErgebnis-sef- Beschäftigungsef-fekte nur auf einem survival bias beruhen. So deuten die Er-gebnisse nicht darauf hin, dass outsourcing die Schließung von Betrieben und Fabriken verstärkt.
Appendix
Table 7 Description of the variables
Variable Definition
Expanding outsourcing in the last two years 1/0 dummy: 1 if the establishment said to have been expanding “in buying products and services from outside sources in the last two years.”
Ratio of externally sourced inputs to value added Ratio of externally sourced inputs to value added.
Change in the ratio of externally sourced inputs to value added
Change in the ratio of externally sourced inputs to value added.
Sales per employee Volume of sales per employee (In Euros.)
Export share Share of exports in volume of sales.
Increasing sales expected 1/0 dummy: 1 if sales are expected to increase; 0 if “sales stay approximately at the same.”
Total of all investments Approximate sum of all investments (in the establishment or in the firm?) (In Euros.)
Investments in ICT 1/0 dummy: 1 if establishment invested in EDP/ICT; 0 if no investments or investments in other areas.
Investments in production facilities 1/0 dummy: 1 if establishment invested in production facilities, furniture and office equipment; 0 if no investments or investments in other areas.
Wages per employee Gross wages per employee (June) (In Euros.)
State-of-art technology 1/0 dummy: 1 if the overall technical state of the plant and machinery, furniture and office equipment of the establishment in comparison to other establishments in the same industry is assessed as belonging to the two highest categories on a scale from one to five (viz. “obsolete” to “state-of-the-art”); 0 otherwise.
Works council 1/0 dummy: 1 if works council is present; 0 otherwise.
Collective agreement 1/0 dummy: 1 if there is either a company or industry-wide wage agreement; 0 otherwise.
Western Germany 1/0 dummy: 1 if plant located in western Germany; 0 otherwise.
Number of employees Number of employees in the current year (In logs.)
Share of separations Number of separations as a percentage of total employment.
Share of high-skilled employees Share of high skilled in total employment.
Share of fixed-term employees Share of fixed-term contract workers in total employment.
New establishment 1/0 dummy: 1 if establishment/firm created before 1990; 0 otherwise.
Single establishment firm (without subsidiaries) 1/0 dummy: 1 if single establishment firm; 0 otherwise.
Partnership 1/0 dummy: 1 if partnership (limited partnership, general partnership, partnership under legal code); 0 otherwise.
Limited liability corporation 1/0 dummy: 1 if limited liability company or limited commercial partnership with a limited company as partner; 0 otherwise.
Company limited by shares 1/0 dummy: 1 if company limited by shares (public limited company, partnership limited by shares; 0 otherwise).
Public corporation 1/0 dummy: 1 if public corporation, public law foundation, institution, authority or office; 0 otherwise.
Table 8 Descriptive statistics
Variable N Mean St. Dev.
Expanding outsourcing in the last two years 15333 0.110 0.313 Ratio of externally sourced inputs to value added 10624 2.421 6.578 Change in the ratio of externally sourced inputs to value added 7768 −0.082 6.841
Sales per employee (kEUR) 12979 166.292 572.729
Export share 14501 9.375 20.362
Increasing sales expected 17347 0.225 0.418
Investments in ICT 14732 0.524 0.499
Investments in production facilities 14732 0.500 0.500
Wages per employee (kEUR) 13384 1.963 1.004
State-of-the-art technology 9272 0.686 0.464
Works council 18708 0.337 0.473
Collective agreement 18717 0.535 0.499
Western Germany 18753 0.673 0.469
Number of employees (log.) 18753 3.723 1.480
Share of separations 18714 0.066 0.274
Share of high-skilled employees 18751 0.659 0.268
Share of fixed-term employees 18699 0.043 0.115
New establishment 18578 0.597 0.491
Single establishment firm (without subsidiaries) 18512 0.724 0.447
Partnership 18510 0.075 0.263
Limited liability corporation 18510 0.635 0.481
Company limited by shares 18510 0.055 0.227
Public corporation 18510 0.006 0.078
Other legal form 18510 0.021 0.143
References
Abramovsky, L., Griffith, R.: Outsourcing and offshoring of business services: how important is ICT? J. Eur. Econ. Assoc. 4(2–3), 594– 601 (2006)
Addison, J.T., Bellmann, L., Schank, T., Teixeira, P.: The demand for labor. An analysis using matched employer-employee data from the German LIAB. Will the high unskilled worker own-wage elas-ticity please stand up? J. Labor Res. 29, 114–137 (2008) Amiti, M., Wei, S.-J.: Fear of outsourcing: is it justified? Econ. Policy
20(42), 308–347 (2005)
Becker, S.O., Muendler, M.-A.: The effect of FDI on job separation. B.E. J. Econ. Anal. Policy 8, Article 8 (2008)
Becker, S.O., Jäckle, R., Muendler, M.-A.: Kehren deutsche Fir-men ihrer Heimat den Rücken? Ausländische Direktinvestitionen deutscher Unternehmen. Ifo-Schnelld. 58, 23–333 (2005a) Becker, S.O., Ekholm, K., Jäckle, R., Muendler, M.A.: Location choice
and employment decisions: a comparison of German and Swedish multinationals. Rev. World Econ. 141(4), 693–731 (2005b) Bellmann, L., Pahnke, A.: Auswirkungen des organisatorischen
Wan-dels auf die betriebliche Arbeitsnachfrage. Z. Arbeitsmarkt-Forsch. 39(2), 29–40 (2006)
Broedner, P., Kinkel, S., Lay, G.: Productivity effects of outsourcing— new evidence on the strategic importance of vertical integration decisions. Int. J. Oper. Prod. Manag. 29(2), 127–150 (2009) Crinó, R.: Offshoring, multinationals and labour market: a review of
the empirical literature. J. Econ. Surv. 23(2), 197–249 (2009) Daveri, F., Jona-Lasinio, C.: Offshoring and productivity growth in the
Italian manufacturing industries. CESifo Econ. Stud. 54, 414–450 (2008)
Feenstra, R.C., Hanson, G.H.: The impact of outsourcing and high-technology capital on wages: estimates for the United States, 1979–1990. Q. J. Econ. 114(3), 907–941 (1999)
Geishecker, I., Görg, H.: Winners and losers: a micro-level analysis of international outsourcing and wages. Can. J. Econ. 41(1), 243– 270 (2008a)
Geishecker, I., Görg, H.: Services offshoring and wages: evidence from micro data. Working paper 1434, Kiel Institute for the World Economy (2008b)
Geishecker, I., Görg, H., Maioli, S.: The labour market impact of in-ternational outsourcing. In: Greenaway, D., Wright, P., Upward, R. (eds.) Globalisation and Labour Market Adjustment, pp. 152– 173. Palgrave, Basingstoke (2008)
Geishecker, I., Görg, H., Munch, J.R.: Do labour market institutions matter? Micro-level wage effects of international outsourcing in three European countries. Rev. World Econ. 146(1), 179–198 (2010)
Girma, S., Görg, H.: Outsourcing, foreign ownership, and productivity: evidence from UK establishment-level data. Rev. Int. Econ. 12(5), 817–832 (2004)
Görg, H.: International outsourcing and productivity: evidence from the Irish electronics industry. N. Am. J. Econ. Finance 16(2), 255– 269 (2005)
Görg, H., Greenaway, D., Kneller, R.: The economic impact of off-shoring. GEP research report, Leverhulme Centre for Research on Globalisation and Economic Policy, University of Nottingham (2008a)
Görg, H., Hanley, A.: Outsourcing helps improve your firm’s performance—or does it? J. Financ. Transform. 8, 113–118 (2003)
Görg, H., Hanley, A.: Does outsourcing increase profitability? Econ. Soc. Rev. 35(3), 267–288 (2004)
Görg, H., Hanley, A.: Labour demand effects of international outsourc-ing: evidence from plant-level data. Int. Rev. Econ. Finance 14(3), 365–376 (2005)
Görg, H., Hanley, A.: International services outsourcing and innova-tion: an empirical investigation. GEP Working Paper 2007/43, University of Nottingham (2007)
Görzig, B., Kaminiarz, A., Stephan, A.: Wie wirkt sich Outsourcing auf den Unternehmenserfolg aus? Neue Evidenz. Schmollers Jahrb. Wirtsch.- Soz.wiss. 125(4), 489–507 (2005)
Heckmann, M.: Erfolgschancen neu gegründeter Betriebe. IAB-Bibliothek 313, Nürnberg (2009)
Hijzen, A., Görg, H., Hine, R.C.: International outsourcing and the skill structure of labour demand in the United Kingdom. Econ. J. (Lond.) 115(506), 861–879 (2005)
Ohnemus, J.: Productivity effects of business process outsourcing: a firm-level investigation based on panel data. ZEW Discus-sion Paper 09-088, Centre for European Economic Research Mannheim (2009)
Pfaffenrmayr, M.: Ownership advantages, foreign production and pro-ductivity: evidence from Austrian manufacturing firms. Rev. Ind. Organ. 15(4), 379–396 (1999)
Wagner, J.: The post-entry performance of new small firms in German manufacturing industries. J. Ind. Econ. 42(2), 141–154 (1994) Wagner, J.: Offshoring and firm performance: self-selection, effects on
performance, or both? IZA Discussion Paper No. 4605, Institute for the Study of Labor Bonn (2009)
John T. Addison is Professor of Economics at the University of South
Carolina. He is a research fellow at New York University School of Law, and the IAB inter al. His current research covers unemployment duration, minimum wages, and worker representation and economic performance. He has published in the major economics and specialty labor journals, including American Economic Review, Review of
Eco-nomics and Statistics, Journal of Human Resources, and Journal of La-bor Economics. He is the author of several laLa-bor economics texts, most recently The Economics of Codetermination: Some Lessons from the German Experience (New York: Palgrave Macmillan, 2009). E-mail: [email protected]
Lutz Bellmann is head of both the IAB Establishment Panel Project
and the IAB Department for Establishment and Employment. Since 2009 he has also been professor of Labour Economics at the Friedrich-Alexander-University Erlangen-Nuremberg. Prof. Bellmann has pub-lished in international journals such as Industrial Relations, Journal of Applied Social Science and British Journal of Industrial Relations. His current research interests include employer-employee data, economet-ric studies in labor economics, especially employment, apprenticeship training, further training, industrial relations and labor market effects of foreign firms. E-mail:[email protected]
André Pahnke studied economic science at the School of Economics
and Management of the Leibniz University of Hanover; graduation in 2004. From 2004 to 2010 he was research assistant at the Institute for Employment Research, Nuremberg. Research interests include linked employer-employee data, wages, labor demand, human capital theory, outsourcing, technological and organizational changes as well as in-dustrial relations. E-mail:[email protected]
Paulino Teixeira is Professor of Economics at the University of