O R I G I N A L B A S I C R E S E A R C H
Open Access
Correction of microplate location effects
improves performance of the thrombin
generation test
Yideng Liang, Samuel A Woodle, Alexey M Shibeko, Timothy K Lee and Mikhail V Ovanesov
*Abstract
Background:Microplate-based thrombin generation test (TGT) is widely used as clinical measure of global hemostatic potential and it becomes a useful tool for control of drug potency and quality by drug manufactures. However, the convenience of the microtiter plate technology can be deceiving: microplate assays are prone to location-based variability in different parts of the microtiter plate.
Methods:In this report, we evaluated the well-to-well consistency of the TGT variant specifically applied to the quantitative detection of the thrombogenic substances in the immune globulin product. We also studied the utility of previously described microplate layout designs in the TGT experiment.
Results:Location of the sample on the microplate (location effect) contributes to the variability of TGT
measurements. Use of manual pipetting techniques and applications of the TGT to the evaluation of procoagulant enzymatic substances are especially sensitive. The effects were not sensitive to temperature or choice of microplate reader. Smallest location effects were observed with automated dispenser-based calibrated thrombogram
instrument. Even for an automated instrument, the use of calibration curve resulted in up to 30% bias in thrombogenic potency assignment.
Conclusions:Use of symmetrical version of the strip-plot layout was demonstrated to help to minimize location artifacts even under the worst-case conditions. Strip-plot layouts are required for quantitative thrombin-generation based bioassays used in the biotechnological field.
Keywords:Thrombin generation test, Location effects, Immunoglobulin, Thrombogenicity
Background
Thrombin generation test (TGT) measures kinetics of thrombin activity during coagulation of a blood plasma sample mixed with activators of blood coagulation [1]. The TGT is widely used in clinical research to measure global hemostatic potential in blood coagulation disor-ders either for diagnostic purposes [2,3] or as means of treatment monitoring [4,5]. More recently, TGT became a useful tool in drug development and control of drug potency and quality in drug manufacture [6-9]. Although proposed in the 1950s [10], the test gained popularity
only a decade ago after the technique was revolutionized with the introduction of fluorogenic thrombin substrates and microtiter plate reader format [2]. However, the convenience of the microtiter plate technology can be deceiving: microtiter plate assays are prone to a special kind of variability caused by the uneven microenviron-ments in different wells of the plate [11].
In order to describe the location-based effects for the TGT assay, a recent biotechnology application of TGT was used. We and others found that the procoagulant ac-tivity of IVIG correlates with reported myocardial infarc-tion, stroke and other thromboembolic events [12,13]. Commercial (CAT® by Stago and Technothrombin® by Technoclone) as well as in house variants of the fluorogenic TGT method were especially helpful in identi-fication of procoagulant IVIG lots by manufacturers and * Correspondence:[email protected]
Office of Blood Research and Review, Center for Biologics Evaluation and Research, U.S. Food and Drug Administration, 29 Lincoln Drive, N29/306, Bethesda, MD 20892, USA
regulatory agencies[14,15]. In this report, we describe how both in house and commercial methods are prone to location-based biases which can be addressed with the use of symmetrical strip-plot layout design.
Materials and methods Materials
Human normal pooled plasma (FACT) was from George King Biomedicals. Immunodepleted Factor XI deficient plasma was from Affinity Biologicals (Ontario, Canada). Human plasma-derived Factor XIa was from Haemato-logic Technologies Inc (Essex Junction, VT). Recombin-ant lipidated tissue factor (rTF, Dade Innovin) was from Dade Behring (Marburg, Germany). TF activity was deter-mined using the Actichrome TF chromogenic kit (American Diagnostica). Fluorogenic substrate for thrombin Z-Gly-Gly-Arg-AMC was from Bachem (Torrance, CA). Phospholipid vesicles were from Technoclone (Diapharma, West Chester, OH). The Thrombin Calibrator and TF reagent PPP-low used in the CAT instrument experiment were from Thrombinoscope BV, Maastricht, The Netherlands.
In house thrombin generation test for IVIG procoagulant activity
Thrombin generation was measured as described in [8,16,17]. Thrombin generation profiles in FXI-deficient or normal plasma (75% by reaction volume) supplemented with fluorogenic substrate Z-Gly-Gly-Arg-AMC (800μM) and phospholipids vesicles (4μM) were mixed with seri-ally diluted thrombogenic lot of IVIG or FXIa. To reduce procedural errors, all reagents and plates were kept on plate heater (37°C); plasma was mixed with substrate and lipids prior transfer to microtiter wells; IVIG and FXIa samples (20% by reaction volume) were transferred to plasma using a 12- or 8-channel pipette, and reaction was started by rapidly adding 2.54 μL (2.5% by reaction vol-ume) of a mixture containing tissue factor (0.3 pM) and CaCl2(20 mM) using another 12-channel pipette. Record-ing was conducted in two microplate readers, Infinite F500 (Tecan, Durham, NC) and Synergy H4 (Biotek, Winooski, VT) at 37°C.
TG curve processing software
In house assay data processing was performed using an automated software package designed by Dr. Mikhail Ovanesov using OriginPro (OriginLab, Northampton, MA; the package is available from us upon request). The software is capable of applying different processing algo-rithms during the conversion of raw fluorescence to the processed TG curve, and computes the final TG curve parameters. The software can also apply the thrombin calibration and thrombin-α2macroglobulin (α2MG) cor-rection algorithms [2]. For quantitative assessment of IVIG procoagulant activity (a bioassay approach [15]), a
calibration curve was prepared from a serially diluted IVIG standard or FXIa. Thrombin peak height (TPH) values were plotted against FXIa concentration and fit-ted with a cubic polynomial equation. To calculate FXIa activity in the well, the calibration curve was applied to the TPH and multiplied by the pre-dilution of the sam-ple in the well.
Commercial thrombin generation test (CAT)
IVIG samples were mixed with plasma as described in the in house method, but after that the experiment was performed and processed according to the manufacturer’s guidelines using CAT microplate reader and software pack-age (Diagnostica Stago, Inc., Parsippany, NJ).
Results
Row-dependent location artifacts of TGT
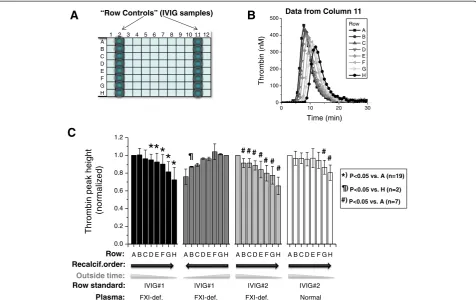
In 2010 we found that lots of IVIG products implicated in thrombotic adverse events can be evaluated with the TGT [14,15]. Mixing normal or FXI-deficient plasma with a thrombotic lot resulted in increased peak throm-bin heights and shortened times to peaks [14,18]. FXI-deficient plasma provided better resolution of low and high procoagulant lots because almost no thrombin generation was observed in this plasma without added IVIG samples. To characterize the procoagulant activ-ity of multiple IVIG products, we used thrombotic IVIG samples as internal assay controls. To simplify and standardize testing of hundreds of IVIG lots, con-trols were repeated on each row in the same position (i.e., as “row controls”), as shown in Figure 1A. This arrangement of samples is consistent with the high-throughput implementation of the manual TGT that utilizes 12-channel pipette for quick recalcification of samples in one row [8]. Consistently with the use of the row-to-row recalcification strategy, we found some random row-to-row variability in TPHs between and within microplates (data not shown). These differences could be traced back to inaccurate dispensing of TF and calcium chloride reagent.
However, we found that TG in duplicate wells containing the same IVIG sample can differ in a non-random systematical manner by up to 50% if the wells are located on separate rows of the plate. This can be illustrated by progressively reduced and delayed TG of “row control” samples on rows A through H (Figure 1B). Since lag time and time to thrombin peak were affected greater than the TPH by this systematic error, we chose TPH as the pri-mary measure of IVIG procoagulant activity.
gray bars). Normal plasma (white bars) was less sensitive to this trend which correlates well with lower sensitivity of normal plasma to procoagulant activity under the condi-tions of this experiment (data not shown). Interestingly, when the order of row recalcification was reversed from A➔H to H➔A, the trend was also reversed (Figure 1C, compare black and dark gray bars).
Effect of temperature
Previous investigations demonstrated that reduced temperature of plasma sample prior to placement of the microplate into the reader may lead to increased thrombin generation [19]. However, the role of temperature in the observed row-to-row artifacts was ruled out in our experiments. We kept our plasma and microplates on heat plates (three different brands of heaters used) and used pre-warmed pipet tips and microplate readers. The temperature of plasma wells on the heater before, after recalcification and after readings in the microplate
reader was the same as assessed by an infra-red thermom-eter (0.1°C resolution).
Row effect on IVIG samples with different procoagulant activities
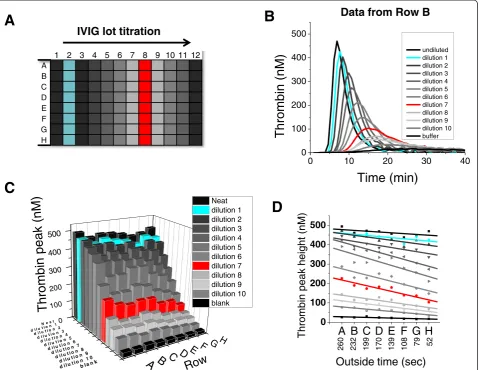
Normalization of the sample responses on the response of internal standard control can be used to address ran-dom and systematic errors in biological assays. However, normalization of TG peak heights in various tested IVIG samples on the respective “row control” presented in Figure 1 failed to correct for row-to-row artifacts (data not shown). Further analysis revealed that normalization is ineffective because samples with high and low procoagu-lant activities are affected differently by row artifact. To model samples of different procoagulant activity, procoagu-lant IVIG lot was serially diluted and tested repeatedly on rows A through H (Figure 2A). On each row, the TG curves demonstrated clear dose-response (Figure 2B). Consistent with previous observations, there was significant row-to-row 1 2 3 4 5 6 7 8 9 10 11 12
A B C D E F G H
“Row Controls” (IVIG samples)
A
C
0 10 20 30 0
100 200 300 400 500
Thrombin (nM)
Time (min)
Row A B C D E F G H
B
Data from Column 11A B C D E F G H A B C D E F G H A B C D E F G H A B C D E F G H
0.0 0.2 0.4 0.6 0.8 1.0 1.2
Row: Recalcif.order:
Outside time:
Plasma: FXI-def. FXI-def. FXI-def. Normal
Row standard: IVIG#1 IVIG#1 IVIG#2 IVIG#2
*
*
*
*
*
# # #
# ##
Thrombin peak
height
(normal
ized)
P<0.05 vs. A (n=19)
*)
P<0.05 vs. H (n=2)
¶)
P<0.05 vs. A (n=7)
#) #
# #
random error (e.g., row C lower than row D on Figure 2C) and a systematic trend across different rows (reduction of TPH from row A to row H). More importantly, highly concentrated IVIG sample was less affected by the system-atic row drift than highly diluted samples, as evidenced by different slopes of respective TPHs (compare blue and red lines on Figure 2D). Therefore, a procoagulant activity calibration curve rather than normalization on a single concentration of row control should be used for correction of row artifacts.
Row effects for FXIa on different microplate reader instruments
Microplate reader models differ in the patterns of microplate movement, vibration rate and flow of heated air inside the instrument, possibly changing the kinetics
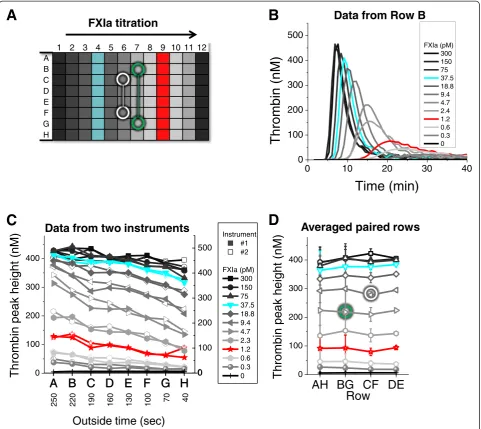
of coagulation in microwells, e.g.,“edge”artifacts of vari-able intensity. However, we found that two different microplate readers produced similar row-to-row artifacts when the same set of samples was tested in parallel (Figure 3C). Note that these experiments utilized titra-tion of FXIa, a coagulatitra-tion protein previously identi-fied as the primary thrombogenic substance in IVIG products [14,15,18]. Procoagulant IVIG lot and puri-fied FXIa produced similar dose responses in the TGT (compare Figures 2B and 3B) and similar row-to-row drifts (Figures 2D and 3C).
Correction of row-to-row artifacts with symmetrical duplicate well averaging
Systematic analysis of analytical and preanalytical vari-ables revealed that the time period from recalcification
0 100
200 300 400 500
N ea t
d i lu t i
o n 1
d i l ut i o
n 2
d i lu t io n
3 d i lu t io n
4 d i lu t io n 5 d i lu t io n 6 d i lu t i
o n 7 d i lu t i
o n 8
d i lu t io n 9 d i lu t i
o n 1 0
b l an k
A
B C
D E F G
H Neat dilution 1 dilution 2 dilution 3 dilution 4 dilution 5 dilution 6 dilution 7 dilution 8 dilution 9 dilution 10 blank
Thrombin peak (nM)
Row
0 10 20 30 40
0 100 200 300 400 500
Thrombin (nM)
Time (min)
undiluted dilution 1 dilution 2 dilution 3 dilution 4 dilution 5 dilution 6 dilution 7 dilution 8 dilution 9 dilution 10 buffer
C
A B C D E F G H
0 100 200 300 400 500
Thrombin peak height (nM)
D
260 232 199 170 139 108 79 52
Outside time (sec)
1 2 3 4 5 6 7 8 9 10 11 12A B C D E F G H
IVIG lot titration
A
B
Data from Row B
of the well to placement of the microtiter plate into the plate reader (outside time) correlates with the TPH (e.g., see Figures 1C, 2D and 3C). Therefore, averaging identical samples on opposite rows, e.g., rows C + F and rows B + G (see white and green connected circles on Figure 3A diagram), compensated for the row drift at all FXIa concentrations (Figure 3D). In practice, quantitative assessment of procoagulant samples against the activity control would require serial dilutions of sam-ples and controls to be arranged vertically and symmetric-ally with respect to the center of the microplate, as shown on Figure 4A diagram. To confirm utility of this approach,
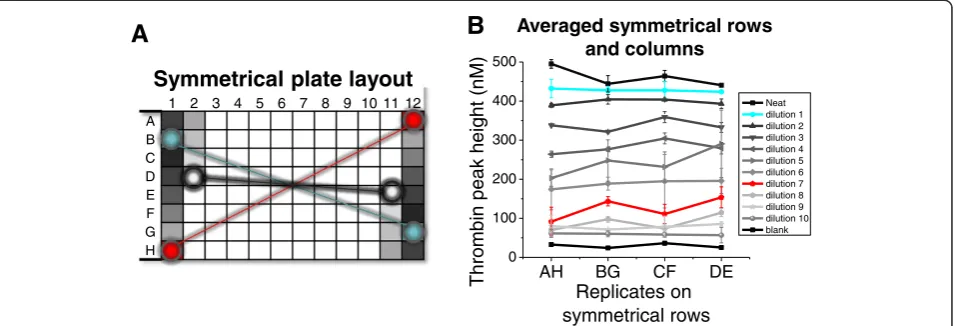
the IVIG sample dilutions from the experiment shown on Figure 2 were retested using the symmetrical vertical strip plot design (Figure 4A), resulting in correction of row arti-facts (Figure 4B).
Row effects in a commercial TGT
Since row drifts were proportional to recalcification times, fast recalcification may improve row artifacts. Consistent with this prediction, we found less pronounced location-dependent effects in a commercially available CAT® variant of the TGT assay which is equipped with the auto-mated calcium chloride dispenser. Separate experiments
A B C D E F G H
0 100 200 300 400 500
A B C D E F G H
0 100 200 300 400
)
M
n(
t
h
gi
e
h
k
a
e
p
ni
b
m
or
h
T
Instrument #1 #2
FXIa (pM) 300 150 75 37.5 18.8 9.4 4.7 2.3 1.2 0.6 0.3 0
0 10 20 30 40 0
100 200 300 400 500
Thrombin (nM)
Time (min)
A
C
B
1 2 3 4 5 6 7 8 9 10 11 12 A
B C D E F G H
FXIa titration
Data from Row B
AH BG CF DE
0 100 200 300 400
)
M
n(
t
h
gi
e
h
k
a
e
p
ni
b
m
or
h
T
Row
Averaged paired rows
Data from two instruments
D
0
250 220 190 160 130 100 70 40
Outside time (sec)
FXIa (pM) 300 150 75 37.5 18.8 9.4 4.7 2.4 1.2 0.6 0.3 0
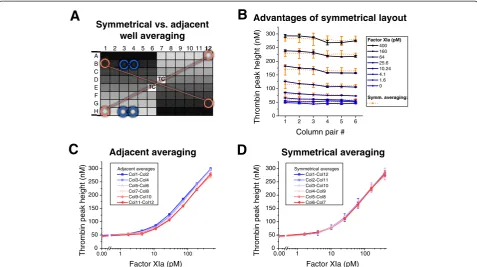
confirmed that other differences between in house and CAT assays (e.g., order of substrate addition, volume of plasma, TF concentration) could not explain the different degree of row effects (data not shown). To understand the difference between adjacent and symmetrical averaging of duplicate wells, we placed identical FXIa titrations along every column and the direction of the titration along the column was symmetrical with respect to the center of the plate (refer to Figure 5A). This order is roughly con-sistent with the left-to-right direction of column-wise recalcification order by the automated CAT instru-ment. Blue lines on Figure 5B demonstrate column drifts when adjacent duplicate wells containing same FXIa concentrations are averaged (examples of adja-cent wells are marked with blue circles on Figure 5A). The drifts were eliminated when symmetrically ar-ranged wells were averaged (Figure 5A, orange circles, and Figure 5B, orange lines). Furthermore, symmetrical averaging of wells produced overlapping dose-response curves for FXIa-dependent TPH (Figure 5D), while adja-cent averaging produced shifted dose-response curves (Figure 5C).
Importance of row effect correction for quantitative bioassay
To estimate the potential bias in a FXIa bioassay [15] produced by the row and column artifacts, we utilized the data from the CAT experiment (Figure 5) that dem-onstrated the lowest systematic drift of all experiments. The data from the first column or averaged data from symmetrical columns 1 and 12 was used as a calibration curve, as shown on Figure 6A and B. Although the dif-ference between fitted curves was seemingly small, the activity of FXIa dilutions on columns from left to right
experienced progressive reduction up to 30% (Figure 6C, black line). In contrast, symmetrical averaging elimi-nated this trend completely (gray line).
Discussion
The clinical laboratory version of the TGT is usually intended for comparison of coagulation potentials of pa-tient and healthy donor plasma samples [2,3] or papa-tient- patient-specific evaluation of the procoagulant and anti-coagulant effects of existing and investigational treatments [4,5]. Consequently, prior research on TGT assay development largely focused on preanalytical conditions and proper calibration of assay in units of thrombin activity. Improved quality of collected blood plasma samples, control of plasma temperature as well as internal thrombin calibra-tion or normalizacalibra-tion on standard plasma sample were shown to improve assay performance.
Evaluation of drug efficacy and quality, unlike clinical applications, may be less sensitive to preanalytical condi-tions because several drug preparacondi-tions are compared with each other on the same microplate using a single sample of plasma. However, quantitative assessment of the difference between drug preparations usually re-quires comparison of different drug doses. Ideally, a bio-assay is employed in which comparison to a standard drug preparation employs a calibration curve or a paral-lel line assay. Therefore, biotechnology applications re-quire additional TGT qualification to ensure consistent low limit of detection, linear dose-response range and parallelism of tested and standard drugs.
Randomization of samples is an effective solution to correct location effects in high throughput analytical as-says, but complete randomization of sample layout on the microtiter plate is prone to procedural errors [20]. A 1 2 3 4 5 6 7 8 9 10 11 12
A B C D E F G H
Symmetrical plate layout
A
B
AH BG CF DE
0 100 200 300 400 500
Thrombin peak height (nM)
Replicates on symmetrical rows
Neat dilution 1 dilution 2 dilution 3 dilution 4 dilution 5 dilution 6 dilution 7 dilution 8 dilution 9 dilution 10 blank
Averaged symmetrical rows and columns
more practical approach is a strip-plot design in which samples are assigned to random columns and serial dilu-tions of each sample to one column [20]. However, in a typical TGT experiment, more samples are tested than there are columns on a plate, and the number of serial dilutions is smaller than there are rows. Since all coagu-lation samples are tested at least in duplicates, we propose to use a symmetrical design in which duplicates are positioned symmetrically with respect to the center of the plate. When applied to IVIG-TGT, this approach corrects the row-to-row drift and is easy to implement: (a) prior to addition to plasma, double volumes of IVIG samples are arranged in columns 1 through 6 (half of the plate), each sample in a single well, dilutions ar-ranged vertically, (b) plasma is mixed with other re-quired reagents (e.g., lipids) and transferred to cover all 96 wells of another plate, (c) IVIG samples are trans-ferred to columns 1 through 6 of the plasma plate, (d) the plasma plate is then rotated 180° degrees, and (e) stepcis repeated.
While we encountered location errors during drug screening studies, these findings may be even more im-portant for other TGT applications, e.g., use of TGT for diagnosis and treatment of patients [5]. Sensitivity of
coagulation assays to pre-analytical conditions has been known for decades yet the causes of TGT variability have only recently been investigated [19], but location artifacts were not discussed in the literature. Location ef-fect can be introduced in various ways. We found that if a coagulation enzyme, e.g., FXIa or FVIIa, is added manually to multiple wells on a microtiter plate, a well-to-well drift appears due to the different durations of contact between the enzyme and plasma inhibitors. A similar effect may be observed if TF or contact activator is added manually before recalicification. In our experi-ence, long exposure of plasma to fluorogenic substrate prior to recalcification also decreases the TGT response. Edge effects can be caused by uneven heating of microplate inside the reader and artifacts of liquid dis-penser. It should be noted that internal normalization on the thrombin-α2macroglobulin activity calibrator (e.g., as proposed by Hemker et al. [21]) is not helpful here because the thrombin calibrator only corrects for fluorogenic signal-related inaccuracies and fails to cor-rect for biological and pipetting variables [22]. All lo-cation effects may be corrected with the use of the strip-plot sample design. Specifically, when edge arti-facts are minor, our symmetrical strip-plot design
0.00 1 10 100
0 50 100 150 200 250 300
Thrombin peak height (nM)
Factor XIa (pM)
Symmetrical averages Col1-Col12 Col2-Col11 Col3-Col10 Col4-Col9 Col5-Col8 Col6-Col7
0.00 1 10 100
0 50 100 150 200 250 300
Thrombin peak height (nM)
Factor XIa (pM)
Adjacent averages Col1-Col2 Col3-Col4 Col5-Col6 Col7-Col8 Col9-Col10 Col11-Col12
1 2 3 4 5 6
0 50 100 150 200 250 300
Thrombin peak height (nM)
Column pair #
Factor XIa (pM)
400 160 64 25.6 10.24 4.1 1.6 0
Symm. averaging:
1 2 3 4 5 6 7 8 9 10 11 12
A B C
D TC
E TC
F G H
Symmetrical vs. adjacent well averaging
Advantages of symmetrical layout
D
C
B
A
Symmetrical averaging Adjacent averaging
provides the simplest practical solution for microplate-based TGT experiments.
Competing interests
The authors declare that they have no competing interests.
Authors’contributions
Dr. MVO designed the study, developed thrombin generation analysis software and wrote the paper. Dr. YL and SAW conducted the experiments presented in this paper. Dr. AMS conducted preliminary experiments and assisted with method development. Dr. TKL contributed to the study interpretations and helped writing the paper. All author’s read and approved the final manuscript.
Acknowledgement
The authors are employees of the U.S. Food and Drug Administration. The findings and conclusions in this presentation have not been formally disseminated by the Food and Drug Administration and should not be construed to represent any Agency determination or policy.
Received: 8 February 2013 Accepted: 11 May 2013 Published: 5 July 2013
References
1. Van Geffen M, Van Heerde WL:Global haemostasis assays, from bench to bedside.Thromb Res2012,129:681–687.
2. Hemker HC, Giesen PL, Ramjee M, Wagenvoord R, Beguin S:The thrombogram: monitoring thrombin generation in platelet-rich plasma.
Thromb Haemost2000,83:589–591.
3. Al Dieri R, Peyvandi F, Santagostino E, Giansily M, Mannucci PM, Schved JF, Beguin S, Hemker HC:The thrombogram in rare inherited coagulation disorders: its relation to clinical bleeding.Thromb Haemost2002,88:576–582. 4. Salvagno GL, Berntorp E:Thrombin generation testing for monitoring
hemophilia treatment: a clinical perspective.Semin Thromb Hemost2010,
36:780–790.
5. Dargaud Y, Lienhart A, Negrier C:Prospective assessment of thrombin generation test for dose monitoring of bypassing therapy in hemophilia patients with inhibitors undergoing elective surgery.Blood2010,
116:5734–5737.
6. Butenas S, Parhami-Seren B, Gissel MT, Gomperts ED, Fass DN, Mann KG:
Potency and mass of factor VIII in FVIII products.Haemophilia2009,
15:63–72.
7. Turecek PL, Varadi K, Keil B, Negrier C, Berntorp E, Astermark J, Bordet JC, Morfini M, Linari S, Schwarz HP:Factor VIII inhibitor-bypassing agents act by inducing thrombin generation and can be monitored by a thrombin generation assay.Pathophysiol Haemost Thromb2003,33:16–22. 8. Nagashima H:Studies on the different modes of action of the
anticoagulant protease inhibitors DX-9065a and Argatroban. I. Effects on thrombin generation.J Biol Chem2002,277:50439–50444.
9. Bunce MW, Toso R, Camire RM:Zymogen-like factor Xa variants restore thrombin generation and effectively bypass the intrinsic pathway in vitro.Blood2011,117:290–298.
1 10 100
50 100 150 200 250 300
)
M
n(
t
h
gi
e
h
k
a
e
p
ni
b
m
or
h
T Factor XIa (pM)
Column 1 Columns 1&2 average polynomial fit
1 2 3 4 5 6 7 8 9 10 11 12
200 300 400 500
Individual columns
Column #
Symmetrically averged columns
Factor XIa activity calculated against standard curve (pM)
C
B
1 2 3 4 5 6 7 8 9 10 11 12
A B C
D TC
E TC
F G H
Standard (calibration) curve location
A
Fitted standard curveFigure 6Biases introduced by location artifacts in the commercial CAT instrument.A. Plate layout demonstrating two locations of calibrations curves, column 1 vs. averaged symmetrical columns 1 + 12, used for bioassay analysis in this figure.“TC”denotes thrombin calibrator wells.B. Calibration curves from column 1 (filled symbols) and averaged columns 1 + 12 (open symbols) fitted using polynomial equations (red lines). Means ± S.D. (n= 2 wells).C. Calculated FXIa concentrations obtained for either individual columns 1 through 12 against calibration curve from column 1 (filled symbols) or for averaged symmetrical columns 1 + 12, 2 + 11, etc. against the calibration curve from columns 1 + 12. The activities of FXIa samples were calculated under the assumption that each column contained a single sample that was serially diluted, starting with the highest“neat”sample in the first well of the respective column, followed with 2.5 dilutions for wells 2 through 7 (well 8 was
10. Macfarlane RG, Biggs R:A thrombin generation test; the application in haemophilia and thrombocytopenia.J Clin Pathol1953,6:3–8. 11. Harrison RO, Hammock BD:Location dependent biases in automatic
96-well microplate readers.J Assoc Off Anal Chem1988,71:981–987. 12. Ovanesov MV, Shibeko AM, Woodle SA, Anderson CM, Hogwood J, Barson
H, Gray E, Scott D:Association of Factor XIa with Intravenous Immune Globulin Products Implicated in Thrombotic Adverse Events: Biochemical Root Cause Investigation.J Thromb Haemost2011,9:272. O-TU-039. 13. Roemisch JR, Kaar W, Zoechling A, Kannicht C, Putz M, Kohla G, Schulz P,
Pock K, Huber S, Fuchs S,et al:Identification of Activated FXI as the Major Biochemical Root Cause in IVIG Batches Associated with
Thromboembolic Events Analytical and Experimental Approaches Resulting in Corrective and Preventive Measures Implemented into the Octagam® Manufacturing Process.Webmed Central Immunotherapy2011,
2:WMC002002.
14. FDA Public Workshop“Risk Mitigation Strategies to Address Potential
Procoagulant Activity in Immune Globulin Products”. May 17-18, 2011. Meeting
transcript.[http://www.fda.gov/downloads/BiologicsBloodVaccines/
NewsEvents/WorkshopsMeetingsConferences/UCM258022.pdf].
15. Gray E, Wilmot H, Hogwood J, Rigsby P:Evaluation of the proposed WHO 1st Reference Reagent for Activated Blood Coagulation Factor XI (FXIa), Human.
[http://www.who.int/biologicals/expert_committee/
BS_2206_1st_Reference_Reagent_FactorXIa.pdf] 2012. 5-7-2013. 16. Ovanesov MV, Ananyeva NM, Panteleev MA, Ataullakhanov FI, Saenko EL:
Initiation and propagation of coagulation from tissue factor-bearing cell monolayers to plasma: initiator cells do not regulate spatial growth rate.
J Thromb Haemost2005,3:321–331.
17. Shibeko AM, Woodle SA, Lee TK, Ovanesov MV:Unifying the mechanism of recombinant FVIIa action: dose dependence is regulated differently by tissue factor and phospholipids.Blood2012,120:891–899.
18. Ovanesov MV:Laboratory Investigations of products associated with
thrombotic events. FDA/PPTA/HHA Workshop on“Risk Mitigation Strategies to
Address Potential Procoagulant Activity in Immune Globulin Products, May
17-18, 2011 (Rockville, MD).[http://www.fda.gov/downloads/
BiologicsBloodVaccines/NewsEvents/WorkshopsMeetingsConferences/ UCM260788.pdf].
19. De Smedt E, Hemker HC:Thrombin generation is extremely sensitive to preheating conditions.J Thromb Haemost2011,9:233–234.
20. Lansky D:Strip-plot designs, mixed models, and comparisons between linear and non-linear models for microtitre plate bioassays.Dev Biol
(Basel)2002,107:11–23.
21. Hemker HC, Giesen P, Al Dieri R, Regnault V, De Smedt E, Wagenvoord R, Lecompte T, Beguin S:Calibrated automated thrombin generation measurement in clotting plasma.Pathophysiol Haemost Thromb2003,
33:4–15.
22. Van Berkel SS, Van der Lee B, Van Delft FL, Wagenvoord R, Hemker HC, Rutjes FP:Fluorogenic peptide-based substrates for monitoring thrombin activity.Chem Med Chem2012,7:606–617.
doi:10.1186/1477-9560-11-12
Cite this article as:Lianget al.:Correction of microplate location effects improves performance of the thrombin generation test. Thrombosis Journal201311:12.
Submit your next manuscript to BioMed Central and take full advantage of:
• Convenient online submission • Thorough peer review
• No space constraints or color figure charges • Immediate publication on acceptance
• Inclusion in PubMed, CAS, Scopus and Google Scholar
• Research which is freely available for redistribution