(UDC: 616.132.2-073 ; 616.1:004.41)
Software tools for image-based modeling of fluid-solid interaction in
coronary arteries fusing ivus and angiography modalities
A. Vukicevic1*, N. Stepanovic2, D. Nikolic1,3, Z. Milosevic1,3, G. Jovicic1, S. Savic1, S.Apostolovic2, S. Šalinger-Martinović2, N. Filipovic1,3
1
Faculty of Engineering, Kragujevac, Serbia, [email protected] 2
Clinic for cardiovascular diseases, clinical center Nis 3
Bioengineering R&D Center, Kragujevac, Serbia *Corresponding author
Abstract
A method for three-dimensional modeling of coronary arteries fusing X-ray angiography and intra vascular ultrasound (IVUS) imaging modalities is presented. A 3-D IVUS catheter path is reconstructed from a pair of biplane angio images taken from same cardiac moment. Vessel wall is segmented from previously image-based ECG gated IVUS images and fused with catheter path to retrieve volumetric mesh for fluid-solid interaction simulation using finite element method.
Key words: Image based modeling, 3D reconstruction, Angiography, IVUS, FEM, FSI
1. Introduction
During the last years cardiovascular diseases became number one cause of death in developed countries. It is estimated that more than one-third of deaths in adults over age 35 are caused by some disorder in cardiovascular system [Rosamond W. et al. 2008]. Because of its high prevalence, treatment of cardio vascular disease is one of the main tasks of modern medicine. Good treatment demands good and accurate diagnosis. Therefore few imaging methods are developed to help cardiologist. Today coronary angiography and intravascular ultrasound modalities are mostly used in interventional cardiology. Using these procedures together, it is possible to estimate the percentage of narrowing of the coronary arteries as well as the structure of the wall and plaque in the wall [Wijeysundera et al. 2005] which is basic disadvantage of other modalities (CT, MRI or angiography and IVUS separately). Anyway, software with such capabilities currently does not exist on the market so doing more research in the field is necessary. In this paper fusion of state of the art imaging and simulation methods in biomedical imaging and engineering are described, validated and their applications in clinical practice are discussed.
2. Methods
syndrome. After hospitalization, coronary angiography and IVUS were performed. Among all records, most suitable were chosen and methods described in following paragraphs are tested and validated on following acquisition protocols which have to be strictly followed:
during the angiography only rotation of C-Arm is allowed,
patient is asked to hold breath during the angiography,
for every pullback two angiography views are acquired with at least 45 degrees
difference.
In the rest of the paper, basic steps for segmentation, reconstruction and modeling of coronary arteries are explained. The software application was developed combining Fortran, Matlab and C++.
3. Angio segmentation
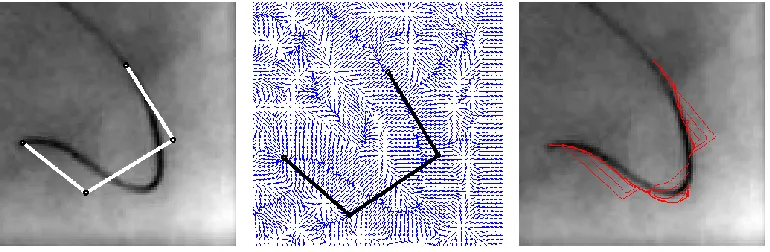
Segmentation of vessels projections in angio planes were performed semi-automatically. The frames from end diastole cardiac moment were selected and physicians were asked to mark first and last points of pullback, and at least one more(in Fig. 1. two points outside of catheter are selected). After that, active snake algorithm initially proposed by [Kass et al. 1987] is applied to automatically align B-Spline on the vessel centerline. It is presented in Fig. 1.
Fig. 1. Initialization, GVF, and evolution of snake over angio image
A snake is a parameterized curve where parameter . Snake
moves over image domain under internal and external forces minimizing energy functional:
∫ ( ) ( ) , (1)
and internal energy is :
̇ ̈ . (2)
In our implementation of algorithm, deformation of first and last point of snake is constrained, and the rest of points led to deform under external vector field (equation 5). Resulting points are
used to define control points of nonuniform 3rd order B-Spline curve [Piegl, L., and Tiller. W.,
1997] that interpolates evolving contour:
In equation 1.3 are the control points and are basis functions of order k according to
the Cox-de Boor [Piegl, L., and Tiller, W., 1997] recursive algorithm:
, -
, (4)
where are knot vectors calculated by chord length algorithm.
External vector field from equation (1) was computed by Gradient Vector Field (GVF) proposed by Xu and Prince [Xum C., and Prince, L., 1998]. GVF is described with equations:
(
) (5a)
(
) (5b)
where u and v are the forces in the x and y directions, respectively, is the edge (soebel for
example) of image and is the normalization factor that describes amount of smoothing
contour representing snake. Using first order Euler approximation, forces are computed
iteratively with time step :
* (
) + (6a)
* (
) +. (6a)
As seen from equations (6), gradients fields could be computed outside iteration loop.
4. IVUSECG gating
As IVUS imaging modality for all frames are stored as a single data array for 3D reconstruction, we need to know which of the frames belongs to characteristic moments of the cardiac phase. For example, a logical solution is to synchronize ECG diagram with IVUS pullback sequence and chose ones which belong to the end of diastole. Anyway in practice usually ECG is not acquired while doing pullback as so synchronization is very error prone task. The second reason for ECG gating may be seen in longitudinal cut as saw-blade behavior which cause errors in the reconstruction. It is assumed that those effects come from the heart motion and contraction of the vessel wall because of pressure changes during the cardiac cycle. Consequence of the effect are seen in IVUS images as periodic changing of position, orientation of vessel wall and image intensity in rhythm of cardiac motion. To overcome anomalies in the reconstruction, usually image based methods for ECG gating are used [Zhu et al. 2003, Hernàndez-Sabaté et al. 2009,Hernàndez-Sabaté et al. 2011].
Absolute intensity method [Zhu et al. 2003] is based on the observation of the wall and pixels intensity during cardiac cycle. The absolute intensity of region of interest (ROI) usually defined with vessel wall boundaries is defined as:
∑
(7)
between 0.8~1.1 Hz, which characterize human heart beating, Butterworth [Butterworth 1930] band pass filter was applied:
√ ( ∗ )
(8)
where n=4 is the order of the filter and ∗ . As result (Fig.2.) we get cardiac
component of absolute intensity of image. Subtracting high frequency cardiac signal from original signal, low frequency signal representing deformations caused by geometry is obtained as shown in Fig. 2. Peaks on the cardiac components are assumed to be in same cardiac moments and frames from those moments are preceded in the next step for segmentation.
Fig. 2. Absolute intensity over IVUS frames and filtering results
5. IVUS Segmentation
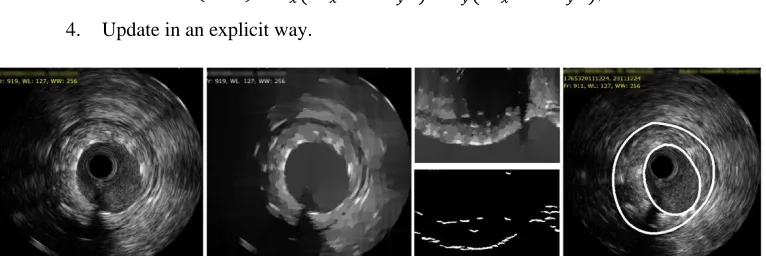
When we know frames are from the same cardiac moment, the segmentation of images are performed as follows. Coherence-Enhancing Anisotropic Diffusion filtering [Weickert, 1998, Cañero Morales et al. 2003] with a diffusion tensor D evolves the initial image under an evolution equation of type:
, ( ), (9)
( ) ( ) (10)
which leads to four-step iterative algorithm:
1. Calculate the structure and diffusion tensor,
2. Calculate the flux components and ( ),
3. Calculate ( ) ( ),
4. Update in an explicit way.
Fig. 3. Ivus segmentation; initial image, midresults after enhancing, polar gradients and resulting contours
After anisotropic smoothing, image 3.b is converted to polar coordinates where tetha
goes form 0 to 360 and radius goes from 0 to 256. After applying radial image gradient
(Fig. 3. C) it is assumed that lumen wall lay on first pixel with gradient higher than
threshold (any small value). The angles with echoes, noises or unstable gradients are automatically detected as high curvature changes and ignored during the contour interpolation. In similar way, combined with algorithms proposed by [Gil et al. 2006], adventitia bored has been detected. Our current algorithm implementation for lumen detection gives valid results in over 85% of pullback frames, while for adventitia border accuracy decreases significantly so algorithm is not discussed in details. At current stage manually checking and fixing error tools have been implemented before proceeding next step to generate mesh from segmented contours.
6. Extraction of 3D catheter path
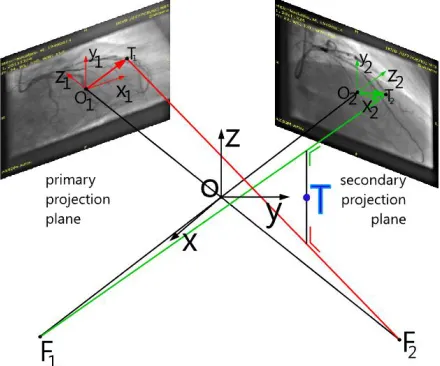
Fig. 4. Transformation matrix for reconstructing catheter path from angiography
Now, getting real 3D position of x-ray source and projection plane origins , is straight
forward:
∗ [ ] ∗ ∗ , (12)
∗ [ ] ∗ ∗ (13)
and the same steps are performed for any pair of points taken from angio B-Splines defined in step 1 with equations 4.a and 4.b.
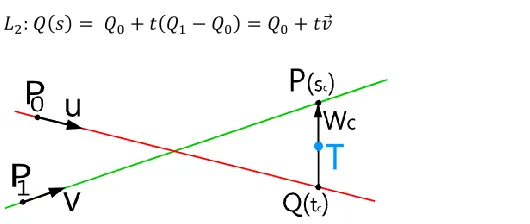
Fig. 5. Sketch of method for calculating 3D point from biplane projections
In order to find arbitrary catheter path point in 3D from two biplane projections we need to
know focal point (X-Ray source position in 3D) and the position of point in 3D (angio
plane oriented in space) as so as , and from second projection. From those four points
two 3D lines and (eq. 14, 15) are defined and the point T is laying on minimal distance
between those two lines as shown in Figure 5 and 6.
⃗ (14)
𝑖 c β α ∗ β c α ∗ β j c α α
β α ∗ c β c α ∗ c β
(15)
Fig. 6. Finding point from two projection lines defined with four points, equations 4.4 and 4.5
If two lines and are not parallel, then there is a unique vector ⃗⃗⃗⃗ ⃗⃗ defined with
points from lines and and normal on the direction of both lines defined with lines
unit vectors ⃗ and , so that next equations are satisfied:
⃗ ⃗⃗⃗⃗ (16a)
⃗⃗⃗⃗ (16b)
Adding equation (16b) to equation (16a) we get:
⃗⃗⃗⃗ ⃗⃗⃗⃗ ⃗ , (17)
where ⃗⃗⃗⃗ , so two simulations equations are retrieved:
⃗ ⃗ ⃗ ⃗ ⃗⃗⃗⃗ (18a)
⃗ ⃗⃗⃗⃗ (18b)
Then we obtain ⃗ ⃗ , ⃗ , , ⃗ ⃗⃗⃗⃗ and ⃗⃗⃗⃗ . Solving these
equations we obtain and :
( ) (19a)
( ) (19b)
if expression is nonzero.
7. IVUS frames orientation in 3D and fem mesh generation
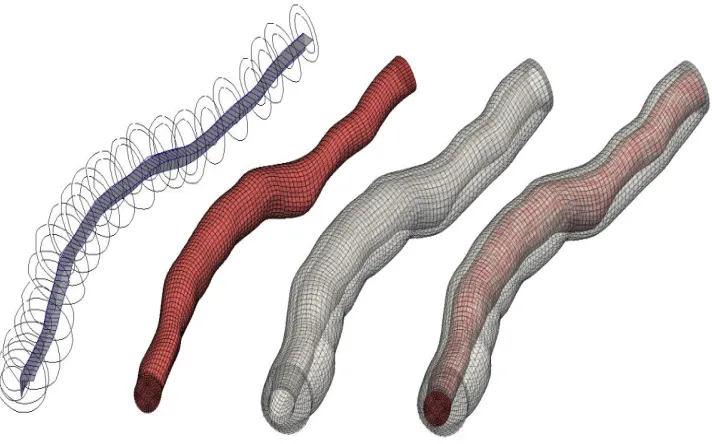
Catheter centerline is defined with B-spline from points retrieved in previous step, and next step is placing IVUS contour slices in 3D planes defined with curve normal and binormal. If the 3D
curve is defined parametrically as then from differential geometry
tangent, normal and binormal are defined as:
( ) ⃗ (| | ) ⃗ ⃗ , (20a)
where ( ) ( ) is curvature. (20b)
⃗⃗⃗⃗⃗⃗⃗ ̇ ⃗ (21a)
⃗⃗⃗⃗⃗⃗⃗⃗ ̇ ⃗ (21b)
⃗⃗⃗⃗⃗⃗⃗⃗ ̇ ⃗ (21c)
For smooth representation through curve and twisting effect minimization(Figure 7 left) analytical model of catheter (Guido et al. 1999) is used. Each frame is defined by location of its
center and a local 2D coordinate system is defined with vectors ⃗ and ⃗ . For arbitary
points on the spline defined with parameters absolute orientation of the i-th frame is defined
using ECG gating method described in the section 4. Instead of computing absolute image intensity, moving and rotation of vessel center of mass in 2D are calculated [Hernàndez- Sabaté et al. 2009].
At the end we normalize gated ID of frames with total number of frames in pullback in
order to get parameter s[0…1] which define point position in B-Spline where we should place
slice contour. Then previous steps are performed on each point to get proper contours and meshes (Figure 7)
Fig. 7. Resulting 3D contours with valid contour orientation and generated FEM mesh for fluid, solid and complete FSI model
8. Mathematical Model of FSI simulation
The governing equations, which include the Navier-Stokes equations of balance of linear momentum and the continuity equation, can be written in the ALE formulation as [Donea et al. 1982, Donea, 1983, Nitikitpaiboon and Bathe, 1993, Filipovic, 1999, Filipovic, et al. 2006].
Bi jj i i j i m j j
i v v v p v f
v* , ,
,
(22)
0 ,i i v
(23)
where
v
i andm i
v are the velocity components of a generic fluid particle and of the point on the
moving mesh occupied by the fluid particle, respectively;
is fluid density,p
is fluidpressure,
is dynamic viscosity, and fiB are the body force components. The symbol ―‖denotes the mesh-referential time derivative, i.e. the time derivative at a considered point on the mesh,
t
iconst
(
)
*
(24)
and the symbol ―,i‖ denotes partial derivative, i.e.
i i
x
(
)
)
(
, (25)We use
x
i and
i as Cartesian coordinates of a generic particle in space and of thecorresponding point on the mesh, respectively. The repeated index means summation, from 1 to 3, i.e. j=1,2,3 in Eq. (22), and i=1,2,3 in Eq. (23). In deriving Eq. (22) we used the following expression for the material derivative (corresponding to a fixed material point)
Dt
v
D
(
i)
/
,i j m j j i i
x
v
v
v
t
v
Dt
v
D
(
)
(
)
(
)
)
(
(26)The derivatives on the right-hand side correspond to a generic point on the mesh, with the mesh-referential derivative and the convective term.
Using the linearization (25) we obtain from (22) and (23) the system of ordinary differential equations in the form
) 1 ( ) 1 ( ) 1 ( * ) 1
(
V
K
V
K
P
F
F
M
t vp t t tvv t
t
(27) and ) 2 ( ) 2 ( ) 2 ( * ) 2
(
V
K
V
F
F
M
t t tvv t
t
(28)
9. Fluid-structure interaction
For fluid-structure interaction problem the wall displacements can be large, hence the problem becomes geometrically nonlinear. Also, the tissue of blood vessels has nonlinear constitutive laws, leading to materially-nonlinear finite element formulation. For a nonlinear wall tissue problem, the incremental-iterative equation is using:
( 1) ( ) ( 1) int( 1)
ˆ ˆ
t t i i t t i t t i
tissue
K U F F (29)
where U( )i are the nodal displacement increments for the iteration ‗i‘, and the system matrix
( 1)
ˆ t t i
tissue
K , the force vector ttFˆ( 1)i and the vector of internal forces tt int(i1)
F correspond to
the previous iteration
The geometrically linear part of the stiffness matrix,
t t L
(tissuei1)
K , and nodal force vector,
int( 1) tt i
F , are defined:
( 1) ( 1)
int
( 1) ( 1),
i i
t t T t t i t t T t t i L tissue L tissue L L
V V
dV dV
K
B C B F
B σ (30)
where the consistent tangent constitutive matrix t t ( 1)tissuei
C of tissue and the stresses at the end of
time step ttσ( 1)i depend on the material model used. Calculation of the matrix t t ( 1)tissuei
C and
10. Results
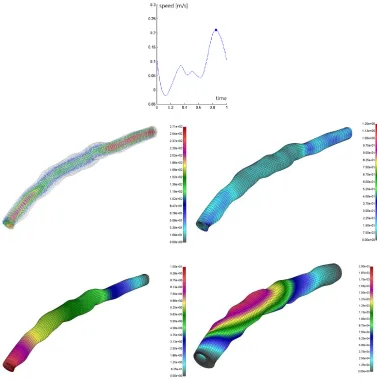
The following example have shown above described methods. A hexahedral isoparametric mesh for both solid and fluid was created. Fluid domain was discretized in 23252 nodes and 21760 elements and solid domain was discretized with 19872 nodes and 317408 elements. Fluid inlet wave function for the physiological condition of the right coronary artery is used (Fig. 8.). The calculation was performed using HPC cluster consisting of 30 nodes, 4 CPU cores each. A set of post processing tools were created for user friendly representation of results and conversion to the other data formats (vtk,vtu,stl). The results in Fig. 8. have shown that using described methods for 3D image reconstruction and numerical simulation, it is possible to get valid physiological geometrics about coronary arteries which has importance in the clinical and diagnosis practice.
11. Conclusion and discussion
Described method represents a solution which can be used for image segmentation, finite element mesh generation and spatial visualization of influences of mechanical factors. Results obtained by the algorithms that are employed for the 3D reconstruction and modeling are very valuable because they make possible to visualize and present spatial distribution of biomechanical quantities which is practically impossible to obtain without modeling. Advantage of presented methods is that they represent a valuable instrument for better diagnosis of specific patient blood vessel conditions. By combining IVUS imaging and Angiography a total new dimension for using in the medical diagnostic is achieved.
The presented method provides accurate 3D artery reconstruction from IVUS and Angiography image modalities, with ability of detection of luminal narrowing, on one side, and generating finite element models and processing them, on the other side.
Извод
Софтверски алати за моделирање реакције флуида и солида у
коронарним артеријама на основу слика спајањем могућности IVUS и
ангиографије
A. Vukicevic1*, N. Stepanovic2, D. Nikolic1,3, Z. Milosevic1,3, G. Jovicic1, S. Savic1, S.Apostolovic2, S. Šalinger-Martinović2, N. Filipovic1,3
1
Faculty of Engineering, Kragujevac, Serbia, [email protected] 2
Faculty of Medicine University of Nis, Nis, Serbia 3
Bioengineering R&D Center, Kragujevac, Serbia *Corresponding author
Резиме
У раду је представљена метода за тродимензионално моделирање коронарних артерија комбинацијом коронарне ангиографије и интраваскуларног ултразвучног (IVUS) модалитета. Тродимензионална путања катетера IVUS-а је реконструисана из неколико ангио снимака узетих из истих тренутака кардио циклуса (крај дијастолне фазе). Сегментација унутрашњег и спољашњег зида је вршена на претходно аутоматски ЕКГ-бираним сликама IVUS-а, а добијене контуре су повезане са путањом катетера како би се добио њихов положај у простору. На овај начин, за датог пацијента, добијен је тродимензионални модел коришћен за симулирање флуид-солид интеракције крви и зида артерије методом коначних елемената.
Кључне речи: Моделирање на основу слика, 3D реконструкција, ангиографија, IVUS, FEM, FSI
Reference
Bathe, K.J.(1996) Finite Element Procedures, Prentice-Hall. Englewood Cliffs. NJ.
Biot, M.A. (1941) General theory of three-dimensional consolidation, J. Appl. Physics, 12, 155–64.
Butterworth, S., (1930) On the Theory of Filter Amplifiers, In Wireless Engineer (also called Experimental Wireless and the Wireless Engineer), 7: 536–541.
Cañero Morales, C., Radeva, P., (2003), Vesselness enhancement diffusion. Pattern Recognition Letters 24(16): 3141-3151.
Donea, J. (1983). Arbitrary Lagrangian– Eulerian finite elements methods. In T. Belytschko & Frenet, F. (1847), Sur les courbes à double courbure, Thèse, Toulouse. Abstract in J. de Math.
17, 1852.
Gil, D., Hernàndez, A., Mauri, J., Radeva, P., (2006) A Deterministic-Statistic Strategy for Media-Adventitia Border Modeling in IVUS sequences, IEEE Transactions on Medical Imaging, in IVUS Images 25(6).
Hernàndez-Sabaté, A., Gil, D., Garcia-Barnés, J., Martí, E. (2011). Image-based cardiac phase
retrieval in intravascular ultrasound sequences, IEEE Transaction on
Ultrasonics,Ferroelectrics, and Frequency Control 58(1): 60–72.
Hui Zhu, Kevin D, Oakeson, Morton H. (2003) Retrieval of Cardiac Phase from IVUS Sequences, Friedman Department of Biomedical Engineering, Duke University-Medical Imaging: Ultrasonic Imaging and Signal Processing.
Kass, M., Witkin, A., Terzopoulos, D., (1988), Snakes: Active Contour Models, International Journal of Computer Vision, KIuwer Academic Publishers, Boston, Manufactured in The Netherlands. 321-331.
Kojić,M., Filipović, N., Slavković, R., Živković, M., Grujović, N., (1998), PAKF: Program for FE analysis of fluid flow with heat transfer, Faculty of Mechanical Engineering Kragujevac, University of Kragujevac.
Piegl L., and Tiller W., (1995 and 1997), The Nurbs Book, 2nd Edition, Springer- Verlag Berlin Heidelberg .
Rosamond W., Flegal K., Furie K., et al. (2008) Heart disease and stroke statistics update: a report from the American Heart Association Statistics Committee and Stroke Statistics Subcommittee. Circulation 117(e25).
Rosamond W., Flegal K., Furie K., et al. (2008), Heart disease and stroke statistics--2008 update: a report from the American Heart Association Statistics Committee and Stroke Statistics Subcommittee. Circulation, 117(e25).
T.J.R. Hughes (eds.), Computational Methods for Transient Analysis, Elsevier,Amsterdam. 473–516.
Wahle A, Oswald H, Fleck E. (1996) 3D Heart-Vessel Reconstruction from Biplane Angiograms. IEEE Computer Graphics and Applications, 65(73).
Wahle, A., Prause G., DeJong, S., Sonka M., (1999), Geometrically Correct 3-D Reconstruction of Intravascular Ultrasound Images by Fusion with Biplane Angiography - Methods and Validation, IEEE Transactions on medical imaging, final manuscript, 30(1):187/98.
Weickert, J., (1998), Anisotropic Diffusion in Image Processing- ECMI Series, Teubner-Verlag, Stuttgart, Germany.
Wijeysundera HC, Machado M, Farahati F, et al. (2010) Association of temporal trends in risk factors and treatment uptake with coronary heart disease mortality, 1994--2005. JAMA;303:1841-1847.