Mathematical and Computational Published: Mar. 30, 2015
Forestry & Natural-Resource Sciences Last Correction: Mar. 31, 2015
GLOBAL PULPWOOD MARKETS AND THE LAW OF ONE PRICE
Virginia Morales Olmos
1, Jacek Siry
2,
1
Centro Universitario de Tacuaremb´o Universidad de la Rep´ublica-Uruguay
1
WSFNR, University of Georgia, Athens, GA, USA
Abstract.Many models of international trade assume that perfect competition exists and externalities do not distort market behavior. The Law of One Price (LOP) is said to hold when the price of a similar product is the same in different markets when expressed in common currency. Considering pulpwood markets, it has been suggested that long-term relationships exist among various markets, but the LOP does not necessarily hold. Most of this research has been performed for the most developed forest sectors in the world, such as the United States and Scandinavia. With the progressing globalization of forest production, we expected that pulpwood prices in various countries would follow similar trends. The objective of this research was to study the global pulpwood market and relationships among the most important producers. Using Johansen cointegration method, the LOP was tested for pulpwood prices in the United States, Canada, Germany, Sweden, Finland, Norway, France, Spain, Chile, Brazil, New Zealand, and Australia from 1988 to 2012. The results suggested that while several long-term price relationships have been discovered, the LOP generally did not hold. The exception were Germany and Norway, where the LOP was close to holding for coniferous prices.
Keywords: Pulpwood prices, wood markets, cointegration, Law of One Price
1
Introduction
The progressing globalization of forest markets and changes in international trade may influence how in-dustrial roundwood marktes operate around the world (M¨aki-Hakola 2002; Toivonen et al. 2002). In analyz-ing international commodity markets, several authors have claimed that the price of a product should be the same in competitive markets when adjusted for exchange rates (Ardeni 1989; Goodwin 1992). This relationship is called the Law of One Price (LOP). Perfect competi-tion assumes that (1) the actors behave in a racompeti-tional way, (2) the firms are price takers, (3) products are homogeneous, (4) there is perfect information, (5) the transactions costs are small, and (6) there are no bar-riers to entry or exit (Wetzstein 2005, pages 258-259). For example, it has been argued that agricultural prod-ucts are homogeneous, and producing them in differ-ent countries should not lead to differences in prices (Ardeni 1989; Goodwin 1992; Knetter 1989; Miljkovic 1999). Others, however, have claimed that LOP does not hold in the majority of cases, despite the fact that many models have assumed perfectly competitive mar-kets worldwide (Miljkovic 1999). Tests of the LOP have been widely performed in agricultural commodity
mar-kets and in many instances the law was not satisfied (Miljkovic 1999). Different reasons have been provided for this outcome. Among others, they include trans-portation costs, pricing to market, exchange risks, in-stitutional factors, and non-tradable production inputs (Miljkovic 1999).
In forestry, Buongiorno and Uusivuori (1992) tested the pulp and paper export prices from the United States (US) to six European countries and Japan between 1978 and 1988 for the LOP. The results showed that the LOP could not be rejected in 52 of the 56 pairs of price se-ries analyzed. The LOP was also tested for hardwood pulpwood, mixed hardwood sawtimber, and oak sawtim-ber markets in six states of the US –Alabama, Arkansas, Louisiana, Mississippi, Tennessee, and Texas– from 1977 to 1997 (Nagubadi et al. 2001). The authors found that while the LOP did not hold these markets were partially integrated, meaning that they can be grouped accord-ing to their long-term price trends. Furthermore, thir-teen stumpage pine sawtimber and eleven pine pulpwood markets in eight southern states –Texas, Louisiana, Al-abama, Florida, Georgia, South Carolina, Mississippi, and Arkansas– were tested for cointegration between 1977 and 1996 (Yin et al. 2002). The results showed that southern pine sawtimber and pulpwood markets
were partially integrated. These markets could have been grouped in different ways, and the distance was not always a major criterion in their groupings.
In Scandinavia, Finnish roundwood markets were tested for the LOP after structural changes that oc-curred in the 1980s and 1990s (Toppinen 1998). It was found that the LOP between the four major geographic regions in Finland held only for pine sawtimber prices. Norway spruce pulpwood prices were tested for the LOP using quarterly domestic, import and export price se-ries for 1988-2000 (Nyrud 2002). The results indicated that the LOP held for the domestic and imported prices. Størdal and Nyrud (2003) tested the LOP for Norwe-gian roundwood markets and found that the LOP held for pine pulpwood prices only when transportation costs were included in the analysis. The LOP was tested for roundwood markets in Austria, Finland, and Sweden be-tween 1980 and 1997 (Toivonen et al. 2002). Annual delivered sawtimber and pulpwood prices for pine and spruce were used. The LOP held for roundwood mar-kets in Finland and Sweden, but not between Finland and Austria, or Sweden and Austria. In addition, it was found that shocks in Finnish roundwood markets impacted markets in Sweden. Toppinen et al. (2005) studied nominal delivered prices for pine, spruce, and birch from 1996 to 2004 and found that pulpwood prices were not cointegrated in the long run. M¨aki-Hakola (2002) tested a similar group of markets for cointegra-tion, including roundwood markets in Finland, Estonia, Germany, and Lithuania between 1994 and 2001. The author found that pine pulpwood markets in those coun-tries were cointegrated and that birch and spruce pulp-wood markets were partially integrated.
While several studies analyzed the LOP for round-wood markets in a country or a region, there has been no study analyzing the most important global pulpwood markets. Moreover, most of the existing studies did not estimate the adjustment dynamics of the round-wood prices. The objective of this study was to test the LOP in global pulpwood markets and to analyze the relationships among prices in the most important pulpwood markets. Markets selected for this study in-cluded the US Southeast, the US Northwest, Canada East, Canada West, Germany, Sweden, Finland, Nor-way, France, Spain, Chile, Brazil, New Zealand, and Australia. These markets were selected according to their share in the total world production by volume and as dictated by data availability. Price data were divided into coniferous and non-coniferous products and then these markets were grouped according to three criteria: (1) region, (2) trade volume and direction, and (3) pro-duction volume. The next section provides background information for the selected pulpwood producers, includ-ing the information about their forest resources, wood
production and trade, and pulpwood markets. The de-scription of methods and data used comes next. The last sections provide a detailed description and discussion of the results.
2
Forest resources
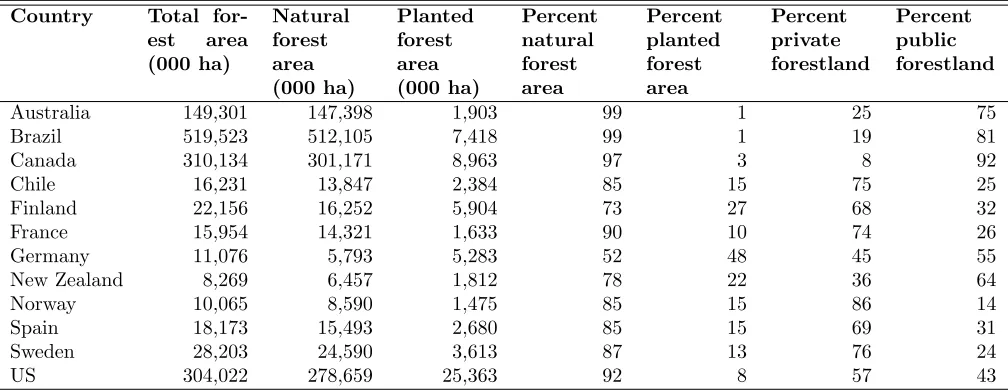
2.1 Forest cover While several of the analyzed coun-tries have large forest area, only a small fraction of that area is typically devoted to plantations (Table 1). For example, in South America Brazil has a total of 519.5 million hectares (ha) of forests, of which 1 % are planted forests. Chile has 16.2 million ha, of which 15% are planted forests. The US has the largest area of planted forests among the analyzed countries with 25.3 million ha. In Oceania, Australia has a total of 149.3 million ha of forest, which represents 19% of its landmass, but only 1.9 million ha are planted forests. Similarly, New Zealand has a total of 8.2 million, of which 22% are planted forest. In Europe, Sweden has 69% of the land area covered with forests, including 3.6 million ha of plantations. Finland has around 73% of its area cov-ered with forests, from which 16.2 million ha are natural forests. Germany has a similar planted area to Finland, 5.3 million ha, and 5.8 million ha of natural forests. Fi-nally, Spain, Norway, and France have around 30-35% of their land area covered with forests, from which 15% are planted in Spain and Norway, and 10% in France.
The ownership of the forest resources differs among the selected countries. In Australia, Brazil, and Canada the majority of the land is publicly owned. In Chile, Finland, France, Norway, Spain and Sweden, the ma-jority of the land is privately owned. Germany and the US have the ownership of forest resources nearly evenly distributed between public and private ownership. For example, in Norway 80% of the forests are owned by pri-vate landowners such as individuals and families, 12% is owned by the state and local governments, 4% by indus-tries, and 4 % is common land; while in Sweden 50% of the forestland is owned by private landowners and the rest is divided equally between public forestlands and in-dustrial forestlands (Nordic Family Forestry 2013a, b). Another example is Chile, where the majority of the privately owned forestland is owned by to vertically in-tegrated companies, CMPC and Arauco (Lignum 2012).
Table 1: Forest area by country
Country Total for-est area (000 ha)
Natural forest area (000 ha)
Planted forest area (000 ha)
Percent natural forest area
Percent planted forest area
Percent private forestland
Percent public forestland
Australia 149,301 147,398 1,903 99 1 25 75
Brazil 519,523 512,105 7,418 99 1 19 81
Canada 310,134 301,171 8,963 97 3 8 92
Chile 16,231 13,847 2,384 85 15 75 25
Finland 22,156 16,252 5,904 73 27 68 32
France 15,954 14,321 1,633 90 10 74 26
Germany 11,076 5,793 5,283 52 48 45 55
New Zealand 8,269 6,457 1,812 78 22 36 64
Norway 10,065 8,590 1,475 85 15 86 14
Spain 18,173 15,493 2,680 85 15 69 31
Sweden 28,203 24,590 3,613 87 13 76 24
US 304,022 278,659 25,363 92 8 57 43
∗Source: FAO (2010)
is produced and consumed primarily within a country in which it is produced; the share of exports in the total production of roundwood worldwide was 7% as of 2012 (FAO 2013). Industrial roundwood production world-wide was 1,657 million cubic meters (m3) as of 2012
(FAO 2013).
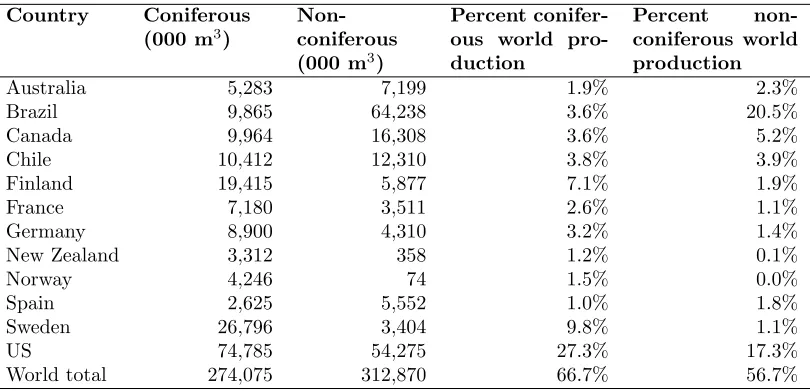
Pulpwood is defined by FAO as the roundwood and wood chips made directly from the roundwood that is used to produce wood pulp, particleboard, and fiber-board (FAO 2013a, page 4). World pulpwood produc-tion reached 586.9 million m3 in 2012. Four countries
accounted for 50% of pulpwood output, with the US producing 23.4 % of the total volume. Brazil ranked second as a pulpwood producer.
Wood pulp is the most important product derived from pulpwood. It is defined by FAO as the product prepared by mechanical or chemical process from pulp-wood, wood chips, particles or residues and used to pro-duce paper, paperboard, fiberboard and other cellulose products (FAO 2013a, page 8). The US, Brazil, Canada, Sweden, and Finland account for 61% of wood pulp pro-duction in the world. The leading producer is the US with 29% of the market, followed by Canada and Brazil, with 11% and 8%, respectively. Canada is the leading exporter of wood pulp in US dollars (USD) followed by the US and Brazil. The other important South Ameri-can country is Chile, with 8% of the market.
Regarding coniferous pulpwood, the US alone pro-duced 74.8 million m3 of coniferous pulpwood in 2012
(Table 2). Chile produced 10.4 million m3 of
conifer-ous industrial roundwood. Except for Spain, the Eu-ropean countries produce mainly coniferous pulpwood.
The exports were directed to countries in the region. In addition, the Scandinavian countries imported round-wood from Russia. Brazil is the leading producer of non-coniferous pulpwood among the selected countries; with 64.2 million of m3of production by 2012. The
sec-ond largest producer in the world is the US.
Global pulpwood production by volume was less con-centrated in 2011 than in 2000. In 2000, top five largest producers accounted for 62% of the worldwide produc-tion. In 2011, these top five producers accounted for 50% of the output. The five second tier producers in-creased their market share from 15% to 17% between 2000 and 2011, and the five third tier countries had a similar share throughout the period. The largest change among the top five pulpwood producers has been the ris-ing market share of Brazil, increasris-ing from 9% to 12% from 2000 to 2011. As a result, Brazil has become the second pulpwood producer in the world by volume.
di-Table 2: Pulpwood production
Country Coniferous (000 m3)
Non-coniferous (000 m3)
Percent conifer-ous world pro-duction
Percent non-coniferous world production
Australia 5,283 7,199 1.9% 2.3%
Brazil 9,865 64,238 3.6% 20.5%
Canada 9,964 16,308 3.6% 5.2%
Chile 10,412 12,310 3.8% 3.9%
Finland 19,415 5,877 7.1% 1.9%
France 7,180 3,511 2.6% 1.1%
Germany 8,900 4,310 3.2% 1.4%
New Zealand 3,312 358 1.2% 0.1%
Norway 4,246 74 1.5% 0.0%
Spain 2,625 5,552 1.0% 1.8%
Sweden 26,796 3,404 9.8% 1.1%
US 74,785 54,275 27.3% 17.3%
World total 274,075 312,870 66.7% 56.7%
∗Source: FAO (2013b)
rectly by the wood pulp industry, so consequently the pulpwood buyers are highly concentrated and may ex-ert a degree of market power. Likewise, Sweden had relied on agreements to set pulpwood prices, which be-fore 1995 were negotiated by the be-forest owners associa-tions (Lundmark and Shahrammehr 2011). In Germany forests owned by federated states supplied 44% of the total roundwood as of 2002; however, pulpwood prices have been determined by open markets with the presence of some intermediaries (M¨aki-Hakola 2002). Among the selected European countries, Spain is the one with the highest share of industrial roundwood imports and prices are determined in open markets (Ortu˜no P´erez 2012). In France, 66% of roundwood from privately owned sales are conducted by direct sales, 25% by supply agree-ments, and 9% by auctions (Elyakime and Cabanettes 2009). In the case of publicly owned forestland, around 50% of the roundwood is sold in auctions, 40% is sold through direct sales, and 10% through supply agree-ments.
The US is the world’s leading pulpwood producer. The majority of the pulpwood comes from privately owned forestland and prices are set in an open mar-ket. In the Southeast, 70% of the production came from non-industrial forestlands and 26% came from forest-lands owned by private corporate groups (Johnson et al. 2011). In Canada, the government established an annual allowable cut (AAC) for the public lands in order to har-vest in a sustainable fashion (Canadian Forest Service 2012). Even though pulpwood prices are not being set through negotiations, the high concentration in the pulp industry may result in uncompetitive markets and
pric-ing powers. In Brazil, pulpwood prices are determined in an increasingly open market as the firms increasingly rely on “fomento” programs for their wood supply rather than their own forestland (Soares et al 2010 in Marques 2012, page 50). In the “fomento” program landowners produce wood for the firm on their own land following the management regime established by the firm and the wood is sold at market prices.
In New Zealand, pulpwood is destined either for ex-port or local markets (Niquidet and Manley 2007), and prices are determined in an open market (Gorman 2002). In Australia, most of the non-coniferous pulpwood comes from native forest owned by the state government (Neil-son and Flynn 2004). As of 2011, the total pulp-wood harvested came 17% from native non-coniferous, 41% from planted non-coniferous, and 42% from conifer-ous (Department of Agriculture Fisheries and Forestry 2014). Pulpwood prices were set by the local govern-ments in long-term harvest contracts with the goal of securing roundwood volumes for the industry (Depart-ment of Agriculture Fisheries and Forestry 2013, page 24). In the 2000s, the government started to encourage the use of open market mechanisms.
3
Data and methods
coniferous pulpwood price series were obtained for the following markets: the US Southeast, the US Northwest, Canada East, Canada West, Germany, Sweden, Finland, Norway, France, Spain, Chile, Brazil, New Zealand, and Australia. The non-coniferous pulpwood prices were ob-tained for the following markets: the US Southeast, the US Northwest, Canada East, Canada West, Germany, Sweden, Finland, France, Spain, Chile, Brazil, and Aus-tralia.
Exchange rates were obtained from the Organization for Economic Co-operation and Development (OECD) website for Australia, Canada, Chile, New Zealand, Norway, and Sweden (OECD 2013). For Germany, Spain, France, and Finland, exchange rates were ob-tained from the German Central Bank (Deutsche Bun-desbank 2013a). For Brazil, exchange rates were ob-tained from the Central Bank of Brazil (Central Bank of Brazil 2013b). CPIs were obtained from the Office of Statistics of each country, except as following: for the United States, the St. Louis Federal Reserve; for Brazil, the Central Bank of Brazil; and for Germany, the Cen-tral Bank of Germany (AusCen-tralian Bureau of Statistics 2013; Central Bank of Brazil 2013a; Central Bank of Chile 2013; Deutsche Bundesbank 2013b; Instituto Na-cional de Estadstica 2013; National Institute of Statistics and Economic Studies 2013; St. Louis Federal Reserve 2013; Statistics Canada 2013; Statistics Finland 2013; Statistics New Zealand 2013; Statistics Norway 2013; Statistics Sweden 2013). All the CPIs were converted to 2009 base year.
Whenever the analysis included Brazil, the time pe-riod investigated started in the third quarter of 1994 when the Plan Real was executed (Alves et al. 2001). This price series is noted as Brazil94. Brazil changed its
currency and experienced hyperinflation since 1988 until 1994 when it introduced the Real (BRL). The BRL was fixed to the USD one to one, so the government would intervene when the BRL was valued at one USD, but would not intervene when it was worth more than one USD (Frenkel and Rapetti 2010). In 1999, the govern-ment allowed the BRL to float freely.
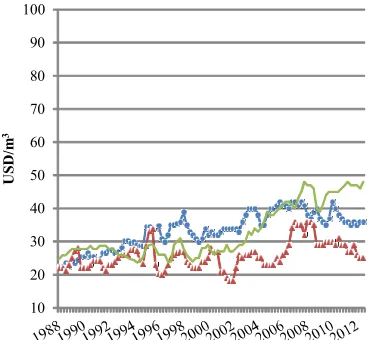
Average delivered coniferous pulpwood nominal prices for the period ranged from 22 to 55 USD/m3depending on the country and on the region (Table 3). For the period 1988-2012, Chile had the lowest average price, while Germany had the highest,similar to Norway and Finland. Brazilian prices had the highest variation of the period, 54%, while the US Southeast had the lowest variation, 11%.
The 2008 world financial crisis is reflected in pulp-wood prices of all the countries analyzed with a marked decrease in pulpwood prices that year (Figure 1). Prices in the US Northwest and in Canada West showed in-creases in the mid-90s.
Prices in Norway, Finland, Germany, and Sweden showed similar trends. The European storms in 1999, 2004, and 2006 led to an increase in harvest levels to re-cover the downed wood. This increase in harvest might have lowered price levels in the region as well.
In the Southern hemisphere, Brazil showed the largest increase in pulpwood prices since the second half of the 2000s. Coniferous roundwood prices in New Zealand showed similar trends to prices in Australia since the end of the 1990s. While in New Zealand prices have been set in open markets, in Australia the government started en-couraging open market mechanisms since 2000. There-fore, the roundwood prices of New Zealand might have adjusted to the prices in Australia when open market mechanisms were set. Finally, France and Spain showed similar trends until 2003.
Non-coniferous pulpwood delivered prices ranged from an average of 28 to 61 USD/ m3 (Table 4). The
non-coniferous group has fewer countries than the conifer-ous group because there are fewer non-coniferconifer-ous pulp-wood producers of significance worldwide meeting the 5% threshold. Brazilian prices had the highest variation in the period, 54%, while prices in the US had the lowest variation, 14%.
Non-coniferous price series contained more variability than coniferous price series (Figure 2). In North Amer-ica, the changes in prices were less dramatic than in Eu-rope, while in the Southern hemisphere prices started to increase in the 2000s. In South America, the most im-portant producer is Brazil which historically had had low roundwood prices. However, from 2004 prices have been increasing. It is important to note that prices also in-creased in local currencies; therefore, the exchange rate was not necessarily a factor for the increase. In Europe, Spain, another important producer of non-coniferous pulpwood, showed peaks in 1995 and again in the 2006 when prices in Euros also increased.
Table 3: Delivered coniferous pulpwood nominal price statistics, in USD/m3
Pulpwood Market
Number of observations
Mean Standard deviation
Coefficient of variation
Minimum Maximum
US Southeast 99 35 4 11% 25 45
US Northwest 99 33 8 24% 22 55
Canada East 99 47 10 21% 33 68
Canada West 99 31 8 26% 19 59
Norway 99 55 9 16% 38 76
Sweden 99 51 12 24% 31 75
Finland 99 54 12 22% 35 83
France 99 52 10 19% 34 76
Germany 99 56 9 16% 36 76
Spain 99 35 8 23% 24 53
Brazil 99 26 14 54% 11 58
Chile 99 22 7 32% 9 38
New Zealand 99 26 6 23% 18 43
Australia 99 29 6 21% 17 44
Table 4: Non-coniferous pulpwood delivered nominal price statistics, in USD/m3
Pulpwood Market
Number of observations
Mean Standard deviation
Coefficient of variation
Minimum Maximum
US Southeast 99 33 5 15% 23 42
US Northwest 99 26 4 15% 18 36
Canada East 99 33 8 24% 24 48
Sweden 99 52 11 21% 31 74
Finland 99 54 12 22% 35 81
France 99 44 10 23% 29 67
Germany 99 53 17 32% 23 89
Spain 99 61 14 23% 42 94
Brazil 99 28 15 54% 10 64
Chile 99 35 8 23% 18 53
Australia 99 41 14 34% 24 77
vector error correction models (VECMs) are a type of VAR model whereby the restriction is imposed that a long-run equilibrium relationship exists among the non-stationary variables of the system. In this case, the vari-ables are said to be cointegrated.
The first step in conducting a cointegration analysis is to test for the stationarity of each price series. The first one is the Augmented Dickey-Fuller (ADF) test used to test whether a series is non-stationary (i.e., it has a unit root) (Enders 1995, page 225). The null hypothesis under this test is that the series has a unit root. This test assumes that there is no correlation among the residuals of the model.
To account for serial autocorrelation, Phillips and Perron proposed another test that relaxes this assump-tion and incorporates non-parametric adjustment to the
ADF statistics (Hamilton 1994, pages 506-512). One limitation of the Phillips-Perron (PP) test is that it has been shown to frequently reject the null hypothesis of a unit root when this hypothesis is true (Enders 1995, page 242).
10 20 30 40 50 60 70 80 90
U
S
D
/m
3
US Southeast US Northwest Canada East Canada West
10 20 30 40 50 60 70 80 90
U
S
D
/m
3
Norway Sweden Finland Germany
10 20 30 40 50 60 70 80 90
U
S
D
/m
3
Brazil Chile
New Zealand Australia
10 20 30 40 50 60 70 80 90
U
S
D
/m
3
France Spain
Figure 1: Coniferous pulpwood delivered nominal prices 1988 Q1-2012 Q3, in USD/m3
Given the data used in this research, the most appro-priate approach appears to be the ADF-GLS test be-cause this test corrects the ADF test for possible cor-relation in the residuals. Furthermore, the ADF-GLS test performs better than the PP test in large samples (Hayashi 2007, page 603). The data set used in this research is considered large, because it includes 99 quar-terly observations. For these reasons, we selected the ADF-GLS test in this analysis.
The Akaike Information Criterium (AIC) and Schwartz, or Bayesian Information Criterium (SBIC), were used to select the number of lags to include in the ADF and PP tests, and SBIC was used to select the lags to include in ADF-GLS tests. The SBIC was pre-ferred to the AIC when results differed, as it has better asymptotic properties than the AIC (Hayashi 2007, page 603). Prices were converted to logarithms to eliminate large variations in the price series. First, the series were
tested for stationarity using ADF, PP, and ADF-GLS tests. The series were tested assuming a trend and a constant, and only a constant. The results are reported for nominal prices in USD without a trend and a con-stant. The results for real prices in USD are mentioned in the text when these results differed from the ones ob-tained for nominal price series. Real prices are relevant because some of the analyzed countries have experienced high inflation during the period of the analysis, which may have distorted price trends.
In order to estimate a VECM, Johansen’s approach maximizes the likelihood function of the system of equa-tions subject to the restricequa-tions that there are r coin-tegration vectors, with r denoting any natural number. The restriction is implemented by using the fact that the order of cointegration is the rank ofπ=αβ’, whereα
10 20 30 40 50 60 70 80 90 100
U
S
D
/m
3
US Southeast US Northwest Canada East
10 20 30 40 50 60 70 80 90 100
U
S
D
/m
3
Sweden Finland Germany
10 20 30 40 50 60 70 80 90 100
U
S
D
/m
3
Brazil Chile Australia
10 20 30 40 50 60 70 80 90 100
U
S
D
/m
3
France Spain
Figure 2: Augmented Dickey Fuller General Least Squares (ADF-GLS) unit root tests for coniferous pulpwood nominal prices, in USD
can be estimated as the following VECM (adapted from Juselius 2006, page 116):
∆yt = αβ 0
yt−1+ Γ1∆yt−1+ Γ2∆yt−2+
+. . .+ Γk−1∆yt−k+1+C+Dt+εt
where:
t= 1, . . . T is the time period
kis the lag length
yt is a (px1) vector of variables
β is the (pxr) cointegration vector
α is the (p x r) loading matrix, which measures how
yt changes to “correct” the error, or the deviation from
the long-run relation
Γi is a (pxp) matrix of parameters
C is a (p x1) vector of constants
Dt is a (px1) vector of seasonal dummies
εtis a (p x1) vector of white noise errors
Johansen proposed five alternative model specifica-tions to test for cointegration: (1) a model with no de-terministic trend; (2) a model with no linear trend and with an intercept; (3) a model with no linear trend and with an unrestricted constant; (4) a model with a lin-ear trend but without constant; and (5) a model with unrestricted constant and a unrestricted trend (Juselius 2006, pages 136-138).
The LOP holds if in a system of p prices there exist p-1 cointegrating vectors meaning that the p markets follow one common trend. If there are fewer than p-1
the p series are cointegrated, second they are cointe-grated inp-1 vectors, meaning that there is a long-term relationship among them, third, that theβ vector could be normalized in order to have two variables with equal magnitude and opposite sign, implying that the prices move together in the long-term.
There are two cointegration tests to choose from: the trace test and the maximum eigenvalue test (Johansen 1988; Johansen and Juselius 1990). The difference be-tween these two tests is the alternative hypothesis used. The trace test can be written as follows:
H0:r=r, r < p , HA:r=p
where:
H0 is the null hypothesis
HA is the alternative hypothesis
ris the number of cointegrating vectors that under the null hypothesis is equal tor
The trace test statistics is defined as follows (adapted from Enders 1995, page 391):
−T
n
X
i=r+1
log 1−λbi
where T was previously defined. Thebλi are the
eigen-values of the matrixπand are indicators of the relation-ship between the long-term part of the equation and the stationary part (Juselius 2006, page 132).The maximum eigenvalue test has the following null and alternative hy-pothesis:
H0:r=r, r < p, HA:r=r+ 1
where terms are defined as in Equation (2).
The maximum eigenvalue statistics is defined as fol-lows (adapted from Enders 1995, page 391):
−Tlog 1−bλr+1
where terms are defined as in Equation (2).
The adjustment and cointegrating coefficients can be normalized by setting them to one in order to interpret the system of cointegrating equations. A likelihood test is conducted to test the validity of the restrictions im-posed. Thisχ2 test hasr degrees of freedom and
com-pares the restricted and the unrestricted models and dis-tributions.
In order to conduct the cointegration analysis of the pulpwood prices, the data were grouped according to three criteria: (1) region, (2) trade volume and direc-tion, and (3) production volume. Regional groupings were defined by the continent to which they belong: Eu-rope, North America, South America, and Oceania. For Europe, two groups were defined, the first one included
all the European countries in the database–Germany, Spain, France, Sweden, Norway, and Finland– while the second included only Germany, Sweden, Norway, and Finland. The groups were called Europe I and Eu-rope II, respectively. The roundwood prices in Scan-dinavian countries –Sweden, Norway, and Finland– and Germany have been previously analyzed (M¨aki-Hakola 2002; Toivonen et al. 2002). Therefore, the Europe II group was created to compare the results from the cur-rent research with the previous ones.
The trade groupings were defined by the share of each market in the global pulpwood exports in USD from 1997 to 2010 by country of origin. A market had to have at least a 5 % share in global trade to be included in this group. Only coniferous producers fulfilled this criterion. The countries that export to China, Japan and Korea were Australia, Canada, New Zealand, the US and Chile. Brazil was not considered in the analysis because it has experienced the instances of hyperinfla-tion and currency changes which might have altered the results. The production groupings were defined by the share of each country in coniferous and non-coniferous global production.
Finally, based on the results of these cointegration tests, pairwise cointegration was tested for selected countries. In the regional groupings, a dummy variable was included to analyze the effects of the introduction of the Euro (EUR) in 2002. The variable to account for the introduction of the EUR was defined as follows:
DEuro=
1, time >2001Q4
0, otherwise
4
Results and discussion
4.1 Unit root tests For coniferous pulpwood nom-inal prices, the ADF-GLS test could not reject the null hypothesis of a unit root for all the series, except for the US Northwest prices were the hypothesis was rejected at 5% (Table 5). The series were differentiated and tested for unit root, including the US Northwest series. All the series were stationary in first differences at 5%, meaning that they are integrated of order one, hereafter referred as I(1). The null hypothesis of a unit root could not be rejected for coniferous pulpwood real prices.
Table 5: Augmented Dickey Fuller General Least Squares (ADF-GLS) unit root tests for coniferous pulp-wood nominal prices, in USD
Pulpwood Market
SBIC Levels First differ-ences
US Southeast 1 -0.62 -7.23*
US Northwest 1 -2.14** -2.43**
Canada East 1 -0.18 -4.20*
Canada West 2 -2.06 -4.82*
France 1 -1.89 -2.18**
Germany 1 -1.98 -6.26*
Spain 4 -2.20 -5.27*
Sweden 2 -2.01 -5.17*
Finland 2 -2.13 -4.92*
Norway 2 -1.90 -6.19*
New Zealand 2 -0.78 -5.24*
Australia 1 -1.18 -7.06*
Brazil94 1 -0.12 -5.13*
Chile 2 -0.14 -3.55*
Notes: (1) SBIC= Schwartz-Bayesian Criteria, (2) *significant at 1%, **significant at 5%, ***significant at 10%
the unit root at 10% but the results have to be taken cautiously.
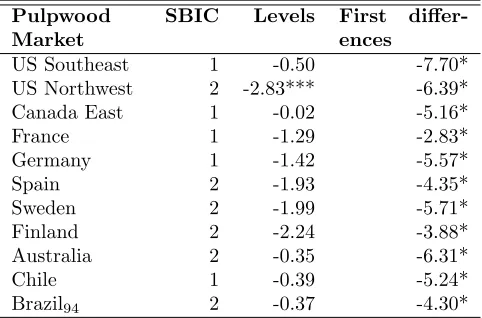
Furthermore, non-coniferous pulpwood real prices ex-pressed in USD were tested for unit root. Results were similar to the results in nominal prices. The series were differentiated, and the unit root tests results showed that the null hypothesis of a unit root was rejected for all series. Therefore, non-coniferous prices series are I(1), both for nominal and real prices in USD.
4.2 Cointegration analyses Since the analyses were inconclusive as to whether there was a linear trend in the model, a model with a constant and without a trend and a model with a constant and a trend were specified. Only results for a model with a constant and without a trend are presented as the results for both specifications were similar.
Regional groupings For the coniferous dataset the countries were grouped by region. Europe I grouping in-cluded the following countries: Germany, Spain, France, Sweden, Finland, and Norway. The results of the trace test for coniferous pulpwood nominal prices in USD in-cluding the variable DEuro indicated that the hypoth-esis of one cointegrating vector could not be rejected at 1%, and the maximum eigenvalue tests yielded the same result (Table 7). The results were similar when using real prices in USD. When the variableDEuro was not included, the hypothesis of one cointegrating vector
Table 6: Augmented Dickey Fuller General Least Squares (ADF-GLS) unit root tests for non-coniferous pulpwood nominal prices, in USD
Pulpwood Market
SBIC Levels First differ-ences
US Southeast 1 -0.50 -7.70*
US Northwest 2 -2.83*** -6.39*
Canada East 1 -0.02 -5.16*
France 1 -1.29 -2.83*
Germany 1 -1.42 -5.57*
Spain 2 -1.93 -4.35*
Sweden 2 -1.99 -5.71*
Finland 2 -2.24 -3.88*
Australia 2 -0.35 -6.31*
Chile 1 -0.39 -5.24*
Brazil94 2 -0.37 -4.30*
Notes: (1) SBIC= Schwartz-Bayesian Criteria, (2) *significant at 1%, **significant at 5%, ***significant at 10%
was rejected at 1% under the trace test and under the maximum eigenvalue test. This result suggests that the introduction of the EUR had an effect on the long-term dynamics of pulpwood prices. The LOP did not hold for coniferous pulpwood prices of the group Europe I be-cause a necessary condition of four cointegrating vectors for the five series was not met. Therefore, in Europe there is not a single pulpwood market.
Subsequently, the coniferous pulpwood prices of Nor-way, Sweden, Finland, and Germany (Europe II) were tested for cointegration. The null hypothesis of one coin-tegrating vector could not be rejected at 1% under the maximum eigenvalue and the trace tests. The LOP did not hold because the first necessary condition was to find three cointegrating vectors for the four series. In real price terms, results also showed that the series were coin-tegrated in one cointegrating vector. A previous study had suggested that Finnish and German pulpwood mar-kets were cointegrated for the period 1994-2001 (M¨ aki-Hakola 2002). Another study had shown that Finnish and Swedish pulpwood markets analysis yielded differ-ent results depending on the species analyzed. While the LOP held for spruce pulpwood prices, for pine pulpwood prices only held when Finnish prices were regressed on Swedish prices. These results should be taken cautiously because the study was conducted using only 18 annual observations (Toivonen et al. 2002).
Table 7: Cointegration tests for coniferous pulpwood nominal prices regional groupings, in USD
Maximum rank
Trace statistic
Critical value Maximum eigen-value statistic
Critical value
5% 1% 5% 1%
Europe I: Germany, Spain, France, Sweden, Finland, Norway (1)
0 119.59 94.15 103.18 45.14 39.37 45.10
1 74.45∗ 68.52 76.07 28.74 33.46 38.77
2 45.71∗∗ 47.21 54.46 20.30 27.07 32.24
3 25.41 29.68 35.65 12.32 20.97 25.52
4 13.10 15.41 20.04 7.31 14.07 18.63
5 5.79 3.76 6.65 5.79 3.76 6.65
Europe II: Norway, Sweden, Finland, Germany (1)
0 65.90 47.21 54.46 33.38 27.07 32.24
1 32.51∗ 29.68 35.65 18.65 20.97 25.52
2 13.86∗∗ 15.41 20.04 9.38 14.07 18.63
3 4.48 3.76 6.65 4.48 3.76 6.65
North America: US, Canada (1)
0 59.00 47.21 54.46 41.38 27.07 32.24
1 17.62∗ 29.68 35.65 10.43 20.97 25.52
2 7.18 15.41 20.04 6.29 14.07 18.63
3 0.90 3.76 6.65 0.90 3.76 6.65
South America: Chile, Brazil94(1)
0 10.29∗ 15.41 20.04 9.07 14.07 18.63
1 1.22 3.76 6.65 1.22 3.76 6.65
Oceania: Australia, New Zealand (2)
0 12.36∗ 15.41 20.04 8.76 14.07 18.63
1 3.60 3.76 6.65 3.60 3.76 6.65
(1) The number of lags used is in parenthesis, (2)*significant at 1%, **significant at 5%, ***significant at 10%
the necessary condition of three cointegrating vectors did not hold.
The fourth region analyzed was South America which included the two most important producers, Brazil and Chile. In this group, from the first quarter of 1994 to the third quarter of 2012, coniferous pulpwood prices in nominal and real USD were not cointegrated. Therefore, the LOP did not hold.
The fifth group analyzed was Oceania, which included New Zealand and Australia. Like prices in South Amer-ica, coniferous pulpwood nominal prices in Oceania were not cointegrated, and similar results held for real prices. The LOP did not hold. However, while in New Zealand pulpwood prices have been traded in open markets, in Australia they have been set in long-term contracts until recently. This difference might have contributed to the different trend in pulpwood prices.
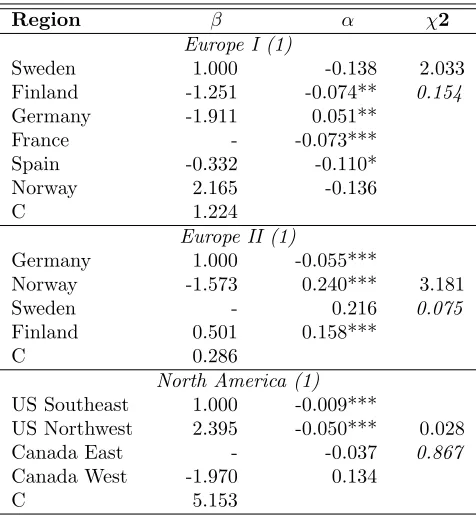
The estimates of the VECM were restricted to include only the significant long-term parameters, β, while the adjustments parameters, α, were not restricted (Table 8). For all the models, the test of overidentifying strictions did not reject the null hypothesis that the
re-strictions imposed were valid. The results for the group Europe I suggested that coniferous pulpwood nominal prices in Sweden, Finland, Germany, Spain, and Nor-way shared a long-term relationship in the period 1988-2012. All the prices move in the same direction in the long-term except for prices in Norway. French prices were not significant in explaining the model; therefore, a restriction was added to the cointegrating coefficient by setting it to zero. The estimated adjustment param-eters, α, indicated that the prices in Spain responded more than the other prices to changes in the system.
For the Europe II group, the estimated VECM sug-gested that coniferous pulpwood nominal prices of Ger-many, Norway, and Finland shared a long-run relation-ship. The results suggested that coniferous pulpwood nominal prices of Germany and Norway moved in the same direction in the long-term while Finnish prices did not. The estimated adjustment parameters,α, were not significant, except for the coefficient for Sweden.
Table 9: Cointegration tests for coniferous pulpwood nominal prices trade grouping, in USD
Maximum rank
Trace statistic
Critical value Maximum eigen-value statistic
Critical value
5% 1% 5% 1%
Exporting to China, Korea and Japan: US, Canada, New Zealand, Australia, Chile (1)
0 153.45 124.24 133.57 51.22 45.28 51.57
1 102.23∗ 94.15 103.18 41.74 39.37 45.1
2 60.48∗∗ 68.52 76.07 26.85 33.46 38.77
3 33.63 47.21 54.46 19.79 27.07 32.24
4 13.84 29.68 35.65 9.13 20.97 25.52
5 4.71 15.41 20.04 3.01 14.07 18.63
6 1.70 3.76 6.65 1.70 3.76 6.65
(1) The number of lags used is in parenthesis, (2)*significant at 1%, **significant at 5%, ***significant at 10%
Table 8: VECM estimates for coniferous pulpwood nom-inal prices regional groupings, in USD
Region β α χ2
Europe I (1)
Sweden 1.000 -0.138 2.033
Finland -1.251 -0.074** 0.154
Germany -1.911 0.051**
France - -0.073***
Spain -0.332 -0.110*
Norway 2.165 -0.136
C 1.224
Europe II (1)
Germany 1.000 -0.055***
Norway -1.573 0.240*** 3.181
Sweden - 0.216 0.075
Finland 0.501 0.158***
C 0.286
North America (1)
US Southeast 1.000 -0.009***
US Northwest 2.395 -0.050*** 0.028
Canada East - -0.037 0.867
Canada West -1.970 0.134
C 5.153
Notes: (1) The number of lags used is in parenthesis, (2)*sig-nificant at 1%, **sig(2)*sig-nificant at 5%, ***sig(2)*sig-nificant at 10%, (3) the p-value is in italics, (4) C=constant
Northwest, and Canada West. Furthermore, conifer-ous pulpwood nominal prices of the US Southeast and Canada West have a positive relation in the long-term. The adjustment coefficients were not significant for the US Southeast and the US Northwest prices. On the other hand, the Canada West adjustment coefficient was significant and indicated a response to changes in the system of prices. The results have to be considered
cau-tiously because the prices of US Northwest were non stationary in levels only at 5%.
Finally, in the regional grouping for non-coniferous pulpwood prices, the null hypothesis of non-cointegration could not be rejected for nominal prices in the groups analyzed, except for North America. Results are not reported here but are available upon request.
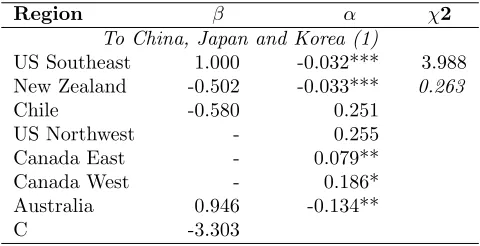
Trade grouping Coniferous pulpwood nominal prices in trade grouping were cointegrated in one vector at 5% and in two vectors at 1%, using the trace test and the maximum eigenvalue test (Table 9). Real prices were cointegrated at 1%. Therefore, the US Southeast, New Zealand, Chile, and Australia coniferous pulpwood nom-inal prices had a long-term relationship, but the LOP did not hold because the necessary condition of three cointegration vectors was not met.
The estimates of the VECM of the trade grouping was restricted to include only the significantβ parame-ters, while parametersαwere not restricted (Table 10). Our results indicated that the nominal prices of the US Southeast, New Zealand and Chile moved in same direc-tion in the long-term.
Production grouping Finally we run a cointegration analysis for a production group including. The produc-tion group included the US Southeast, US Northwest, Sweden, and Finland but the results were not substan-tially different from the previous results.
Table 11: Cointegration tests for coniferous pulpwood nominal prices pairwise grouping, in USD
Maximum rank
Trace statistic
Critical value Maximum eigen-value statistic
Critical value
5% 1% 5% 1%
Chile, New Zealand (1)
0 15.02* 15.41 20.04 13.54 14.07 18.63
1 1.48 3.76 6.65 1.48 3.76 6.65
Chile, US Southeast (2)
0 13.43* 15.41 20.04 7.83 14.07 18.63
1 5.60 3.76 6.65 5.6 3.76 6.65
Germany, Sweden (2)
0 26.80 15.41 20.04 21.72 14.07 18.63
1 5.07* 3.76 6.65 5.07 3.76 6.65
Germany, Norway (1)
0 25.59 15.41 20.04 21.28 14.07 18.63
1 4.31* 3.76 6.65 4.31 3.76 6.65
(1) The number of lags used is in parenthesis, (2)*significant at 1%, **significant at 5%, ***significant at 10%
Table 10: VECM estimates for coniferous pulpwood nominal prices trade grouping, in USD
Region β α χ2
To China, Japan and Korea (1)
US Southeast 1.000 -0.032*** 3.988
New Zealand -0.502 -0.033*** 0.263
Chile -0.580 0.251
US Northwest - 0.255
Canada East - 0.079**
Canada West - 0.186*
Australia 0.946 -0.134**
C -3.303
Notes: (1) The number of lags used is in parenthesis, (2)*sig-nificant at 1%, **sig(2)*sig-nificant at 5%, ***sig(2)*sig-nificant at 10%, (3) the p-value is in italics, (4) C=constant
pulpwood prices were cointegrated with prices in Sweden and Norway.
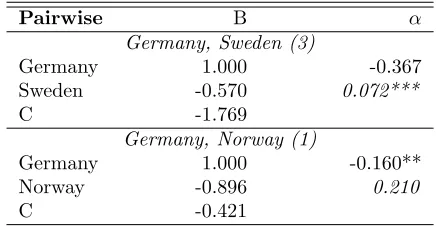
Based on these results, pulpwood prices in these coun-tries were tested for pairwise cointegration. First, re-sults indicated that coniferous pulpwood nominal prices of the US Southeast and Chile were not cointegrated (Table 11). Second, coniferous pulpwood prices in Chile and New Zealand were tested for cointegration because these two countries are important radiata pine pulpwood producers, so the prices could share a long-term rela-tionship. However, the prices were not cointegrated in nominal or in real terms. One of the factors that might explain these results are that pulpwood is consumed do-mestically, primarily in Chile. Third, coniferous pulp-wood nominal prices in Germany and Sweden were
coin-tegrated in one vector. Fourth, Germany and Norway coniferous pulpwood nominal prices were cointegrated in one vector.
The estimated VECMs showed that the LOP was close to holding between the prices in Germany and Norway because one cointegrating vector between the two series was found and also the long-term coefficients,β, were 1 and -0.896 (Table 12). Moreover, coniferous pulpwood prices in Sweden did not adjust fast to changes in prices in Germany. On the other hand, prices in Norway ad-justed to changes in prices in Germany.
Table 12: VECM estimates for coniferous pulpwood nominal prices pairwise groupings, in USD
Pairwise B α
Germany, Sweden (3)
Germany 1.000 -0.367
Sweden -0.570 0.072***
C -1.769
Germany, Norway (1)
Germany 1.000 -0.160**
Norway -0.896 0.210
C -0.421
Notes: (1) The number of lags used is in parenthesis, (2)*significant at 1%, **significant at 5%, ***signifi-cant at 10%, (3) the p-value is in italics, (4) C=constant
5
Conclusions
The results showed that the LOP did not hold for the pulpwood nominal prices when grouped by region, by level of production, or by direction of trade. For some selected pairs of countries results also indicated that the LOP did not hold with the exception of coniferous pulp-wood nominal prices in Germany and Norway. These results also hold for real prices. The implication of these results is that there appears to be no single worldwide pulpwood market.
However, results differed when coniferous pulpwood and non-coniferous pulpwood prices were considered. In the coniferous pulpwood groupings, countries that are located in the same region seemed to adjust their pulp-wood prices to the neighbors in the long-term while the short-term adjustments depend on the region analyzed. For example, in the group Europe II –Germany, Nor-way, Sweden, and Finland– coniferous pulpwood nomi-nal prices adjusted in the short term as well as in the long term to a long-term trend. Furthermore, countries that exported the majority of their coniferous pulpwood to common markets did not adjust their prices in the long term. Finally, the coniferous pulpwood producers shared a long-term common trend in the period of the analysis but only the prices of the US Northwest adjusted in the short-term to changes in the system of prices. In the non-coniferous pulpwood groupings, only one long-term relationship was identified. Prices of the largest produc-ers of non-coniferous worldwide –the US Southeast and Brazil– shared a long-term relationship.
These results can be potentially explained by pulp-wood market characteristics and economic changes that had occurred in the period 1988-2012. Regarding pulp-wood market characteristics, these markets turned to be not as competitive as initially thought. Pulpwood is mostly consumed within the country of production, and
these prices might be influenced more by local factors than by external factors. First, it appears that some markets are dominated by few firms which may enjoy a degree of market power. For example, in Chile the pulp-wood industry is dominated by two companies. Further-more, in the period 1988-2012, some countries had set their prices either through negotiations, such as Norway, Finland, and Sweden until the early 1990s, or through long-term contracts with the government such as in Aus-tralia. Regarding economic changes that occurred in the period, the most important events identified were the emergence of the common European currency, the EUR, in 2002, the change of currency in Brazil in 1994, and the hyperinflation in Brazil between 1990 and 1994. These changes might not have allowed the prices to return to a long-run equilibrium, if one existed.
For conducting the unit root tests, it appeared that the ADF-GLS was the most appropriate because of a large number of observations covering a longer time span. In testing for the LOP it appeared that the Jo-hansen method was the most appropriate as it captures the long-term as well as the short-term relationships. However, this method can be quite restrictive and it was rather difficult to confirm the three necessary conditions for the LOP to hold: (1) the prices to be cointegrated, (2) to findp-1 cointegrating vectors amongp variables, and (3) the long-term coefficients have to equal 1 and -1. Further, the analysis was conducted with delivered prices. It is possible that the LOP could have held for stumpage prices. But if stumpage prices followed similar trends but harvest and hauling costs did not, the LOP would not hold for delivered prices.
The limitations of this study are related to the high level of data aggregation. Typically, one price series is representative entire countries or large wood supply re-gions. We recognize that this high level of aggregation may be a limiting factor for the study as there are likely to specific trends among regions in the same country. However, these results can be considered as the first step in studying worldwide pulpwood markets.
References
Alves, D.C.O., R.C. Cati, and V.L. Fava. 2001. Pur-chasing power parity in Brazil: a test for fractional cointegration. Applied Economics 33(9):1175-1185.
Ardeni, P.G. 1989. Does the law of one price really hold for commodity prices? American Journal of Agricul-tural Economics 71(3):661-669.
Australian Bureau of Statistics. 2013. CPI. Available
at: URL http://www.abs.gov.au/ausstats/abs@
Buongiorno, J., and J. Uusivuori. 1992. The law of one price in the trade of forest products: co-integration tests for US exports of pulp and paper. Forest Science 38(3):539-553.
Canadian Forest Service. 2012. The state of Canadas forests: annual report 2012. Natural resources Canada, Canadian Forest Service, headquarters, Ot-tawa. 51 pp. Available at: URL http://cfs.nrcan. gc.ca/publications?id=34055. Last accessed: Au-gust 7, 2013.
Central Bank of Brazil. 2013a. Consumer price index. Available at: URL https://www3.bcb.gov.br/ sgspub/localizarseries/localizarSeries.do?
method=prepararTelaLocalizarSeries. Brazil.
Last accessed: May 8, 2013.
Central Bank of Brazil. 2013b. Exchange rate-free-United States dollar (purchase) - end
of period-3695. Available at: URL https:
//www3.bcb.gov.br/sgspub/consultarvalores/
telaCvsSelecionarSeries.paint. Brazil. Last
accessed: May 8, 2013.
Central Bank of Chile. 2013. Exchange rate (In Span-ish: Tipo de cambio). Available at: URL http: //www.bcentral.cl/estadisticas-economicas/
series-indicadores/index_p.htm. Chile. Last
accessed: May 8, 2013.
Department of Agriculture Fisheries and Forestry. 2013. Australias forest industry in the year
2020. Available at: URL http://www.daff.
gov.au/__data/assets/pdf_file/0009/643743/ 2020-report-final.pdf. Australia. Last accessed: May 8, 2013.
Department of Agriculture Fisheries and Forestry.
2014. Harvest. Available at: URL http:
//daff.gov.au/ABARES/pages/publications/ display.aspx?url=http://143.188.17.20/ anrdl/DAFFService/display.php?fid=pb_
afwpsd9able20131120_11a.xml. Australia. Last
accessed: March 11, 2014. Australia.
Deutsche Bundesbank. 2013a. Exchange rates on the Frankfurt exchange. Available at: URLhttp://www. bundesbank.de/Navigation/EN/Statistics/Time_ series_databases/Macro_economic_time_series/ its_details_properties_node.html?listId=www_ s331_b01011_2&tsId=BBK01.WU5009 Germany. Last accessed: May 8, 2013.
Deutsche Bundesbank. 2013b. VPI. Available at:
URL http://www.bundesbank.de/SiteGlobals/
Forms/Suche_Statistik/EN/Statistiksuche_
Text_Formular.html. Germany. Last accessed:
August 18, 2013.
Elliott, G., T.J. Rothenberg, and J.H. Stock. 1996. Effi-cient tests for an autoregressive unit root. Economet-rica 64(4):813-836.
Elyakime, B., and A. Cabanettes. 2009. How to improve the marketing of timber in France? Forest Policy and Economics 11(3):169-173.
Enders, W. 1995. Applied econometric time series. John Wiley & Sons, Inc., United States of America. 433 pp.
FAO. 2010. Forest resources assessment (FRA). Avail-able at: URL http://www.fao.org/forestry/fra/ fra2010/en/. Last accessed: August 9, 2013. Food and Agricultural Organization (FAO).
FAO. 2013a. FAOSTAT-Forestry definitions.
Avail-able at: URL http://www.fao.org/forestry/
statistics/80572/en/. Last accessed: November 11, 2013.
FAO. 2013b. Production: pulpwood,round
&split (C and NC). Available at: URL
http://faostat.fao.org/DesktopDefault.aspx? PageID=626&lang=en#ancor. Last accessed: Decem-ber 27, 2013.
FAO. 2013c. World total industrial roundwood pro-duction, exports, and imports. FAOSTAT. Available at: URL http://faostat.fao.org/. Last accessed: February 9, 2014.
Frenkel, R., and M. Rapetti. 2010. A concise story of exchange rate regimes in Latin America. Center for Economics and Policy Research. Washington DC.
Goodwin, B.K. 1992. Multivariate cointegration tests and the law of one price in international wheat mar-kets. Review of Agricultural Economics 14(1):117-124.
Gorman, P. 2002. Log prices expectations and forest val-uations. NZ Journal of Forestry 47( 1):21-25.
Hamilton, J.D. 1994. Time series analysis. Princeton University Press, Princeton, New Jersey. 816 pp.
Hayashi, F. 2007. Econometrics. First Indian sub-continent edition. New Age International Publishers, New Delhi, India. 683 pp.
Instituto Nacional de Estadstica. 2013. CPI. Avail-able at: URL http://www.ine.es/jaxiBD/tabla. do. Spain. Last accessed: May 8, 2013.
Johansen, S., and K. Juselius. 1990. Maximum likelihood estimation and inference on cointegration with appli-cations to the demand for money. Oxford Bulletin of Economics & Statistics 52(2):169-210.
Johnson, T.G., J.W. Bentley, and M. Howell. 2011. The South’s timber industry - an assessment of tim-ber product output and use, 2009. United States De-partment of Agriculture. Forest Service. Southern Re-search Station. Resource Bulletin SRS–182.
Juselius, K. 2006. The cointegrated VAR model: methodology and applications. Oxford University Press Inc., New York. 457 pp.
Knetter, M.M. 1989. Price discrimination by U.S. and German exporters. American Economic Review 79(1):198-210.
Lignum. 2012. Sector in figures (in Spanish: Sector en cifras). December 2012, pages 77-79. Available at: URL www.lignum.cl. Chile. Last accessed: May 8, 2013.
Lundmark, R., and S. Shahrammehr. 2011. Sweden’s im-port substitution possibilities for roundwood. Scandi-navian Journal of Forest Research 26(2):146-153.
M¨aki-Hakola, M. 2002. Cointegration of the roundwood markets around the Baltic Sea. An empirical analy-sis of roundwood markets in Finland, Estonia, Ger-many and Lithuania. Pellervo Economic Research In-stitute Working Papers. Finland. 50 pp. Available
at: URL http://www.ptt.fi/dokumentit/tp55_
0711071357.pdf. Last accessed: September 15, 2013.
Marques, G.M. 2012. Wood price determinants to pulp production in Brazil (in Portuguese: Determinantes do Preo da Madeira para Produo de Celulose no Brasil). Master Thesis, University of Brasilia. 111 pp.
Miljkovic, D. 1999. The law of one price in international trade: a critical review. Review of Agricultural Eco-nomics 21(1):126-139.
Nagubadi, V., I.A. Munn, and A. Tahai. 2001. Inte-gration of hardwood stumpage markets in the South-central United States. Journal of Forest Economics 7(1):61-98.
National Institute of Statistics and Economic Stud-ies. 2013. Household consumer price index. Avail-able at: URL http://www.bdm.insee.fr/bdm2/ choixTheme.action?code=20. France. Last accessed: May 8, 2013.
Neilson, D., and R. Flynn. 2004. International pulpwood resource and trade review-2004. Vols. I and II. Pub-lishers: DANA/WRI.
Niquidet, K., and B. Manley. 2007. Price dynamics in the New Zealand log market. New Zealand Journal of Forestry 52 (3):4-9.
Nordic Family Forestry. 2013a. Norway. Available at: URL http://www.nordicforestry.org/facts/ Norway.asp#To. Norway. Last accessed: October 21, 2013.
Nordic Family Forestry. 2013b. Sweden. Available at: URL http://www.nordicforestry.org/facts/ Sweden.asp. Norway. Last accessed: May 8, 2013.
Nyrud, A.Q. 2002. Integration in the Norwegian pulp-wood market: domestic prices versus external trade. Journal of Forest Economics 8(3):213-225.
OECD. 2013. Monthly monetary and financial statistics (MEI) metadata: exchange rates (USD monthly aver-ages). Available at: URL http://stats.oecd.org/ Index.aspx?DataSetCode=MEI_FIN. Last accessed: July 3, 2013.
Ortu˜no P´erez, S.F. 2012. Economic structure of the for-est sector in Spain. (In Spanish: Estructura econmica del sector forestal en Espa˜na). Quebracho 20(1, 2):49-59.
St. Louis Federal Reserve. 2013. Consumer Price Index for All Urban Consumers. Available at: URL http://research.stlouisfed.org/fred2/series/ CPIAUCSL/downloaddata?cid=9. United States of America. Last accessed: May 8, 2013.
Statistics Canada. 2013. CPI. Available at: URLhttp: //www.statcan.gc.ca/start-debut-eng.html. Canada. Last accessed: May 8, 2013.
Statistics Finland. 2013. Consumer price index. Avail-able at: URLhttp://www.stat.fi/til/khi/index_ en.html. Finland. Last accessed: May 8, 2013.
Statistics New Zealand. 2013. Consumer price index. Available at: URL http://www.stats.govt.nz/ browse_for_stats/economic_indicators/CPI_ inflation.aspx. New Zealand. Last accesed: May 8, 2013.
Statistics Norway. 2013. Consumer price index. Avail-able at: URL http://www.ssb.no/en/forside; jsessionid=5ECEA5589631A402DDDDFEFCC66F53F2. kpld-as-prod11. Norway. Last accessed: May 8, 2013.
Statistics Sweden. 2013. Consumer price index.
Avail-able at: URL http://www.scb.se/default___
Størdal, S., and A.Q. Nyrud. 2003. Testing roundwood market efficiency using a multivariate cointegration estimator. Forest Policy and Economics 5(1):57-68.
Toivonen, R., A. Toppinen, and T. Tilli. 2002. Integra-tion of roundwood markets in Austria, Finland and Sweden. Forest Policy and Economics 4(1):33-42.
Toppinen, A. 1988. Econometric models on the Finnish roundwood market, University of Helsinki, Finnish Forest Research Institute, Finland. 52 pp.
Toppinen, A. 1998. Incorporating cointegration relations in a short-run model of the Finnish sawlog market.
Canadian Journal of Forest Research 28(2):291-298.
Wetzstein, M.E. 2005. Microeconomic theory: concepts & connections. South-Western, T. (ed.). Michael B. Mercier, USA. 822pp.
Yang, J., D.A. Bessler, and D.J. Leatham. 2000. The law of one price: developed and developing country mar-ket integration. Journal of Agricultural and Applied Economics 32(3):429-440.