Processing of above
/
below categorical spatial relations by
baboons (Papio papio
)
Delphine De´py *, Joe¨l Fagot, Jacques Vauclair
CNRS,Research Center for Cogniti6e Neurosciences,31,Chemin Joseph-Aiguier,13402Marseille Cedex20,France Received 20 July 1998; received in revised form 26 May 1999; accepted 1 June 1999
Abstract
Three video-formatted experiments investigated the categorization of ‘above’ and ‘below’ spatial relations in baboons (Papio papio). Using an identity matching-to-sample task, six baboons correctly matched line – dot stimuli based on the ‘above’ or ‘below’ location of the dot relative to the line (Experiment 1). Positive transfer of performance was then observed when the line – dot distance depicted in the sample stimulus differed from that of the two comparison stimuli (Experiment 2). Using a go/nogo procedure, two baboons were further trained to discriminate whether a ‘B’ character was displayed ‘above’ or ‘below’ a ‘3’ character (Experiment 3). After training, a positive transfer of performance was observed with the same type of stimuli depicted in different type fonts. Altogether, these results suggest that baboons may form conceptual representations of ‘above’ and ‘below’ spatial relations, and categorize visual forms on that basis. © 1999 Elsevier Science B.V. All rights reserved.
Keywords:Above/below categorical spatial relations; Baboons;Papio papio
1. Introduction
The processing of spatial relations has been widely examined in animals, particularly in the context of cognitive map studies (e.g. Gallistel, 1990; Poucet, 1993; Thinus-Blanc, 1996, for re-views). However, very few studies, are available on the mastery by animals of categorical spatial relations, such as the ‘above/below’ or ‘inside/
out-side’ relations, in a purely perceptual discrimina-tion task.
Herrnstein et al. (1989) showed that pigeons were unable to categorize stimuli composed of a closed curved and a dot, depending on whether the dot was inside or outside the curve. It was only after an effortful training procedure, during which the inside color of the curve was manipu-lated, that pigeons displayed a limited ability to sort novel curves according to the ‘inside – outside’ location of the dot. In another study, Kirkpatrick-Steger and Wasserman (1996) trained pigeons to discriminate line drawing stimuli made with two elementary shapes whose relative position varied (‘left’, ‘right’, ‘above’ and ‘below’ relations). The
* Corresponding author. Present address: Louvain Univer-sity, Cognitive Neuropsychology Department, Place du Cardi-nal Mercier, 10, B-1348 Louvain la Neuve, Belgium.
E-mail address:[email protected] (D. De´py)
discrimination performance was strongly con-trolled by the location of the component shapes relative to each other. In a species closer to hu-mans, Hopkins and Morris (1989) showed that two chimpanzees correctly discriminated if a short line was located ‘above’ or ‘below’ a longer parallel line, thus suggesting that this species can develop an ‘above/below’ concept. Although the positive results on pigeons (Kirkpatrick-Steger and Wasserman, 1996) and chimpanzees (Hopkins and Morris, 1989) suggest the use of abstract spatial concepts, these results must be considered with caution, as the authors did not check if the animals could transfer their abilities to either novel stimuli or show them in novel experimental contexts.
Hellige and Michimata (1989) and Kosslyn et al. (1989) examined performance of human partici-pants when evaluating distances and topological relations. Using stimuli made of a line and a dot, these studies suggested that two types of spatial representations are used in humans. Categorical representations are types of spatial representations that reduce spatial relations to broad equivalence classes, such as above/below classes, regardless of specific topographic properties. Coordinate repre-sentations specify the location of an object or a part of an object in a continuous scale, for instance in metric units. As observed by Quinn et al. (1994), it is important to differentiate representations of spatial relations from the categorical representa-tion of this same relarepresenta-tion. The former might be limited to stimulus situations in which it was originally established. The latter involves some forms of equivalence between stimuli of the same concept (e.g. the ‘above’ stimuli) despite changes in the specific location or identity of the objects. Categorical representation for the ‘above/below’ relation has been found in human infants under 1 year of age (Quinn, 1994; Quinn et al., 1994).
In a previous study (De´py et al., 1998), we demonstrated baboon’s ability to evaluate the dis-tance between line – dot stimuli of the Hellige and Michimata’s type (Hellige and Michimata, 1989). The aim of the present research was to extend our finding, by controlling if baboons can categorize line – dot stimuli on an ‘above/below’ basis. Three experiments were conducted. Using a matching-to-sample procedure, Experiment 1 demonstrates that
baboons can correctly match line – dot stimuli showing the same ‘above’ or ‘below’ spatial rela-tions. Experiment 2 shows a positive transfer of performance when the line – dot distance of the comparison stimuli and the sample differ from each other. Finally, Experiment 3 further demon-strates the ability of baboons to generalize ‘above/ below’ discrimination rules in a new experimental context, and with stimuli different from those of Experiments 1 – 2.
2. Experiment 1
2.1. Method
2.1.1. Subjects
Five wild-born 8-years-old baboons (Papio pa
-pio), three males (B03, B07 and B09) and two females (B06 and B08) were tested in this experi-ment. Initially wild-born, baboons lived in a social group in the animal facilities at the CNRS, Mar-seille, France. Subjects had previous experience with the setup and matching-to-sample procedure (Hopkins et al., 1993; De´py et al., 1997, 1998; Fagot et al., 1998), but were unfamiliar with line – dot ‘above/below’ problems.
2.1.2. Apparatus
The system comprised an experimental cage (68×50×72 cm) facing a joystick and a 14-inch color monitor driven by a PC-AT. The cage com-prised of a 8.7×8-cm view port 49 cm from the screen, and two symmetrical hand ports for joy-stick manipulation. The joyjoy-stick controlled the displacements of a cursor on the screen. At the base of the joystick, there was a touch sensitive pad (11.5×10.0 cm) which served to initiate the trials when the subject laid one hand on it. More-over, a food dispenser delivered 190 mg banana flavored food pellets inside the cage when correct responses were made.
2.1.3. General procedure
afterwards, a green circular cursor (0.5 cm in diameter) appeared in the centre of the monitor, along with a white 0.5×0.5-cm square-shaped fixation stimulus (FS) displayed either 1.5 cm above or below the cursor. Then, the subject was required to manipulate the joystick so as to place the cursor for 35 ms on FS This constraint was demonstrated to impose an effective fixation of the gaze on FS (Wilde et al., 1994).
Once the cursor was on FS, a sample stimulus appeared during 120 ms on the screen, at 3° of visual angle left or right from the FS. The vertical eccentricity of the sample varied across trials along six possible locations, so as to control for possible confounded cues, such as the rectangular framework provided by the sides of the monitor. Immediately after sample presentation, two comparison stimuli were displayed simulta-neously, one at the top, the other at the bottom of the screen. In each trial, the sample and the positive comparison stimulus were identical with respect to both the line – dot location and line – dot distance. The negative comparison stimulus de-picted the same line – dot distance as the sample, but the opposite line dot topological location. Thus, for instance, if the dot of the sample was 0.5 cm above the line, the dot of the negative comparison stimulus was located 0.5 cm below the line. The subject had to bring the cursor on the stimulus identical to the sample. A correct response was recorded and accompanied by the delivery of a food pellet. Incorrect responses gave rise to a low raucous tone, and a time-out ranging from 2 to 5 s. The inter-trial interval varied from one trial to the other, depending on the subjects’ readiness to initiate the forthcoming trial by lay-ing its hand on the touch pad. All along the experiment, stimulus presentation was controlled by a computer program written in Turbo Pascal 5.0.
2.1.4. Stimuli
Twenty yellow stimuli presented on a black background were used. Each stimulus consisted of a 3×0.2-cm horizontal line fitted with a dot (0.5 cm in diameter) which could either be above or below the line. For each dot location, the line – dot distance could be 0.5, 0.7, 0.9, 1.1, 1.3, 1.5,
1.7, 1.9, 2.1, or 2.3 cm (Fig. 1). At the viewing distance, 1 cm on the screen corresponded to 1° of visual angle. Thus, the size of the line – dot dis-tance could either be 0.5, 0.7, 0.9, 1.1, 1.3, 1.5, 1.7, 1.9, 2.1, and 2.3° of visual angle. All stimuli were isoluminant, as they were made of the same constitutive elements.
2.1.5. Training
Only two line – dot distances (0.5 and 2.3 cm) were used during training. A training session con-sisted in 120 trials in which the line – dot distance (0.5, 2.3) and the line – dot topological relation (above, below) were balanced. Trials were pre-sented in a random order for each session, and training sessions were repeated until baboons reached a learning criterion of 80% correct over 120 training trials. On average, baboons needed 3024 trials (range 1095 – 5696 trials) to reach the learning criterion of 80% of correct responses over 120 consecutive trials.
2.1.6. Testing
Monkeys performed four testing sessions of 120 trials each, two sessions a day during 2 consecu-tive days. Within a session, each stimulus of the set shown in Fig. 1 was displayed six times as the sample stimulus. The negative comparison stimu-lus always depicted the same line – dot distance as the sample, but the reversed line – dot location. The order of trial presentation was determined on a random basis prior to each session, and thus varied from session to session. As in the training sessions, the hemi-screen of sample presentation, and the location of the positive comparison stimu-lus on the screen were balanced within each session.
Table 1
Experiment 1: percentage of correct responses for each individ-ual and test sessiona
Session
Baboon Mean
2 3 4
1
B03 71.6 71.8 57.3 71.9 68.1
60.4 57.5 70.5
B06 63.9 63.1
55.5 62.3
63.4 63.8
B07 61.3
82.3
B08 84.2 80.2 84.2 82.7 65.6 83.3 76.0
B09 67.7 73.1
67.4 68.1
Mean 69.7 73.2 73.3
t 5.7 3.5 3.2 6.9 6.9
B0.05
p B0.05 B0.05 B0.01 B0.01
aItalicized characters indicate significant transfer of
perfor-mance, as indicated by a two-tailedx2-test atPB0.05. Positive
transfers of performance at the group level were determined by a two-tailedt-test comparing average performance to 50%.
stimuli, baboons show a positive transfer of per-formance when they are presented with the same type of line – dot stimuli depicting novel line – dot distances.
Although baboons correctly processed novel line – dot stimuli, it remains uncertain at this point if they processed the topological ‘above/below’ relation per se, or rather matched on the strict physical identity of the stimuli. Experiment 2 was aimed to test these two possibilities.
3. Experiment 2
Using a similarity matching-to-sample proce-dure, baboons were required to match, depending on the trials, either ‘above’ or ‘below’ relations, independently of the exact distance between the dot and the line. This task allows two possible
predictions. First, assuming that monkeys
matched the stimuli in Experiment 1 on a strict physical basis, then deterioration of performance should be observed in this task, because the sam-ple line – dot distance was no longer the same as that of the comparison stimuli. By contrast, per-formance was expected to remain high if an above – below abstract concept was used.
3.1. Method
3.1.1. Subjects, apparatus and stimuli
Experiment 2 used the same baboons, appara-tus and stimuli as in Experiment 1.
3.1.2. Procedure
The general procedure was the same as before, except that the line – dot distance depicted in the two comparison stimuli was different from that of the sample. Therefore, one important variable in this task is the distance difference (DD) between the sample and comparison stimuli. In this exper-iment, this difference could take any of the fol-lowing nine values: 0.2, 0.4, 0.6, 0.8, 1.0, 1.2, 1.4, 1.6, and 1.8° of visual angle.
Altogether, each subject received 576 trials, grouped in four consecutive sessions of 144 test trials each. Within a session, there was an equal number of trials for each of the nine DDs by 2.2. Results
Table 1 reports individual and group perfor-mance. Although some subjects failed to perform above chance for a limited number of sessions, they all significantly performed above chance at the first test session, and when the four sessions are considered altogether (Table 1). Moreover, when either each session is considered indepen-dently or the four sessions are considered alto-gether, performance at the group level is always significantly different from chance.
In a complementary analysis, we tested if per-formance could depend on the line – dot distance. For that purpose, a correlation was computed between the actual line – dot distance and corre-sponding average performance at the group level. This analysis revealed a non-significant relation between distance and performancer(8)=0.61, ns.
2.3. Discussion
position (above, below). All the other factors, such the position of the correct comparison stimu-lus on the screen, or the visual hemi-screen of sample presentation were balanced. Experiment 2 was carried out immediately after Experiment 1, and without any additional training.
3.2. Results
Data were analyzed following the same proce-dure as in Experiment 1. Individual percentages of correct responses are reported in Table 2. Compu-tation of two-tailedx2-tests demonstrated that all baboons performed above chance in every ses-sions, including in the first one (all PsB0.05). Moreover, performance at the group level was significantly above chance in each session (t-test,
PB0.05, Table 2).
We also verified if performance could depend on DD. Thus, individual performance for each DD was averaged across subjects, and a Pearson product moment correlation was computed be-tween DD and performance at the group level. This analysis revealed a positive and significant correlation (r=0.82,PB0.05) between these two
variables (Fig. 2), showing that performance im-proved with the larger distance-differences.
3.3. Discussion
This experiment extends the findings of Experi-ment 1. It demonstrates that baboons can
success-fully match ‘above’ or ‘below’ stimuli, regardless of variations in line – dot distances. The good per-formance achieved in this task suggests that ba-boons did not match the line – dot stimuli on a strict physical basis, but referred to some forms of conceptual representations of the ‘above’ and ‘be-low’ relations.
4. Experiment 3
In the two previous experiments, stimuli dif-fered only in line – dot distance and line – dot topo-logical spatial relations. In this last experiment, a greater variability was introduced in the stimulus set, in order to test if the ‘above/below’ categori-cal procedures can be used with a different set of stimuli.
This experiment took advantage of our previ-ous study (Vauclair and Fagot, 1996) suggesting the used of open-ended categorization rules in baboons. In this study, two of the baboons of Experiments 1 – 2 were trained in a symbolic matching-to-sample task with 21 different fonts of the characters ‘B’ and ‘3’ as sample forms. After training, baboons proved able to respond above chance to novel fonts of the same two alphanu-meric characters. Moreover, performance
re-mained above chance in an identity
matching-to-sample task, in which stimuli belong-ing to the same category had to be discriminated from each other. In brief, this study demonstrated that baboons perceived the type fonts as different, but could still sort the (perceptually different) ‘3’ and ‘B’ stimuli in two categories.
The same two baboons and stimulus sets as in Vauclair and Fagot (1996) were used in the present experiment. The stimuli were made by randomly selecting a ‘3’ and a ‘B’ from each stimulus set, and presenting these two forms, one above the other. Therefore, compound stimuli differed in both type fonts, and in the way the ‘B’ and ‘3’ were presented (the ‘B’ is either above or below the ‘3’).
The size of the compound stimuli prevented the use of the same matching-to-sample form as be-fore. A go/nogo procedure was thus adopted in Experiment 3. Because only one compound
stimu-Table 2
Experiment 2: percentage of correct responses for each individ-ual and test session
Baboon Session Mean
1 2 3 4
66.7 73.5
B03 81.0 90.4 77.9
77.8
80.6 81.4
75.2 92.0
B06
B07 67.4 75.3 68.4 5.7 74.2
B08 85.4 92.2 93.6 88.4 89.9 B09 70.8 77.8 70.0 81.5 75.0
73.8 77.9
Mean 78.1 87.5 79.7
10.4 6.72 17.2 16.2 20.6
t
B0.01 B0.01 B0.01 B0.01
Fig. 2. Correlation between percentage of correct responses and distances difference in Experiment 2.
lus was presented at a time on the monitor screen, that procedure allowed variations in the actual location of the compound stimuli on the screen, thus controlling for possible biases induced by the sides of the monitor.
4.1. Method
4.1.1. Subjects and apparatus
B03 and B07 served as subjects in this experi-ment. The apparatus was identical to the one used in Experiments 1 – 2.
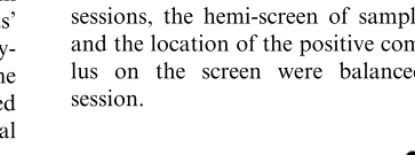
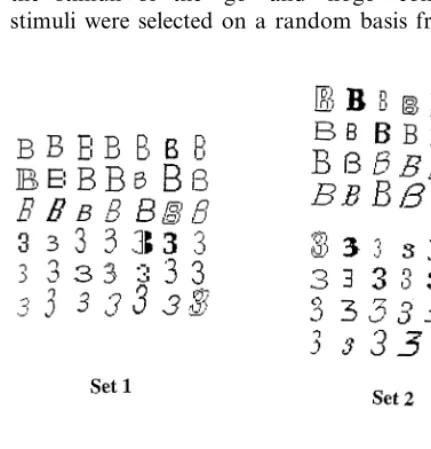
4.1.2. Stimuli
They consisted of a ‘B’ character depicted either above or below a ‘3’ character. The ‘B’ and ‘3’ characters had a maximal size of 3×3 cm each, and were yellow. There were two sets of stimuli.
Set 1 comprised 21 ‘3’ and 21 ‘B’, all depicted in different fonts. It was used for training. Set 2 comprised 25 ‘3’ and 25 ‘B’ different from each other, and different from those in set 1. It was used for testing. Sets 1 and 2 comprised the same list of forms as used by Vauclair and Fagot (1996) (Fig. 3).
4.1.3. Procedure
the matrix, with the constraint that the same cell was never used more than three times in succes-sion. After stimulus display, baboons were re-quired to move the joystick in any direction (‘go’ trial) if the ‘3’ was above the ‘B’, or to refrain from responding (‘no – go’ trial) if the ‘3’ was below the ‘B’. Baboons were food reinforced after each correct go or no – go response, and received time out of 5 – 10 s during which the color screen turned green, when they made an error.
4.1.4. Training
A total of 440 different training compound stimuli were created for each category (i.e. ‘go’ and ‘nogo’), resulting in a total of 880 compound forms. Training stimuli comprised one randomly selected ‘B’ character from set 1, that was dis-played either above or below a randomly selected ‘3’ character from the same set. Each training session consisted in 60 ‘go’ and ‘60’ nogo trials presented in a random order. Within each session, the stimuli of the ‘go’ and ‘nogo’ compound stimuli were selected on a random basis from the
two sets of 440 compound forms. Training contin-ued until subjects performed 80% correct or more in a session.
4.1.5. Testing
The testing phase used character set 2 which comprised 25 ‘B’, and 25 ‘3’ different from those of set 1 (Fig. 3). The two lists of characters were combined to create 480 ‘go’ and 480 ‘nogo’ stim-uli, following the same rule as for the training stimuli. Each baboon received eight testing ses-sions, each comprising 60 ‘go’ and 60 ‘nogo’ trials presented in a random order. Each compound form was only presented once during the test.
4.2. Results
B03 reached the training criterion after 2308 training trials. B07 learned faster and needed 840 training trials. During testing, B03 performed 94.7% correct, and B07 performed 91% correct. For both subjects, performance during the test was significantly above chance (x2-test, PB0.05).
4.3. General discussion
The three experiments reported here have ex-amined, with a video formatted task, the ability of Guinea baboons to categorize ‘above’ and ‘below’ topological relations depicted in several types of stimuli. Experiments 1 – 2 have used identical stim-uli made of a dot and a line located at various distances one from the other. Using this kind of stimuli prevents monkeys to solve the task by luminance matching, or to rely on non-related configural cues for responding (Green, 1983; Lombardi et al., 1984; De´py et al., 1998).
Experiment 1 showed that baboons were able to match physically identical ‘above’ or ‘below’ line – dot stimuli, in spite of variations in the distance separating the line and the dot. Experi-ment 2 further demonstrated accurate ‘above/ be-low’ categorization, even when the distance depicted in the sample stimulus differed from that of the positive comparison stimulus. Experiment 3 extended the findings of Experiments 1 – 2. In this experiment, the dot and the line were each
placed with one object selected from two classes of objects, for which baboons previously showed accurate intra- and inter-class discrimination (Vauclair and Fagot, 1996). Because objects be-longing to the same class were perceived as dif-ferent by these monkeys, this situation was suitable for constraining subjects to solely con-sider the topological relations between the two exemplars of each category, independently of their specific configural or local aspects. Results unambiguously demonstrated that the baboons could indeed process ‘above’ and ‘below’ rela-tion between these two classes of visual objects. Altogether, this study complements the previous findings on pigeons (Herrnstein et al., 1989; Kirkpatrick-Steger and Wasserman, 1996) and chimpanzees (Hopkins and Morris, 1989), and it suggests that animals may form conceptual representations of ‘above’ and ‘below’ spatial relations (see also De´py et al., 1998 for the demonstration that baboons can evaluate other spatial relations, such as distances). This ability appears to be present in monkeys, even though they have no tools to label them. In this respect, our findings are congruent with studies on human participants for which the mastery of such spatial relations appears to be in-dependent of language abilities in intact sub-jects (Hellige, 1997), in infants (Quinn et al.,
1994) and in lesionned patients (Laeng,
1994).
Acknowledgements
D. De´py was supported by the ‘Ministe`re de la Recherche et de l’Enseignement Supe´rieur’ and by a grant from the Lilly Foundation. Technical assistance was provided by B. Ar-naud, M. Chiambretto, and R. Fayolle. M. Martin and J. Martin-Malivel are acknowledged for their help in training the baboons. This pa-per was revised when J. Fagot was a visiting scientist at the Language and Intelligence De-partment of the Primate Research Institute,
Ky-oto University under a CNRS-JSPS joint
program.
References
De´py, D., Fagot, J., Vauclair, J., 1997. Categorisation of three-dimensional stimuli by humans and baboons: search for prototype effects. Behav. Processes 39, 299 – 306. De´py, D., Fagot, J., Vauclair, J., 1998. Comparative
assess-ment of distance processing and hemispheric specialization in humans and baboons (Papio papio). Brain Cogn. 38, 165 – 182.
Fagot, J., Kruschke, J., De´py, D., Vauclair, J., 1998. Associa-tive learning in baboons and humans: species differences in learned attention to features. Anim. Cogn. 1, 123 – 133. Gallistel, C.R., 1990. The Organization of Learning. MIT
Press, Cambridge, MA.
Green, S.L., 1983. Feature memorization in pigeon concept formation. In: Commons, M.L., Herrnstein, R.H., Wag-ner, A.R. (Eds.), Quantitative Analyses of Behavior (Vol. 4): Discrimination Processes. Ballinger, Cambridge, MA, pp. 20 – 229.
Hellige, J.B., 1997. Hemispheric asymmetries for components of spatial processing. In: Christman, S. (Ed.), Cerebral Asymmetries in Sensory and Perceptual Processing. El-sevier, Amsterdam, pp. 83 – 124.
Hellige, J.B., Michimata, C., 1989. Categorization versus dis-tance: hemispheric differences for processing spatial infor-mation. Memory Cognition 17, 770 – 776.
Herrnstein, R.J., Vaughan, W. Jr, Mumford, D.B., Kosslyn, S.M., 1989. Teaching pigeons an abstract relational rule: insideness. Perception Psychophys. 46, 56 – 64.
Hopkins, W.D., Morris, R.D., 1989. Laterality for visual-spa-tial processing in two language trained chimpanzees. Be-hav. Neurosci. 103, 227 – 234.
Hopkins, W.D., Fagot, J., Vauclair, J., 1993. Mirror-image matching and mental rotation problem solving by baboons (Papio papio): unilateral input enhances performance. J. Exp. Psychol. Gen. 122, 61 – 72.
Kirkpatrick-Steger, K., Wasserman, E.A., 1996. The what and the where of the pigeon’s processing of complex visual stimuli. J. Exp. Psychol. Anim. Behav. Processes 22, 60 – 67.
Kosslyn, S.M., Koenig, O., Barrett, A., Cave, B.C., Tang, J., Gabrieli, J.D.E., 1989. Evidence for two types of spatial representations: hemispheric specialization for categorical and coordinate relations. J. Exp. Psychol. Hum. Perception Performance 15, 723 – 735.
Laeng, B., 1994. Lateralization of categorical and coordinate spatial functions: a study of unilateral stroke patients. J. Cogn. Neurosci. 6, 189 – 203.
Lombardi, C.M., Fachinelli, C.C., Delius, J.D., 1984. Oddity of visual patterns conceptualized by pigeons. Anim. Learn. Behav. 12, 2 – 6.
Poucet, B., 1993. Spatial cognitive maps in animals: new hypotheses on their structure and neural mechanisms. Psy-chol. Rev. 100, 163 – 182.
Quinn, P.C., Cummins, M., Kase, J., Martin, E., Weissman, C., 1994. Development of categorical representations for above and below spatial relations in 3- to 7-month-old infants. Dev. Psychol. 32, 942 – 950.
Thinus-Blanc, C., 1996. Animal Spatial Cognition. World Scientific, Singapore.
Vauclair, J., Fagot, J., 1996. Categorization of alphanumeric characters by Guinea baboons: within- and between-class stimulus discrimination. Curr. Psychol. Cogn. 15, 449 – 462. Wilde, J., Vauclair, J., Fagot, J., 1994. Eye movements in baboons performing a matching-to-sample task presented in a divided-field format. Behav. Brain Res. 63, 61 – 70.