OncoTargets and Therapy
Evaluation of therapeutic effect
of tumor-targeted therapy
Xiao-fen Li1
Mo-dan Li1
Hong Shen1
Xue-feng Fang1
Pin-tong Huang2
Ying Yuan1
1Department of Medical Oncology, 2Department of Ultrasonography,
Second Affiliated Hospital, Zhejiang University School of Medicine, Hangzhou, Zhejiang, China
Correspondence: Yuan Ying Department of Medical Oncology, Second Affiliated Hospital, Zhejiang University School of Medicine, 88 Jie-Fang Road, Hangzhou, Zhejiang, 310009, China Tel +86 571 8778 4795
Fax +86 571 8776 7088 Email yuanying1999@zju.edu.cn
Abstract: The response evaluation criteria in solid tumors, which are based on tumor size alone, are the most frequently used and effective criteria by which to evaluate the tumor response to chemotherapy. However, the mechanism of tumor-targeted drugs is different from traditional cytotoxic drugs. Tumor-targeted drugs are designed to interfere with specific aberrant biological pathways involved in tumorigenesis. For this reason, the response evaluation in solid tumors is not adequate for the evaluation of targeted therapy. Molecular and functional imag-ing techniques such as dynamic contrast-enhanced perfusion computed tomography, dynamic contrast-enhanced magnetic resonance imaging, dynamic contrast-enhanced ultrasound, and fluorodeoxyglucose-positron emission tomography can reflect tumor blood flow and cellular metabolic changes directly, and are being used more frequently for the evaluation of targeted therapies. This article gives an overview of some of the new computed tomography criteria and the commonly used methods of targeted therapy evaluation.
Keywords: evaluation of therapeutic effect, targeted therapy, tumor
Introduction
There are dozens of tumor-targeted drugs used in cancer patients since the first targeted
drug rituximab came on the market in the US.1 Targeted therapy means interfering
with the aberrant biological behavior of tumors at the molecular level, and suppress-ing tumor growth, and even killsuppress-ing tumor cells as a result. Tumor-targeted drugs can interact with specific biomacromolecules on the membrane of tumor cells or inside the tumor cell. In this way, the drugs can restrain the growth and metastasis of tumor cells
and even induce apoptosis, while only minimally influencing the normal cells.2 This
varies significantly from the traditional cytotoxic effects of standard chemotherapy. Thus, volume alone cannot indicate all the changes of the tumor after using targeted
drugs directly and timely, especially metabolic changes of tumor cells.3 The World
Health Organization (WHO) criteria4 for tumor evaluation and the Response Evaluation
Criteria in Solid Tumors (RECIST)5 are widely applied and well-accepted in the
evalu-ation of chemotherapy.3 Both methods are based on the assessment of the size of the
primary or metastatic tumors. As discussed above, these methods are not adequate for the evaluation of targeted therapy. But there are several new criteria and imaging techniques emerging in this field.
Computed tomography (CT)
CT is the most commonly used imaging technique in oncology since it is widely
avail-able, fast, and convenient. It is also the major technique in RECIST criteria5 (Table 1).
Dove
press
R E v i E w
open access to scientific and medical research
Open Access Full Text Article
OncoTargets and Therapy downloaded from https://www.dovepress.com/ by 118.70.13.36 on 26-Aug-2020
For personal use only.
Number of times this article has been viewed
This article was published in the following Dove Press journal: OncoTargets and Therapy
CT can provide high anatomical resolution, and, by using the Hounsfield units (HU), it gives information about tissue density. Recently, some new CT response criteria have been developed in targeted therapy, such as the Choi criteria.
The application of imatinib has prolonged the median survival time (MST) of advanced gastrointestinal stromal
tumor (GIST) patients from 19 months to 57 months.6 In the
early studies of imatinib, such as B222, RECIST criteria were used to evaluate the tumor response. However, researchers found limitations in the use of the RECIST criteria, which are based on tumor size alone. RECIST criteria typically underestimates the clinical benefits of imatinib; therefore, it cannot reflect the quality of life and survival state of patients
adequately and comprehensively.7 In 2004, the American
radiologist Haesun Choi et al found that tumor density measurement was a good indicator and provided a reliable
quantitative means of monitoring the tumor.8 They developed
new CT response criteria for the evaluation of imatinib in
GIST patients, referred to as the Choi criteria9,10 (Table 1).
The sensitivity of the Choi criteria was demonstrated to be similar to fluorodeoxyglucose-positron emission tomography (FDG-PET) in their study. Additionally, it is promising in early response evaluation and in predicting the long-term prognosis in patients with advanced GIST treated with
imatinib.10,11
Though Choi criteria have been shown to be more appro-priate than RECIST criteria for the evaluation of imatinib in
GIST patients, caution should be used when applying these criteria for other targeted agents. Hittinger et al compared CT densitometry and subsequent treatment response groups based on Choi criteria with the RECIST system in patients with metastatic renal carcinoma treated with sorafenib. They concluded that the Choi criteria defined more patients as par-tial responders at early stages of therapy than did RECIST, but it was not effective for selecting patients with prolonged survival. Since there were limitations to the study, such as a
small sample size (n = 22) and other previous therapies before
sorafenib, their conclusion should be further investigated.12
In 2009, Chun et al devised novel tumor response criteria based on morphologic changes observed on CT scans in patients with colorectal cancer harboring liver metastases that
were treated with bevacizumab-containing regimens.13 The
new morphologic criteria assigned each metastatic lesion into one of three different groups (Table 2). A group-3 metastasis was characterized by heterogeneous attenuation and a thick, poorly defined tumor-liver interface. A group-1 metastasis was characterized by homogeneous low attenuation with a thin, sharply defined tumor-liver interface. A group-2 metas-tasis had morphology that could not be rated as 3 or 1. When present, a peripheral rim of hyperattenuating contrast enhancement was designated a group-3 characteristic and resolution of this enhancement was classified as group 1. Morphologic response criteria were defined as optimal if the metastasis changed from a group 3 or 2 to a 1, incomplete
Table 1 RECiST criteria 1.15 and Choi criteria9,10
Response evaluation RECIST criteria 1.1 Choi criteria
Methods Change in sum of longest dimensions of target lesions (maximum of two per organ, up to five total).
Change in size or attenuation of target lesions.
Complete response Disappearance of all target lesions, confirmed at 4 weeks.
Disappearance of all target lesions, confirmed at 4 weeks.
Partial response 30% decrease from baseline, confirmed at 4 weeks. 10% decrease in tumor size or 15% decrease in tumor attenuation at contrast material-enhanced computed tomography, no new lesions, no obvious progression of nonmeasurable disease.
Stable disease Neither partial response nor progressive disease criteria met.
Neither partial response nor progressive disease criteria met.
Progressive disease 20% increase over smallest sum observed and overall 5 mm net increase or appearance of new lesions.
10% increase in tumor size, tumor attenuation criteria for partial response not met, new lesions.
Abbreviation: RECiST, Response Evaluation Criteria in Solid Tumors.
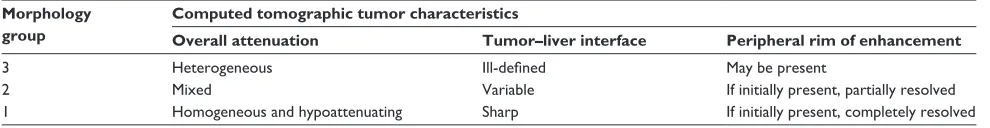
Table 2 Computed tomographic morphologic groups
Morphology group
Computed tomographic tumor characteristics
Overall attenuation Tumor–liver interface Peripheral rim of enhancement
3 Heterogeneous Ill-defined May be present
2 Mixed variable if initially present, partially resolved
1 Homogeneous and hypoattenuating Sharp if initially present, completely resolved Dovepress Li et al
OncoTargets and Therapy downloaded from https://www.dovepress.com/ by 118.70.13.36 on 26-Aug-2020
if the group changed from 3 to 2, and none if the group had not changed or if it increased. In patients with multiple tumors, morphologic response criteria were assigned based on the response seen in most tumors. The appearance of new metastases was defined as progression by morphology assess-ment (Table 3). They found that among patients treated with bevacizumab, CT-based morphologic criteria had a statisti-cally significant association with both pathologic response
(P= 0.001) and overall survival (P= 0.009), while RECIST
criteria only correlated with pathologic response (P= 0.04)
and did not correlate with survival (P= 0.45). Patients with
an optimal CT-based morphologic response had a median overall survival of 31 months (95% CI, 26.8–35.2 months) compared with 19 months (95% CI, 14.6–23.4 months) for patients with incomplete or no morphologic response
(P= 0.009). In contrast, based on RECIST criteria, median
overall survival of patients with a partial response was 28 months (95% CI, 22.5–33.5 months) compared with 22 months (95% CI, 15.3–28.7 months) for those with stable
or progressive disease (P= 0.45).
In addition to Choi criteria and CT-based morphologic criteria, Lee et al recently proposed a new CT response
criteria, referred to as the new response criteria (NRC),14 in
patients with non-small-cell lung cancer (NSCLC) treated with epidermal growth factor receptor tyrosine kinase inhibitors. According to RECIST measurements, the size of a target lesion is measured by including both solid and ground-glass opacity components. However, according to NRC, the size of a target lesion is assessed on mediastinal window images and measured by including solid components only. If a target lesion has internal cavitations, the size of the lesion is measured by including only the soft-tissue wall thickness component and by excluding the air component of the cavity (subtraction of cavity diameter from the longest diameter of the cancer mass) (Figure 1). Tumor response was evaluated in accordance with NRC (Table 4). They concluded that in NSCLC patients treated with gefitinib or erlotinib, NRC could reflect additional morphological characteristics of tar-get lesions, which was more adequate than RECIST and had a statistically significant association with overall survival.
With NRC, patients with a good response had a median overall survival of 18.4 months compared with 8.5 months
in patients with a poor response (P= 0.04). However, with
RECIST, good and poor responders did not show a sig-nificant survival difference, which was 18.4 months versus
12 months, respectively (P= 0.68).
Dynamic contrast-enhanced
perfusion computed
tomography (CTP)
CTP is a kind of molecular and functional imaging technique, also referred to as functional CT, dynamic CT, or perfusion CT. CTP can provide information about blood flow, blood volume, capillary permeability, and microvessel density. After an intravenous bolus of conventional iodinated contrast, a series of images is made. There is a linear relationship between the concentration of contrast agent and the attenu-ation numbers (expressed in HU). The parameter used is the standardized perfusion value, defined as the ratio of tumor
perfusion to whole-body perfusion.3
To date, there are no definite criteria based on CTP, but several studies have proven that CTP is a valuable technique
for evaluating anti-vascular drugs such as bevacizumab.15–19
According to a study of neoadjuvant bevacizumab treat-ment in rectal cancer, CTP at day 12 post-bevacizumab alone showed significant decreases in blood flow and permeability–surface area product compared with before
treatment (P, 0.05).17 Ng et al demonstrated that blood
flow and blood volume of the lesions were significantly reduced after 2 days of bevacizumab infusion in patients with
metastatic carcinoid tumors.18 Jiang et al conducted a clinical
trial in 33 patients with advanced hepatocellular carcinoma
(HCC).19 CTP was a sensitive imaging technique for
monitor-ing early antiangiogenic treatment effects. On days 10 to 12 after initiation of bevacizumab, significant decreases in the tumor blood flow, blood volume, and permeability surface,
Table 3 Computed tomography-based morphologic response criteria
Response Definition
Optimal response Metastasis changed from a group 3 or 2 to a 1 incomplete response Group changed from 3 to 2
No response Group had not changed or increased Progression Appearance of new metastases
RECIST measurement = x
Our measurement = Y – Z x
y z
Figure 1 Diagramdepicting target lesion measurement by RECiST and NRC.
Notes: x=solidand ground-glass opacity components; y = solid component on mediastinal window images; z = air component of cavity.
Abbreviations: NRC, new response criteria; RECiST, Response Evaluation Criteria in Solid Tumors.
Dovepress Tumor-targeted therapy evaluation
OncoTargets and Therapy downloaded from https://www.dovepress.com/ by 118.70.13.36 on 26-Aug-2020
and an increase in mean transit time from the baseline were
noted (P, 0.005), while there was no significant change in
tumor size based on RECIST.
Dynamic
contrast-enhanced-magnetic resonance imaging
(DCE-MRI)
DCE-MRI is a noninvasive molecular and functional imag-ing technique that is performed after injection of a contrast agent. Typically, low-molecular-weight contrast agents (eg, gadopentetate dimeglumine) are used. MR sequences can be designed to be sensitive to the vascular phase of contrast medium delivery, so-called T2 methods. From these images, data on tissue perfusion and blood volume can be extracted. Using sequences sensitive to the presence of the contrast medium in the extravascular extracellular space, so-called T1 methods, information regarding microvessel perfusion,
permeability, and extracellular leakage space is obtained.20
Tofts et al described a standard set of quantity names and
symbols.21 These include: (1) a volume transfer constant, Ktrans
(min-1), also known as the wash-in rate; (2) the volume of
the extravascular space (EES) per unit volume of tissue ve;
and (3) the flux-rate constant between EES and plasma kep
(kep= Ktrans/v
e) (min-1), known as the wash-out rate. The rate
constant is the ratio of the transfer constant to the EES. Lower
values of kep or Ktrans can indicate lower perfusion, lower
permeability, and/or a smaller blood vessel surface area. To date, there are no definite criteria based on DCE-MRI. But changes in its parameters were reported to correlate with the effect of some targeted agents, including sorafenib,
bevacizumab, trastuzumab, and cetuximab.22–28
Flaherty et al conducted a study to investigate the anti-angiogenic effects of sorafenib in metastatic renal cell carci-noma and determine the value of DCE-MRI in the response
evaluation. The study concluded that the percentage of Ktrans
decline and the value of Ktrans at baseline were significantly
associated with progression-free survival (P = 0.01 and
P= 0.02, respectively).22 In another recent study in patients
with advanced NSCLC receiving sorafenib, the decrease of
kep was significant in predicting improvement in overall
sur-vival (P= 0.035) and progression-free survival (P= 0.029).23
In several studies on bevacizumab, researchers have observed
a decrease in parameters such as Ktrans and k
ep in
respond-ers.24–27 Patients with inflammatory or locally advanced
breast cancer showed a statistically significant decrease in
the DCE-MRI pharmacokinetic parameter Ktrans after one
cycle of bevacizumab.24,25 Mehta et al are now conducting a
study to assess the early therapeutic response to bevacizumab in primary breast cancer using DCE-MRI and gene
expres-sion profiles.26 They have identified three intrinsic patterns
of early response to bevacizumab, including: (1) significant reduction in permeability and blood flow over the extent of the tumor; (2) development of a large central necrotic core; and (3) little or no change in the tumor vasculature. Their primary results imply that the second response group may ultimately correspond to the subset of patients who receive the greatest benefit from bevacizumab. Final data will be released soon.
Dynamic contrast-enhanced
ultrasound (DCE-US)
US contrast agents, such as microbubbles, nanoparticles, or perfluorcarbon gas, alter wave absorption and reflection, which enhances the intensity of signals bouncing back from tissues and provides morphologic and physiologic
informa-tion at the same time.3 The European Federation of
Societ-ies for Ultrasound in Medicine and Biology recommends clinical application of DCE-US for assessing responses of different tumors such as GIST, renal cell carcinoma,
and HCC.29 However, no criteria based on DCE-US have
Table 4 Tumor response definition on computed tomography scans according to new response criteria as for non-small-cell lung cancer
Response Definition
Complete response (NRCCR)
1. Disappearance of all lesions and 2. no new lesion
Partial response (NRCPR)
1. a If a region of interest (ROI) of the solid portion
within a tumor # 5 mm2:
a. a decrease in sizeb of $30% in diameter;
b. no new lesion; and
c. no obvious progression of nontarget lesions. 2. if an ROi of the solid portion within a tumor . 5 mm2:
a. a decrease in sizeb of $10% in diameter or
a decrease in tumor attenuation of $15%; b. no new lesion; and
c. no obvious progression of nontarget lesions. Stable
disease (NRCSD)
Does not meet the criteria for complete response, partial response, or progressive disease. Progressive
disease (NRCPD)
1. Meets the following criteria:
a. an increase in tumor sizeb of $20% in diameter
with substantial increase by at least 5 mm; b. does not meet criteria of partial response by
tumor attenuation changes; and c. no cavitations.
2. Appearance of new lesion(s)
Notes: Only the solid components of all targeted lesions were measured on mediastinal window images of enhanced computed tomography scans. aParticularly
in cavitary lesions with very thin walls or in very small nodules after treatment; bsum
of subtraction of cavity diameters from the longest diameters of target lesions as defined in RECIST.
Abbreviation: RECiST, Response Evaluation Criteria in Solid Tumors.
Dovepress Li et al
OncoTargets and Therapy downloaded from https://www.dovepress.com/ by 118.70.13.36 on 26-Aug-2020
been described. The main indices of this technology include peak intensity (PI), area under the curve (AUC), area under the wash-in, area under the wash-out, time to peak intensity, slope of the wash-in, and mean transit time. The first four indices (PI, AUC, area under the wash-in, and area under the wash-out) correspond to blood volume, while the time to peak intensity and slope of the wash-in correspond to blood flow.
Lamuraglia et al conducted a study to investigate DCE-US in the response evaluation of metastatic renal cell carcinoma treated with sorafenib. They defined a good response as a decrease in contrast uptake exceeding 10%, and stability or a decrease in tumor volume at 3 weeks after treatment initiation. There was a statistically significant
dif-ference in progression-free survival (PFS) (P= 0.0001) and
overall survival (OS) (P= 0.0001) between good and poor
responders.30 In a trial of patients with unresectable and/or
metastatic renal cell carcinoma or malignant melanoma treated with sorafenib, researchers defined a good response as
a $20% decrease in contrast uptake coupled with stability or
a decrease in tumor volume, or a $30% decrease of volume
if no modification of vascularization was observed. Similarly,
good responders showed an increased PFS of 319 days (n = 6)
and OS of 319 days (n = 6) relative to poor responders, who
had a PFS of 90 days (n = 3) and OS of 173 days (n = 3).31
Similar results were reported to indicate that DCE-US was a potential tool for response evaluation of renal cell carcinoma
treated with antivascular therapies.32,33
For GIST patients with liver metastasis treated with imatinib or masatinib, several studies showed that DCE-US
allowed the early prediction of tumor response.34–37
Lassau et al found that AUC, area under the wash-in, and area under the wash-out were the important DCE-US param-eters related to blood volume that at day 15 could predict
the response of GISTs to treatment with masatinib.36 In
November 2009, the European Society for Medical Oncology Clinical Practice Guidelines recommended that consistent changes on DCE-US should be considered as criteria for
tumor response in GISTs.37
For HCC treated with targeted drugs, particularly beva-cizumab, DCE-US is also a valuable technique for early
response evaluation.38–40 Lassau et al recently reported that
DCE-US can be used to quantify dynamic changes in tumor vascularity as early as three days after bevacizumab
admin-istration in patients with HCC.39
A French multicenter study of various types of tumors is currently being conducted, but complete results have
not been reported.40 This study was primarily designed to
demonstrate the feasibility of using DCE-US in hospitals in France, to determine the best parameter and the best timing to assess antiangiogenesis and antivascular treatment, and to confirm a threshold for differentiating between responders and nonresponders. In this program, more than 400 patients with metastases from breast cancer, melanoma, colon cancer, GIST, renal cell carcinoma, or with primary hepatocel-lular carcinoma treated with antiangiogenic drugs (Sutent, Nexavar, bevacizumab, imatinib, etc) were included in the study. Preliminary results show that the AUC is correlated to response at 6 months in good and poor responders, but complete results are not yet available.
Fluorodeoxyglucose positron
emission tomography (FDG-PET)
PET is a common radionuclide imaging technique. FDG is the most commonly used radiopharmaceutical for PET. FDG uptake on PET, expressed as standardized uptake values (SUV), reflects the metabolic activity of cells. In addition to being used to characterize, stage, and restage tumors,
FDG-PET can applied to evaluate therapeutic response.3,41 Moreover,
PET-CT enables assessment of molecular characteristics as depicted by PET based on anatomical structures on CT.
Although different classifications have been proposed for FDG-PET (Table 5), there are no generally accepted criteria for a metabolic response in tumor therapy. The European Organization for Research and Treatment of Cancer (EORTC) PET response criteria and the PET Response Criteria in Solid Tumors (PERCIST) are both based on the
magnitude of the change in SUV relative to baseline42,43
Many studies have demonstrated that PET or PET-CT is an early predictor of the response to targeted therapy such as
imatinib, erlotinib, gefitinib, sorafenib, and bevacizumab.44–53
In a study of advanced GIST treated with imatinib, both a
PET SUVmax (maximum standardized uptake value) threshold
of 2.5 at 1 month and EORTC criteria for partial response on FDG-PET were shown to be predictive of prolonged
treat-ment success. However, an optimized PET SUVmax threshold
of 3.4 and a 40% reduction in the SUVmax outperformed the
EORTC criteria.44 In a trial of metastatic gastric
adenocarci-noma treated with chemotherapy plus cetuximab, metabolic
response was defined as $35% decrease of SUVmax.50 In the
following 11-month investigation, the median time to dis-ease progression for early metabolic responders (11 months) was significantly longer than for metabolic nonresponders
(5 months) (P= 0.0016).
Goshen et al investigated the value of FDG-PET in the response evaluation of colorectal cancer patients with liver
Dovepress Tumor-targeted therapy evaluation
OncoTargets and Therapy downloaded from https://www.dovepress.com/ by 118.70.13.36 on 26-Aug-2020
Table 5 EORTC criteria and PERCiST criteria
Response evaluation EORTC criteria PERCIST criteria
Complete metabolic response (CMR)
Complete resolution of FDG uptake in tumor volume so that it is indistinguishable from surrounding normal tissue.
Complete resolution of FDG uptake in measurable target lesion so that it is less than mean liver activity and indistinguishable from surrounding background blood pool levels; disappearance of all other lesions to background blood pool levels; no new FDG-avid lesions in pattern typical of cancer (if progression according to RECIST, must verify with follow-up).
Partial metabolic response (PMR)
A minimum of 15%–25% decrease in tumor FDG SUv after one cycle of chemotherapy, and .25% decrease after more than one treatment cycle (reduction in extent of tumor FDG uptake is not a requirement).
Minimum 30% decrease in measurable target tumor FDG SUv peak with absolute decrease in SUv of at least 0.8 SUv units;a no increase .30% in
SUv or size of target or nontarget lesions.
Stable metabolic disease (SMD)
,25% increase or ,15% decrease in tumor FDG SUv and no visible increase in extent of tumor FDG uptake (.20% in the longest dimension).
Neither PMR nor PMD criteria met.
Progressive metabolic disease (PMD)
.25% increase in tumor FDG SUv in tumor region defined on baseline scan, visible increase in extent of tumor FDG uptake (.20% in the longest dimension), or appearance of new FDG uptake in metastatic lesions.
.30% increase in FDG SUv peak with .0.8 SUv unit increase in tumor SUv peak from the baseline scan in a pattern typical of tumor and not of infection or treatment effect; visible increase in the extent of FDG tumor uptake (75% in total lesion glycolysis volume) with no decline in SUv; or new FDG-avid lesions that are typical of cancer and not related to treatment effect or infection.b
Notes:aMeasurement is commonly made in the same lesion that was measured at baseline but can be made in another lesion if that lesion was previously present and is the
most active lesion after treatment; bPMD other than new visceral lesions should be confirmed at follow-up study within 1 month unless PMD is also clearly associated with
progressive disease according to RECiST 1.1.
Abbreviations: EORTC, European Organization for Research and Treatment of Cancer; FDG, fluorodeoxyglucose; PERCIST, PET Response Criteria in Solid Tumors; PET, positron emission tomography; RECiST, Response Evaluation Criteria in Solid Tumors; SUv, standardized uptake values.
metastasis treated with bevacizumab and irinotecan. They concluded that FDG-PET correlated better than CT with
pathology, and was more indicative of pathological changes.51
FDG-PET is currently being validated as a valuable tool for tumor response evaluation in targeted therapy.
Conclusion
As described above, there are many new imaging techniques and criteria in the field of targeted therapy. However, there are no criteria suitable for evaluating various tumors treated with different targeted drugs. Researchers have demonstrated that for advanced GIST treated with imatinib, the Choi
criteria are better than RECIST criteria.8–11 For colorectal
cancer harboring liver metastases treated with bevacizumab, CT-based morphologic criteria correlate significantly with
overall survival, while RECIST criteria do not.13 For NSCLC
treated with epidermal growth factor receptor tyrosine kinase
inhibitors, NRC are more adequate than RECIST.14 CTP,
DCE-MRI, and DCE-US can be used as early predictors of blood perfusion in target lesions after antiangiogenesis and antivascular treatment, but there are no concrete or widely applicable criteria. PET can be used to evaluate the
meta-bolic change of tumors,44–53 which is a significant advantage
over CT. Although two types of criteria, including EORTC
and PERCIST, have been proposed,42,43 there are currently
no generally accepted criteria based on PET.
In summary, several different CT criteria are available for evaluating targeted therapy other than RECIST. Additionally, molecular and functional imaging techniques such as DCE-MRI, DCE-US, and FDG-PET can be used to measure early treatment response to targeted therapy. Finally, optimal and well-accepted criteria for new imaging modalities are not available for clinical use; therefore, significant efforts are needed for improvement.
Disclosure
The authors report no conflicts of interest in this work.
References
1. Grillo-López AJ, Hedrick E, Rashford M, Benyunes M. Rituximab: ongo-ing and future clinical development. Semin Oncol. 2002;29(1 Suppl 2): 105–112.
2. Schrama D, Reisfeld RA, Becker JC. Antibody targeted drugs as cancer therapeutics. Nat Rev Drug Discov. 2006;5(2):147–159.
3. Desar IM, van Herpen CM, van Laarhoven HW, Barentsz JO, Oyen WJ, van der Graaf WT. Beyond RECIST: Molecular and functional imaging techniques for evaluation of response to targeted therapy. Cancer Treat Rev. 2009;35(4):309–321.
Dovepress Li et al
OncoTargets and Therapy downloaded from https://www.dovepress.com/ by 118.70.13.36 on 26-Aug-2020
4. Miller AB, Hoogstraten B, Staquet M, Winkler A. Reporting results of cancer treatment. Cancer. 1981;47(1):207–214.
5. Eisenhauer EA, Therasse P, Bogaerts J, et al. New response evaluation criteria in solid tumours: revised RECIST guideline (version 1.1). Eur J Cancer. 2009;45(2):228–247.
6. Blanke CD, Demetri GD, von Mehren M, et al. Long-term results from a randomized phase II trial of standard-versus higher-dose imatinib mesylate for patients with unresectable or metastatic gastrointestinal stromal tumors expression KIT. J Clin Oncol. 2008;26(4):620–625. 7. Yang LQ, Qin SQ. New response criteria of GIST treated with targeted
drugs. Chin Clin Oncol. 2008;13(10):942.
8. Choi H, Charnsangavej C, de Castro Faria S, et a1. CT evaluation of the response of gastrointestinal stromal tumors after imatinib mesylate treatment: a quantitative analysis correlated with FDG-PET findings.
Am J Roentgenal. 2004;183(6):1619–1628.
9. Choi H. Critical issues in response evaluation on computed tomography: lessons from the gastrointestinal stromal tumor model. Curr Oncol Rep. 2005;7(4):307–311.
10. Choi H. Response evaluation of gastrointestinal stromal tumors.
Oncologist. 2008;13(Suppl 2):4–7.
11. Choi H, Charnsangavej C, Faria SC, et al. Correlation of computed tomography and positron emission tomography in patients with meta-static gastrointestinal stromal tumor treated at a single institution with imatinib mesylate: proposal of new computed tomography response criteria. J Clin Oncol. 2007;25(13):1753–1759.
12. Hittinger M, Staehler M, Schramm N, et al. Course of size and density of metastatic renal cell carcinoma lesions in the early follow-up of molecular targeted therapy. Urol Oncol. Epub August 23, 2011. 13. Chun YS, Vauthey JN, Boonsirikamchai P, et al. Association of
computed tomography morphologic criteria with pathologic response and survival in patients treated with bevacizumab for colorectal liver metastases. JAMA. 2009;302(21):2338–2344.
14. Lee HN, Lee KS, Ahn MJ, et al. New CT response criteria in non-small cell lung cancer: proposal and application in EGFR tyrosine kinase inhibitor therapy. Lung Cancer. 2011;73(1):63–69.
15. Koukourakis MI, Mavanis I, Kouklakis G, et al. Early antivascular effects of bevacizumab anti-VEGF monoclonal antibody on colorectal carcinomas assessed with functional CT imaging. Am J Clin Oncol. 2007;30(3):315–318.
16. Yao JC, Phan A, Hoff PM, Hoff PM, et al. Targeting vascular endothelial growth factor in advanced carcinoid tumor: a random assignment phase II study of depot octreotide with bevacizumab and pegylated interferon alpha-2b. J Clin Oncol. 2008;26(8):1316–1323.
17. Willett CG, Duda DG, di Tomaso E, et al. Efficacy, safety, and biomark-ers of neoadjuvant bevacizumab, radiation therapy, and fluorouracil in rectal cancer: a multidisciplinary phase II study. J Clin Oncol. 2009;27(18):3020–3026.
18. Ng CS, Charnsangavej C, Wei W, Yao JC. Perfusion CT findings in patients with metastatic carcinoid tumors undergoing bevacizumab and interferon therapy. J Clin Oncol. 2011;196(3):569–576.
19. Jiang T, Kambadakone A, Kulkarni NM, Zhu AX, Sahani DV. Monitoring response to antiangiogenic treatment and predicting outcomes in advanced hepatocellular carcinoma using image biomarkers, CT perfusion, tumor density, and tumor size (RECIST). Invest Radiol. 2012;47(1):11–17. 20. Padhani AR, Leach MO. Antivascular cancer treatments: functional
assessments by dynamic contrast-enhanced magnetic resonance imaging. Abdom Imaging. 2005;30(3):324–341.
21. Tofts PS, Brix G, Buckley DL, et al. Estimating kinetic param-eters from dynamic contrast-enhanced T1-weighted MRI of a dif-fusable tracer: standardized quantities and symbols. J Magn Reson Imaging.1999;10(3):223–332.
22. Flaherty KT, Rosen MA, Heitjan DF, et al. Pilot study of DCE-MRI to predict progression-free survival with sorafenib therapy in renal cell carcinoma. Cancer Biol Ther. 2008;7(4):496–501.
23. Kelly RJ, Rajan A, Force J, et al. Evaluation of KRAS mutations, angiogenic biomarkers, and DCE-MRI in patients with advanced non-small-cell lung cancer receiving sorafenib. Clin Cancer Res. 2011;17(5):1190–1199.
24. Wedam SB, Low JA, Yang SX, et al. Antiangiogenic and antitumor effects of bevacizumab in patients with inflammatory and locally advanced breast cancer. J Clin Oncol. 2006;24(5):769–777.
25. Thukral A, Thomasson DM, Chow CK, et al. Inflammatory breast cancer: dynamic contrast-enhanced MR in patients receiving bevacizumab – initial experience. Radiology. 2007;244(3):727–735. 26. Mehta S, Hughes NP, Buffa FM, et al. Assessing early therapeutic
response to bevacizumab in primary breast cancer using magnetic resonance imaging and gene expression profiles. J Natl Cancer Inst Monogr. 2011;2011(43):71–74.
27. Hsiang DJ, Yamamoto M, Mehta RS, et al. Predicting nodal status using dynamic contrast-enhanced magnetic resonance imaging in patients with locally advanced breast cancer undergoing neoadjuvant chemotherapy with and without sequential trastuzumab. Arch Surg. 2007;142(9):855–861.
28. Kim H, Folks KD, Guo L, et al. Early therapy evaluation of combined cetuximab and irinotecan in orthotopic pancreatic tumor xenografts by dynamic contrast-enhanced magnetic resonance imaging. Mol Imaging. 2011;10(3):153–167.
29. Piscaglia F, Nolsøe C, Dietrich CF, et al. The EFSUMB Guidelines and Recommendations on the Clinical Practice of Contrast Enhanced Ultrasound (CEUS): update 2011 on non-hepatic applications.
Ultraschall Med. 2012;33(1):33–59.
30. Lamuraglia M, Escudier B, Chami L, et al. To predict progression-free survival and overall survival in metastatic renal cancer treated with sorafenib: pilot study using dynamic contrast-enhanced Doppler ultrasound. Eur J Cancer. 2006;42(15):2472–2479.
31. Escudier B, Lassau N, Angevin E, et al. Phase I trial of sorafenib in combination with IFN alpha-2a in patients with unresectable and/or metastatic renal cell carcinoma or malignant melanoma. Clin Cancer Res. 2007;13(6):1801–1809.
32. Lassau N, Koscielny S, Albiges L, et al. Metastatic renal cell carci-noma treated with sunitinib: early evaluation of treatment response using dynamic contrast-enhanced ultrasonography. Clin Cancer Res. 2010;16(4):1216–1225.
33. Williams R, Hudson JM, Lloyd BA, et al. Dynamic microbubble contrast-enhanced US to measure tumor response to targeted therapy: a proposed clinical protocol with results from renal cell carcinoma patients receiv-ing antiangiogenic therapy. Radiology. 2011;260(2):581–590. 34. De Giorgi U, Aliberti C, Benea G, Conti M, Marangolo M. Effect of
angiosonography to monitor response during imatinib treatment in patients with metastatic gastrointestinal stromal tumors. Clin Cancer Res. 2005;11(17):6171–6176.
35. Lassau N, Lamuraglia M, Chami L, et al. Gastrointestinal stromal tumors treated with imatinib: monitoring response with contrast-enhanced sonography. Am J Roentgenol. 2006;187(5):1267–1273.
36. Lassau N, Chami L, Koscielny S, et al. Quantitative functional imag-ing by dynamic contrast enhanced ultrasonography (DCE-US) in GIST patients treated with masatinib. Invest New Drugs. 2012;30(2): 765–771.
37. Casali PG, Blay JY; EMSO/CONTICANET/EUROBONET Consensus Panel of Experts. Gastrointestinal stromal tumours: ESMO Clinical Practice Guidelines for diagnosis, treatment and follow-up. Ann Oncol. 2010;21(Suppl 5):v98–v102.
38. Benatsou B, Lassau N, Chami L, et al. Dynamic contrast-enhanced ultrasonography (DCE-US) with quantification for the early evaluation of hepato cellular carcinoma treated by bevacizumab in phase II. J Clin Oncol. 2008;26(Suppl 15):4588.
39. Lassau N, Koscielny S, Chami L, et al. Advanced hepatocellular carcinoma: early evaluation of response to bevacizumab therapy at dynamic contrast-enhanced US with quantification – preliminary results.
Radiology. 2011;258(1):291–300.
40. Lassau N, Chami L, Chebil M, et al. Dynamic contrast-enhanced ultra-sonography (DCE-US) and anti-angiogenic treatments. Discov Med. 2011;11(56):18–24.
41. Rohren EM, Turkington TG, Coleman RE. Clinical applications of PET in oncology. Radiology. 2004;231(2):305–332.
Dovepress Tumor-targeted therapy evaluation
OncoTargets and Therapy downloaded from https://www.dovepress.com/ by 118.70.13.36 on 26-Aug-2020
OncoTargets and Therapy
Publish your work in this journal
Submit your manuscript here: http://www.dovepress.com/oncotargets-and-therapy-journal
OncoTargets and Therapy is an international, peer-reviewed, open access journal focusing on the pathological basis of all cancers, potential targets for therapy and treatment protocols employed to improve the management of cancer patients. The journal also focuses on the impact of management programs and new therapeutic agents and protocols on
patient perspectives such as quality of life, adherence and satisfaction. The manuscript management system is completely online and includes a very quick and fair peer-review system, which is all easy to use. Visit http://www.dovepress.com/testimonials.php to read real quotes from published authors.
42. Young H, Baum R, Cremerius U, et al. Measurement of clinical and subclinical tumour response using [18F]-fluorodeoxyglucose and posi-tron emission tomography: review and 1999 EORTC recommendations. European Organization for Research and Treatment of Cancer (EORTC) PET Study Group. Eur J Cancer. 1999;35(13):1773–1782.
43. Wahl RL, Jacene H, Kasamon Y, Lodge MA. From RECIST to PERCIST: evolving considerations for PET response criteria in solid tumors. J Nucl Med. 2009;50(Suppl 1):122S–150S.
44. Holdsworth CH, Badawi RD, Manola JB, et al. CT and PET: early prognostic indicators of response to imatinib mesylate in patients with gastrointestinal stromal tumor. Am J Roentgenol. 2007;189(6): W324–W330.
45. Riely GJ, Kris MG, Zhao B, et al. Prospective assessment of discontinuation and reinitiation of erlotinib or gefitinib in patients with acquired resistance to erlotinib or gefitinib followed by the addition of everolimus. Clin Cancer Res. 2007;13(17):5150–5155.
46. Sunaga N, Oriuchi N, Kaira K, et al. Usefulness of FDG–PET for early prediction of the response to gefitinib in non-small cell lung cancer.
Lung cancer. 2008;59(2):203–210.
47. Aukema TS, Kappers I, Olmos RA, et al. Is 18F-FDG PET/CT useful for the early prediction of histopathologic response to neoadjuvant erlotinib in patients with non-small cell lung cancer? J Nucl Med. 2010;51(9):1344–1348.
48. Lanzuela M, Pazo Cid RA, Lao J, et al. Early response evaluation of sorafenib (SFB) therapy: Use of computed fluorodeoxiglucose positron emission tomography (PET-CT) in advanced hepatocellular carcinoma (HCC). J Clin Oncol. 2010;28(Suppl 15):e14567.
49. Willett CG, Boucher Y, di Tomaso E, et al. Direct evidence that the VEGF-specific antibody bevacizumab has antivascular effects in human rectal cancer. Nat Med. 2004;10(2):145–147.
50. Di Fabio F, Pinto C, Rojas Llimpe FL, et al. The predictive value of 18F-FDG–PET early evaluation in patients with metastatic gastric adenocarcinoma treated with chemotherapy plus cetuximab. Gastric Cancer. 2007;10(4):221–227.
51. Goshen E, Davidson T, Zwas ST, Aderka D. PET/CT in the evaluation of response to treatment of liver metastases from colorectal can-cer with bevacizumab and irinotecan. Technol Cancer Res Treat. 2006;5(1):37–43.
52. Malavasi N, Bagni B, Bertolini F, et al. Predictive role of fluorodeoxy-glucose positron emission tomography (18fF-FDG CT-PET) in early
assessment of response to bevacizumab and FOLFOX-6 combined neoadjuvant therapy for liver metastasis (LM) from colorectal cancer (CRC). J Clin Oncol. 2008;26(Suppl 15):15094.
53. Colavolpe C, Chinot O, Metellus P, et al. FDG-PET predicts survival in recurrent high-grade gliomas treated with bevacizumab and irinotecan.
Neuro Oncol. 2012;14(5):649–657.
Dovepress
Dove
press
Li et al
OncoTargets and Therapy downloaded from https://www.dovepress.com/ by 118.70.13.36 on 26-Aug-2020