Study On The Relationship Between
Ownership Structure And Corporate
Performance: Evidence From Chinese
Companies Listed On The GEM Board
Qiaowen Zhang, Stellenbosch University, South Africa Pierre Erasmus, Stellenbosch University, South Africa
ABSTRACT
The study on which this article reports, analyzed the current situation of ownership structure and corporate performance based on the panel data of 153 companies listed on the Growth Enterprises Market (GEM) board from 2010 to 2012 and explored the mechanism of companies’ ownership structure to corporate performance with multiple regressions. The results show that tradable shares, state-owned shares and managerial shares have a negative correlation with corporate performance, and that there is a significant quadratic non-linear relationship between tradable shares and corporate performance while legal-person shares are not significantly related to corporate performance. We also found that the shareholding ratio of the top ten largest shareholders has a significantly positive correlation with corporate performance but we failed to find any significance for the largest shareholder and the Z index.
Keywords: Ownership Structure; Corporate Performance; GEM Board; Corporate Governance
1. INTRODUCTION
s a newly emerging force in Chinese capital markets, the GEM board has received a lot of attention. The GEM board of the Chinese stock market was set up in 2009, and by the end of 2013, a total of 355 companies were listed on the board1. By the end of 2013, the total market value of the GEM board had risen to RMB 1.5 trillion, and there are more than 20 enterprises whose market values exceed billions of RMB2. Although the GEM board has not been considered as the leading player in the Chinese stock market, going public on the GEM board is becoming an important approach for the initial public offering (IPO) of growth enterprises, a breeding base for strategic emerging industries, and a financing platform for high- and new-tech enterprises, which have a significant influence on the Chinese structural transformation of the economy and upgrading of the industrial structure.
Before going public, the majority of companies listed on the GEM board were family enterprises with concentrated equity3. Stock rights began to decentralize once listed and the separation of ownership and control resulted in a series of problems concerning ownership structure and corporate governance, e.g., agency problems (Du & Liu, 2002). As a form of structural arrangement, ownership structure is an important part of corporate governance, which will ultimately influence corporate performance. Relatively little research has been conducted on ownership structure and the corporate performance of Chinese companies listed on the GEM board, with the majority of previous research focused on the main board and the small and medium-sized enterprise (SME) board. However, the
1 See Shenzhen Stock Exchange (SZSE) official website, http://www.szse.cn/main/chinext/ 2 See China Stock Market and Accounting Research (CSMAR) database
3 China Securities Times indicates that over eighty percent of listed companies on the GEM board are family controlled companies, see http://kuaixun.stcn.com/2013/0811/10668510.shtml
GEM board possesses its own characteristics and is different from the main and SME boards in many aspects, e.g. scale, industry distribution and ownership structure, thereby necessitating conducting a study regarding ownership structure and corporate performance of companies listed on the GEM board. Hence, the current study will not only enrich the relevant theory, but will also offer recommendations for good corporate governance practices, assist companies listed on the GEM board with their development and growth, and promote the development of a multi-level capital market and optimize its structure.
2. RESEARCH QUESTIONS AND HYPOTHESIS
Ownership structure is defined along two dimensions, namely ownership mix and ownership concentration (Gursoy & Aydogan, 2002). The exploration of the relationship between ownership structure and corporate performance has been the focus of scholars worldwide, initiated by Berle and Means’s research in this field following the Great Depression (Berle & Means, 1932) and continuing beyond Jensen and Meckling formally discussing the relationship between the two concepts (Jensen & Meckling, 1976). Even when considering the subsequent decades’ exploration, no generally accepted conclusion has yet been reached. Some researchers (e.g. Anderson & Reeb, 2003; McConnell & Servaes, 1990; Pedemen & Thomsen, 1999) hold that ownership structure has an effect on corporate performance, but still many studies (e.g. Domsetz & Villalonga, 2001; Holderness & Sheehan, 1988; Wahla, Shah, & Hussain, 2012) fail to find a relationship between ownership structure and corporate performance. Chinese scholars (e.g. Bai, Liu, Lu, Song, & Zhang, 2005; Chen & Xu, 2001; Liu & Wang, 2000; Sun & Huang, 1999; Tan, He, & Ma, 2011) have also conducted extensive research on this subject, most of which is focused on companies that are listed on the main board and the SME board, since the GEM board is still considered a new development in China. As a result, conducting research on the GEM board became both important and urgent since it has already become an indispensable part of the Chinese multi-level capital market.
This article attempted to answer the following two research questions to achieve the goal of the study:
1) Is there a relationship between ownership structure and the corporate performance of companies listed on the GEM board?
2) What is the specific relationship between different variables of ownership structure and corporate performance of companies listed on the GEM board?
2.1 Ownership Mix and Corporate Performance
Ownership mix is concerned with the identity of a company’s major shareholder, who could have tradable shares, state-owned shares and legal-person shares considering the Chinese context (Xu & Wang, 1999). Furthermore, people at management level of companies listed on the GEM board often hold majority shares, so it is necessary to take managerial shares into consideration as well.
Theoretically, according to price signals of the stock market and takeover mechanisms, the stronger stock liquidity is, the more beneficial it is to risk diversification and the effectiveness and efficiency of corporate financing. However, in reality, as the Chinese capital market is not fully developed, most tradable shareholders are individual investors and their ownership is too dispersive and speculative to get involved in corporate governance. Free-rider problems frequently occur among minority shareholders. Thus, the high proportion of tradable shares may have a negative effect on corporate governance rather than making corporate governance more efficient (Chen & Xu, 2001; Xu & Hu, 2006). In addition, a high proportion of tradable shares is likely to disperse decision-makers’ control, which is not beneficial to informed decision-making (Du & Liu, 2002).
the GEM board, which are innovation-oriented, there is no doubt that state-owned shareholders’ involvement will affect the decision-making and innovation of operators, which will have adverse effects on listed companies.
There are obvious advantages for legal-person shareholders. Compared with individual shareholders, legal-person shareholders are equipped with more professional knowledge, abundant experience and better developed information channels (Su & He, 2012), so that the free-rider problem can be avoided to some extent. Compared with state-owned shareholders, legal-person shareholders have no political pressure and agendas and can perform better with corporate supervision and management (Su & He, 2012). Prior research (e.g. Liu, Huang, Tse, & He, 2011; Yu, 2001) reports positive comments regarding the relationship between legal-person shares and corporate performance. Scholars believe legal-person shareholders have good self-control and are stable – their controllable investment motivation not only results in their active involvement, but the incentive to conduct corporate supervision to improve governance efficiency, and the stability of their shareholding results in long-term operational behavior, which is beneficial to a company’s development (Liu, 2000; Liu, Huang, Tse, & He, 2011; Zhang, 2000).
At present, more and more enterprises encourage management to participate in corporate governance, like shareholders, by means of stock incentives, which can contribute to Management’s interests being entwined with those of shareholders (Cornett, Marcus, & Tehranian, 2008; Jensen & Meckling, 1976; Li & Wu, 2010). Hence, the adverse selection of corporate performance resulting from conflicts of interests between management and shareholders can be avoided to some extent. The results of existing research on the role top management played in corporate performance remains inconclusive. As for the current situation in China, some professional managers have problems regarding their fiduciary duty, and when management holds low levels of shareholding, their objectives still will not keep in line with corporate interest (Guglar, Mueller, & Yurtoglu, 2004). A high level of managerial shareholding, in contrast, will make it more possible for managers to expropriate corporate interest (Fama & Jensen, 1983; Switzer, 2007; Wang & Xu, 2009). Due to moral deficiency and a lack of effective supervision, managers with shares may sacrifice other shareholders’ interest for their own. Thus, managerial shares in listed companies on the GEM board may lead to tunneling behavior instead of positive convergence, that is, the higher the proportion of managerial shares, the more opportunities managers have to abuse power for personal gain and to damage corporate performance (Xu & Wang, 2000).
Based on the preceding discussion, the following hypotheses were developed for the current study:
H1.1: The ratio of tradable shares has a negative correlation with corporate performance
H1.2: The ratio of state-owned shares has a negative correlation with corporate performance
H1.3: The ratio of legal-person shares has a positive correlation with corporate performance
H1.4: The ratio of managerial shares has a negative correlation with corporate performance
2.2 Ownership Concentration and Corporate Performance
2008) shows that the degree of ownership balance is related to corporate performance and the higher the degree of balance, the more restrictions other shareholders can put on the largest shareholder, improving corporate performance to some extent.
Currently, there are three main measurements of ownership concentration: the CR index determines the cumulative percentage of shares held by the top N largest shareholders, while the Herfindahl index measures the sum of squared percentages of shares held by the top N largest shareholders. A third measure, the Z index, is a measurement of the degree of balance: the higher the Z index, the more the largest shareholder gets restricted by smaller shareholders. The current study used the CR index as a measurement of the degree of concentration, measuring both the share proportion of the largest shareholder (CR1) and the cumulative shareholding of the top ten largest shareholders (CR10). The study also adopted the Z index to represent the cumulative proportion of shares held by the second-largest to tenth-second-largest shareholders, relative to the shareholding of the second-largest shareholder.
Based on the analysis above, the study formulated the following hypotheses:
H2.1: The CR1 index has a negative correlation with corporate performance H2.2: The CR10 index has a positive correlation with corporate performance
H2.3: The Z index has a positive correlation with corporate performance
3. RESEARCH METHODOLOGY
The hypotheses developed in the previous section are used to analyze the relationship between ownership structure and corporate performance. In order to test the hypotheses, eight models are established and balanced panel data is employed. In this part of the study, details about the data are provided and the six models used to assess the relevant relationships are introduced.
3.1 Sample and Data Sources
The sample consisted of 153 companies, which were listed on the GEM board of the Shenzhen Stock Exchange that went public during 2009 and 2010. The data for these companies for the three-year period 2010–2012 was extracted from the CSMAR database. Hence, the data used in the current study can be defined as “secondary data”. A balanced panel data methodology was applied to analyze the relationship between ownership structure and corporate performance, with 153 companies and 459 observations included in the statistical models used for analysis.
3.2 Variable Definition
The variables in this study consisted of corporate performance variables, ownership structure variables and control variables. The definitions of the variables are provided below:
(1) Corporate performance. Common measurements used in previous research (e.g. Brown & Caylor, 2009; Demsetz & Villalonga, 2001; McConnell & Servaes, 1990; Xu & Zhang, 2008) included Tobin’s Q ratio, which is problematic to estimate, and return on equity (ROE), which is often influenced by earnings management. In an attempt to address these limitations, ROA was employed in the current study as the proxy for corporate performance.
(2) Ownership structure. As mentioned above, the measurement of ownership structure reflects ownership mix and ownership concentration. Ownership mix reflects the portion of tradable shares, state-owned shares, legal-person shares and managerial shares. Ownership concentration is measured by the CR1, CR10 and Z indices.
Table1 below provides the definitions of these variables.
Table 1. Definition of variables
Variables Definition
Dependent Variable
Return on assets (ROA) net income/average total assets
Independent Variables
Ratio of tradable shares (TS) tradable shares/total shares
Ratio of state-owned shares (SS) state-owned shares/total shares
Ratio of legal-person shares (LS) legal-person shares/total shares
Ratio of managerial shares (MS) managerial shares/total shares
Ratio of the largest shareholder (CR1) shares of the largest shareholder/total shares Ratio of top ten largest shareholders (CR10) shares of top ten largest shareholders/total shares Ratio of second to tenth largest shareholders to the largest
shareholder (Z)
cumulative shares of second to tenth-largest shareholders / shares of the largest shareholder
Control Variables
Industry (INDUS) manufacturing industry=1, others=0
Company size (SIZE) log(total assets)
Debt to asset ratio (DA) total debt/total assets
3.3 Model Design
According to the hypotheses above, the current study proposed the following regression model (1):
ROA$%= α)+ β,TS$%+ β/SS$%+ β0LS$%+ β2MS$%+ β4CR1$%+ β7CR10$%+ β9Z$%
+β;INDUS$%+ β@SIZE$%+ β,)DA$%+ ε$% (1)
Where:
ROA refers to corporate performance, ownership mix is represented by TS, SS, LS and MS, ownership concentration is represented by CR1, CR10 and Z, and INDUS, SIZE and DA represent control variables. α) is the intercept, β,− β,, are regression coefficients, ε$% is the error term, and i and t represent listed company i and year t, respectively. Model (1) was used to examine whether there is a linear relationship between ownership structure and corporate performance.
In addition, since many scholars point out that there is a quadratic nonlinear relationship between ownership structure and corporate performance (Bai et al., 2005; McConnell & Servaes, 1990; Wu, 2002; Zhang & Zhang, 2004), the current study also used models (2) to (6) to examine whether there is a quadratic nonlinear relationship between the ownership structure of companies listed on the GEM board and their corporate performance by incorporating CR1×CR1, TS×TS, SS×SS, LS×LS and MS×MS.
ROA$%= α)+ β,TS$%+ β/SS$%+ β0LS$%+ β2MS$%+ β4CR1$%+ β7CR10$%+ β9Z$%
+β;(CR1$%×CR1$%) + β@INDUS$%+ β,)SIZE$%+ β,,DA$%+ ε$% (2)
ROA$%= α)+ β,TS$%+ β/SS$%+ β0LS$%+ β2MS$%+ β4CR1$%+ β7CR10$%+ β9Z$%
+β;(TS$%×TS$%) + β@INDUS$%+ β,)SIZE$%+ β,,DA$%+ ε$% (3)
ROA$%= α)+ β,TS$%+ β/SS$%+ β0LS$%+ β2MS$%+ β4CR1$%+ β7CR10$%+ β9Z$%
+β;(SS$%×SS$%) + β@INDUS$%+ β,)SIZE$%+ β,,DA$%+ ε$% (4)
ROA$%= α)+ β,TS$%+ β/SS$%+ β0LS$%+ β2MS$%+ β4CR1$%+ β7CR10$%+ β9Z$%
+β;(LS$%×LS$%) + β@INDUS$%+ β,)SIZE$%+ β,,DA$%+ ε$% (5) ROA$%= α)+ β,TS$%+ β/SS$%+ β0LS$%+ β2MS$%+ β4CR1$%+ β7CR10$%+ β9Z$%
4. DATA ANALYSIS
The study used the cross-sectional data of 153 companies listed on the GEM board for the period 2010 to 2012 for the descriptive analysis, and panel methodology to conduct regression analyses using Eviews 6.0 to estimate the models.
4.1 Descriptive Analysis
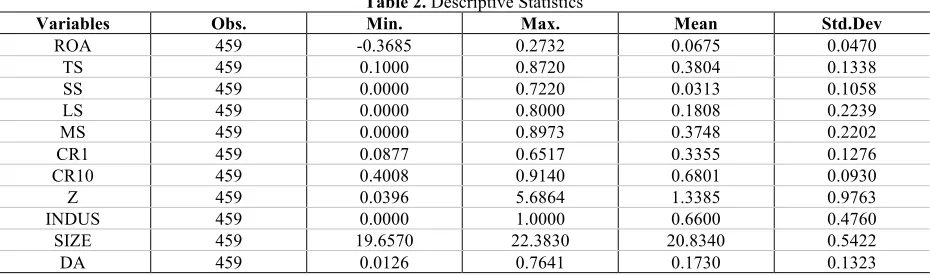
The descriptive statistics of the variables are displayed in Table 2.
Table 2. Descriptive Statistics
Variables Obs. Min. Max. Mean Std.Dev
ROA 459 -0.3685 0.2732 0.0675 0.0470
TS 459 0.1000 0.8720 0.3804 0.1338
SS 459 0.0000 0.7220 0.0313 0.1058
LS 459 0.0000 0.8000 0.1808 0.2239
MS 459 0.0000 0.8973 0.3748 0.2202
CR1 459 0.0877 0.6517 0.3355 0.1276
CR10 459 0.4008 0.9140 0.6801 0.0930
Z 459 0.0396 5.6864 1.3385 0.9763
INDUS 459 0.0000 1.0000 0.6600 0.4760
SIZE 459 19.6570 22.3830 20.8340 0.5422
DA 459 0.0126 0.7641 0.1730 0.1323
From Table 2, we know that:
• Firstly, for corporate performance, the average ROA is about 6.7%, indicating that companies listed on the GEM board report profitable overall performance. The large gap between minimum and maximum ROA values, however, shows the unbalanced development among the companies.
• Secondly, for ownership mix, Table 2 demonstrates that the float ratio of listed companies on the GEM board is about 38%, reflecting the low liquidity of stocks. The proportion of state-owned shares is about 3%, indicating the low engagement of state-owned shares in listed companies. The proportion of legal-person shares is not large and is about 18%. However, the mean value of managerial shares in listed companies is about 37%, which is larger than the participation found on the main board and the SME board (Hu & Jiang, 2004; Li & Wu, 2010; Lin, Xu, & Tang, 2009; Tan, He, & Ma, 2011). Thus, we concluded that having a high proportion of managerial shares is the prominent characteristic of Chinese companies listed on the GEM board.
Table 3. Regression of Ownership Structure and Corporate Performance (ROA)
Variables Coefficient Model(1) Std. Error Coefficient Model(2) Std. Error Coefficient Model(3) Std. Error
C (-4.7637) -2.9017*** 0.6091 (-4.4855) -2.9350*** 0.6530 (-4.8319) -2.9131*** 0.6030
TS -0.1412
***
0.0247 -0.1411
***
0.0247 -0.3549
***
0.0912
(-5.7260) (-5.7082) (-3.8921)
SS -0.2279
**
0.0950 -0.2288
**
0.0967 -0.2055
**
0.0944
(-2.4004) (-2.3995) (-2.1757)
LS -0.0366 0.0262 -0.0368 0.0263 -0.0298 0.0261
(-1.3966) (-1.3986) (-1.1410)
MS (-2.0302) -0.0649** 0.0320 (-2.0287) -0.0650** 0.0320 (-1.6801) -0.0537* 0.0320
CR1 (-0.5391) -0.3724 0.6909 (-0.0875) -0.1502 2.2652 (-0.3815) -0.2614 0.6853
CR10 (3.1170) 0.1779*** 0.0571 (3.1126) 0.1781*** 0.0577 (2.9574) 0.1675*** 0.0567
Z10 (-1.3388) -0.0236 0.0176 (-1.3091) -0.0233 0.0181 (-1.0375) -0.0182 0.0176
CR1×CR1 (-0.1415) -0.3110 3.4129
TS×TS 0.2839
**
0.1167 (2.4319)
SS×SS LS×LS MS×MS
SIZE 0.1521*** 0.0288 0.1520*** 0.0289 0.1523*** 0.0285
(5.2787) (5.2637) (5.3396)
DA -0.4080
***
0.0640 -0.4083
***
0.0640 -0.4017
***
0.0634
(-6.3761) (-6.3638) (-6.3359)
INDUS Yes Yes Yes
Adj. R2 0.5440 0.5420 0.5533
F-value 3.9303*** 3.8901*** 4.0238***
(Table 3 continued)
Variables Coefficient Model(4) Std. Error Coefficient Model(5) Std. Error Coefficient Model(6) Std. Error
C (-4.7215) -2.8803*** 0.6100 (-4.7256) -2.8866*** 0.6108 (-4.8099) -2.9355*** 0.6103
TS (-5.7597) -0.1424*** 0.0247 (-5.7120) -0.1411*** 0.0247 (-5.6967) -0.1406*** 0.0247
SS (-2.1775) -0.3241** 0.1488 (-2.4252) -0.2312** 0.0953 (-2.4481) -0.2329** 0.0951
LS -0.0369 0.0262 -0.0202 0.0422 -0.0364 0.0262
(-1.4054) (-0.4789) (-1.3869)
MS (-2.0161) -0.0645** 0.0320 (-2.0497) -0.0658* 0.0321 (0.3120) 0.0342 0.1097
CR1 (-0.5866) -0.4062 0.6925 (-0.6053) -0.4235 0.6996 (-0.5211) -0.3601 0.6911
CR10 (3.0896) 0.1765*** 0.0571 (3.0780) 0.1763*** 0.0573 (3.1060) 0.1773*** 0.0571
Z10 (-1.3469) -0.0237 0.0176 (-1.3406) -0.0236 0.0176 (-1.3395) -0.0236 0.0176
CR1×CR1 TS×TS
SS×SS (0.8392) 0.4088 0.4871
LS×LS -0.0244 0.0493
(-0.4960)
MS×MS (-0.9452) -0.1273 0.1346
SIZE 0.1515*** 0.0288 0.1522*** 0.0289 0.1529*** 0.0288
(5.2562) (5.2742) (5.3044)
DA (-6.3656) -0.4076*** 0.0640 (-6.3665) -0.4080*** 0.0641 (-6.4035) -0.4101*** 0.0640
INDUS Yes Yes Yes
Adj. R2 0.5434 0.5425 0.5437
F-value 3.9056*** 3.8952*** 3.9099***
D-W 2.2213 2.2273 2.2272
Notes: The F-test for fixed effects and the Hausman test for random effects both rejected the null hypothesis, and hence a fixed effect model is chosen for the study. T-statistics are reported in parentheses; ***, ** and * indicate significance at the 1%, 5% and 10% levels, respectively.
Furthermore, we observed that the debt ratio of companies listed on the GEM board is relatively low at a level of about 17%, which indicates that these companies mainly depend on equity capital and internal financing. The low debt ratio could also reveal that small and medium-sized enterprises are facing financing constraint to some extent.
4.2 Results and Discussion
We used Eviews 6.0 to conduct an overall regression on models (1) to (6)4. The results are presented in Table 3. In Table 3, we observe that the adjusted R2 of every model is about 0.55, which indicates that the models have a good degree of fit. The significance of the F-values reported also shows good effectiveness of the regression overall for all models. In the models above, the relationship between ownership structure and the ROA of companies listed on the GEM board is significant. Furthermore, the Durbin-Watson (D-W) values for the models are all around 2.2 (relatively close to 2.0), indicating that there is no serious autocorrelation. Based on the regression results in Table 3, the following extended analysis of model (1) to model (6) are provided:
4.2.1 Ownership Mix and Corporate Performance
From model (1), we can deduce that the proportion of tradable shares, state-owned shares and managerial shares has a significant correlation with corporate performance, while the proportion of legal-person shares is not significant. According to model (3) to model (6), the nonlinear relationship between ownership mix and corporate performance is not significant except for the tradable shares, which has a quadratic nonlinear relationship with corporate governance.
Firstly, the proportion of tradable shares has a negative correlation with corporate performance at a 1% significance level, so hypothesis 1.1 is not rejected. At the same time, there is a quadratic nonlinear relationship between tradable shares and corporate performance, showing that we should not generalize the relationship between tradable shares and corporate performance while there is a reasonable interval.
Secondly, the proportion of state-owned shares has a negative correlation with corporate performance at a 5% significance level, so hypothesis 1.2 is not rejected. From the analysis above, we can conclude that the participation of state-owned shares may result in low management efficiency and is therefore not beneficial to the improvement of corporate performance. The conclusion, however, may have something to do with the general low proportion of state-owned shares of companies listed on the GEM board.
Thirdly, the proportion of managerial shares has a negative correlation with corporate performance at a 5% significance level, so hypothesis 1.4 is not rejected. There is a high proportion of managerial shares in companies listed on the GEM board. However, when the proportion has reached a certain level, the equity incentive behavior accelerates management to pursue corporate control instead, and at that point, a high managerial shares proportion is not beneficial to corporate governance, but could also affect corporate performance negatively.
Lastly, the proportion of legal-person shares has a negative correlation with corporate performance, so hypothesis 1.3 is rejected although the correlation is not statistically significant. From the analyses presented above, we know that legal-person shares have multipartite advantages compared with individual shares and state-owned shares. However, because the ultimate goal of legal-person shareholders is to maximize their own personal profit, it is inevitable for legal-person shareholders to sacrifice company interest for their own benefit. Moreover, the irregular operation, related party transaction and internal transaction would cause harm to market fairness and fair competition. All of these would cause unsatisfactory corporate performance.
4.2.2 Ownership Concentration and Corporate Performance
According to model (1) and model (2) in Table 3, the shareholding proportion of the top 10 largest shareholders has a significant positive correlation with corporate performance at a 1% significance level. There is no significant linear relation or U-shape relation between the largest shareholder and corporate performance. Furthermore, the effect of the Z index on corporate performance is found not to be significant. An extended analysis of ownership concentration and corporate performance is provided below:
Firstly, we can observe that there is a negative but insignificant correlation between the shareholding proportion of the largest shareholder and corporate performance, so hypothesis 2.1 can be supported to some extent. A potential reason why the relationship is not significant could be that the more equity the largest shareholder holds, the less counterbalancing this shareholder will experience in decision-making and behavior. This lack of counterbalancing can easily lead to decision-making error and could damage minority shareholders’ interest, eventually harming the company’s development.
Lastly, the Z index has a negative correlation with corporate performance, so hypothesis 2.3 is rejected. The result shows that the counterbalancing of the largest shareholder does not benefit the improvement of corporate performance. The largest shareholder in companies listed on the GEM board may have extensive experience and a broad network, and have a dominant position in companies. Excessive counterbalance by the other large shareholders will influence the correctness and efficiency of the largest shareholder’s decision-making, and his or her role to play, which is not favorable to company development.
Meanwhile, except for the industry variable, the other two control variables both have a significant correlation with corporate performance. Company size has a positive correlation with corporate performance, while the debt ratio exhibits a negative correlation with corporate performance.
4.2.3 The Endogeneity of Ownership Structure
Previous studies have shown that no serious endogeneity problem with regard to ownership structure is observed for Chinese companies (Cai & Gao, 2010; Song, Zhang, & Li, 2004). The current study used model (7) below to verify whether an endogeneity problem was detected for the companies included in this study.
STO$%= α)+ β,ROA$%+ β/INDUS$%+ β0SIZE$%+ β2DA$%+ ε$% (7)
Where:
STO refers to variables of ownership structure. Owning to the space limitation, detailed results are not displayed here. The results, however, indicate that as a dependent variable, corporate performance has no significant relationship with ownership structure, that is, the endogeneity problem of ownership structure is not significant for companies listed on the GEM board.
4.2.4 Robustness Test
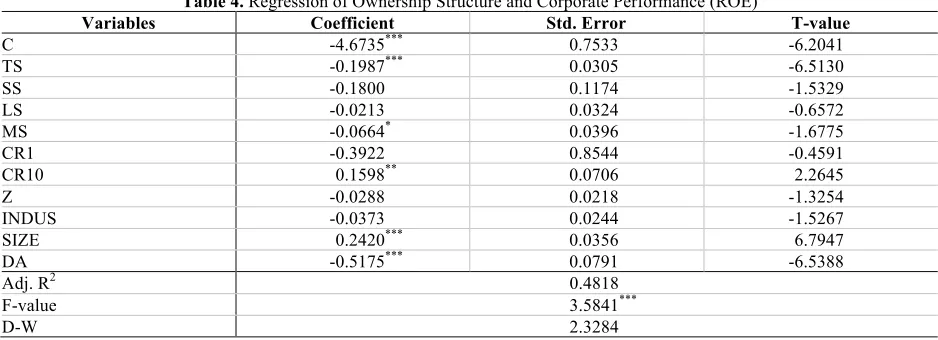
Model (8) below was constructed to test robustness by replacing ROA with return on equity (ROE) in model (1). The regression result is displayed in Table 4.
𝑅𝑂𝐸$%= α)+ β,TS$%+ β/SSJK+ β0LS$%+ β2MS$%+ β4CR1$%+ β7CR10$%+ β9Z$%
+β;INDUS$%+ β@SIZE$%+ β,)DA$%+ ε$% (8)
Table 4. Regression of Ownership Structure and Corporate Performance (ROE)
Variables Coefficient Std. Error T-value
C -4.6735*** 0.7533 -6.2041
TS -0.1987*** 0.0305 -6.5130
SS -0.1800 0.1174 -1.5329
LS -0.0213 0.0324 -0.6572
MS -0.0664* 0.0396 -1.6775
CR1 -0.3922 0.8544 -0.4591
CR10 0.1598** 0.0706 2.2645
Z -0.0288 0.0218 -1.3254
INDUS -0.0373 0.0244 -1.5267
SIZE 0.2420*** 0.0356 6.7947
DA -0.5175*** 0.0791 -6.5388
Adj. R2 0.4818
F-value 3.5841***
D-W 2.3284
Notes: The F-test for fixed effects and the Hausman test for random effects both rejected the null hypothesis, and hence a fixed effect model is chosen for the study. ***, ** and * indicate significance at the 1%, 5% and 10% levels respectively.
provide no support for state-owned shares and legal-person shares. As for ownership concentration, the shareholding proportion of the top 10 largest shareholders has a positive correlation with corporate performance at a 5% significance level, while the shareholding proportion of the largest shareholder and the Z index are not significant. The regression results of model (8) are similar to model (1), which indicates the robustness of the relationship between ownership structure and financial performance in the context of the Chinese GEM board for different estimations of performance.
5. CONCLUSIONS AND SUGGESTIONS
Taking 153 companies listed on the GEM board as research objects, the study reported here studied the relationship between ownership structure and corporate performance with the empirical analysis of data from 2010 to 2012. Our findings show that the proportion of state-owned shares and managerial shares has a negative correlation with corporate performance, that is, the higher these ownership proportions are, the worse the corporate performance becomes. In addition, tradable shares have a quadratic nonlinear correlation with corporate performance, and the relationship between legal-person shares and corporate performance is not significant. As for the relationship between ownership concentration and corporate performance, we found that only the share proportion of the top 10 largest shareholders has a significant positive correlation with corporate performance, while the relationships between the share proportion of the largest shareholder and corporate performance, and those between the Z index and corporate performance, are not significant. Based on these conclusions, some suggestions for the development of listed companies on the GEM board are provided below.
Firstly, institutional investors should be introduced. Presently, the majority of the tradable shareholders in China are individual investors, with the small and scattered characteristics of individual investors leading to their speculative behavior. Compared with individual investors, institutional investors have abundant capital, professional teams and more information channels, so their investing behavior is more rational and their investment cycle is more stable, which enables institutional investors to be both capable and motivated to monitor the companies they are investing in. Institutional investors’ involvement could also impel companies listed on the GEM board to optimize ownership structure and to improve corporate performance, should contribute to the stable and efficient operation of the GEM board and capital market.
Secondly, managerial shares should be allocated prudently. According to the results, it is obvious that managerial shares have a significant negative correlation with corporate performance. Listed companies should therefore treat stock incentives to management-level employees seriously. At the same time, companies need to build sound supervision mechanisms, aiming at effectively avoiding the negative effects associated with managerial shares.
Lastly, an appropriate ownership concentration and degree of balance for majority shareholders should be maintained. From the results, we can learn that companies should keep the proportion of majority shareholders in control to avoid individual extreme behavior and the domination of a single shareholder, to protect the interest of minority shareholders. Meanwhile, companies should optimize the proportion of shareholders to let ownership concentration be kept at an appropriate level so that the largest shareholder can play his or her role.
In addition, companies listed on the GEM board should take expanding their size and maintaining an appropriate debt ratio into consideration to promote their performance.
AUTHOR BIOGRAPHIES
Qiaowen Zhang is a PhD student in the Department of Business Management at Stellenbosch University (South Africa), and she is also a lecturer at the China-Africa International Business School at Zhejiang Normal University (China). Her research interests include corporate governance, institutional investors, entrepreneurial management, and China-Africa finance cooperation. E-mail: zhangqiaowencam@126.com
REFERENCES
Anderson, R. C., & Reeb, D. M. (2003). Founding-family ownership and firm performance: Evidence from the S&P 500. Journal of Finance, 58, 1301–1328.
Bai, C. E., Liu, Q., Lu, Z., Song, M., & Zhang, J. X. (2005). An empirical study on Chinese listed firms’ corporate governance.
Economic Research Journal, 2, 81–91.
Berle, A. A., & Means, G. C. (1932). The Modern Corporation and Private Property. New York: The Macmillan Company. Brown, L. D., & Caylor, M. L. (2009). Corporate governance and firm operating performance. Review of Quantitative Finance
and Accounting, 32, 129–144.
Cai, W. X., & Gao, M. H. (2010). Ultimate owner’s ownership, control rights and expropriation: Evidence from related-party transactions. South China Journal of Economics, 2, 28–41.
Chen, D. P., & Chen, Y. S. (2011). Research on relationship among ownership concentration, ownership balance and corporate performance: An empirical examination of listed companies on the SME board from 2007 to 2009. Accounting Research, 1, 38–43.
Chen, X. Y., & Xu, X. D. (2001). Equity structure, firm performance and the protection for investors’ interest. Economic Research Journal, 11, 3–11.
Cornett, M. M., Marcus, A. J., & Tehranian, H. (2008). Corporate governance and pay-for-performance: The impact of earnings management. Journal of Financial Economics, 2, 357–373.
Demsetz, H., & Villalonga, B. (2001). Ownership structure and corporate performance. Journal of Corporate Finance, 7, 209– 233.
Du, Y., & Liu, L. G. (2002). Ownership structure and corporate governance efficiency: Empirical evidence from Chinese listed companies. Management World, 11, 124–133.
Fama, E., & Jensen, M. (1983). Separation of ownership and control. Journal of Law and Economics, 2, 301–325. Fernandez, C., & Gomez, S. (2002). Does ownership structure affect firm performance? Evidence from a continental-type
governance system. Working Paper.
Gorton, G., & Schmid, F. A. (2000). Universal banking and the performance of German firms. Journal of Financial Economics, 1, 29–80.
Gugler, K., Mueller, D. C., & Yurtoglu, B. B. (2004). Corporate governance and the return on investment. Journal of Law and Economics, 2, 589–633.
Gursoy, G., & Aydogan, K. (2002). Equity ownership structure, risk taking, and performance. Emerging Markets, Finance and Trade, 6, 6–25.
Holderness, C. G., & Sheehan, D. P. (1988).The role of majority shareholders in publicly held corporations. Journal of Financial Economics, 20, 317–346.
Hu, G. L., & Jiang, G. Z. (2004). Ownership structure, corporate governance and performance: New evidence from the listed companies in China. Finance and Trade Research, 4, 83–89.
Jensen, M., & Meckling, W. (1976). Theory of the firm: managerial behavior, agency costs and ownership structure. Journal of Financial Economics, 3, 305–360.
Kong, A. G., & Wang, S. Q. (2003). The influence of ownership structure on corporate performance: An empirical study of China’s listed companies. Fudan Journal (Social Sciences), 5, 26–33.
Li, Z. L., & Wu, S. (2010). Ownership structure, board governance and corporate growth. Economy and Management, 5, 28–34. Lin, Z. G., Xu, H., & Tang, L. (2009). Shareholding structure, disclosure of internal control & enterprise value. Collected Essays
on Finance and Economics, 1, 68–74.
Lins, K., & Servaes, H. (2002). Is corporate diversification beneficial in emerging markets? Financial Management, 31, 5–31. Liu, G. L., & Wang, J. S. (2000). Positive analysis of listed companies: Equity structures, incentive systems, and performances.
Economic Theory and Business Management, 5, 40–45.
Liu, X. X. (2000). The impact of the structure of China industrial enterprise’s ownership on its efficiency. Economic Research Journal, 2, 17–25.
Liu, Y. G., & Gao, Y. N. (2007). Study on relationship between ownership balance and corporate performance of Chinese listed companies. Journal of Sun Yatsen University, 4, 102–108.
Liu, Y. Y., Huang, Z. X., Tse, E., & He, X. F. (2011). Empirical research on shareholding structure and corporate performance of Chinese listed companies. Research on Economics and Management, 2, 24–32.
Liu, Z. B. (2004). Study on capital structure and corporate performance of listed companies. Beijing: China Financial and Economic Publishing House.
McConnell, J., & Servaes, H. (1990). Additional evidence on equity ownership and corporate value. Journal of Financial Economics, 27, 595–612.
Pedersen, T., & Thomsen, S. (1999). Economic and systemic explanations of ownership concentration among Europe’s largest companies. International Journal of the Economics of Business, 6, 367–381.
She, J. H., & Hu, J. (2007). Positive analysis on ownership structure and corporate performance relationships for listed companies. Modern Economic Science, 1, 99–107.
Song, M., Zhang, J. X., & Li, C. T. (2004). A trap in the ownership structure for listed companies. Nankai Business Review, 1, 9– 23.
Su, D. W., & He, X. X. (2012). Ownership structure, corporate governance and productive efficiency. Journal of Productivity Analysis, 3, 303–318.
Sun, Y. X., & Huang, Z. H. (1999). Ownership structure and corporate performance of Chinese listed companies. Economic Research Journal, 12, 23–30.
Switzer, L. N. (2007). Corporate governance, Sarbanes-Oxley small-cap firm performance. Quarterly Review of Economics and Finance, 5, 651–666.
Tan, Q. M., He, J., & Ma, J. (2011). Board composition, ownership structure and firm performance. Journal of Finance and Economics, 5, 16–33.
Thomsen, S., & Pedersen, T. (2000). Ownership structure and economic performance in the largest European companies.
Strategic Management Journal, 6, 689–705.
Wahla, K-U-R., Shah, Z. A., & Hussain, Z. (2012). Impact of ownership structure on firm performance evidence from non-financial companies at Karachi Stock Exchange. International Research Journal of Finance and Economics, 84, 6–13. Wang, X. H., & Xu, J. (2009). Listed companies’ ownership structure, capital structure and corporate performance under
different growth opportunities: An empirical study based on China listed companies in distribution industry. Journal of Business Economics, 7, 20–28.
Wu, S. K. (2002). Ownership structure and firm performance: An empirical research on Chinese public companies. China Industry Economics, 1, 80–87.
Xu, E. M., & Wang, Z. H. (2000). On relation between the corporate governance of China’s public companies and their strategic performance. Nankai Management Review, 4, 4–14.
Xu, W., & Hu, D. Y. (2006). Equity ownership structure and corporate performance: An empirical study from the perspective of relative Tobin Q. Journal of Nanjing Normal University, 1, 59–64.
Xu, X. N., & Wang, Y. (1999). Ownership structure and corporate governance in Chinese stock companies. China Economic Review, 10, 75–98.
Xu, X. Y., & Zhang, L. D. (2008). Relations between ownership structure and corporate value – a subgroup text result. China Industry Economics, 4, 102–109.
Yan, R. S. (2009). A study on the relationship between ownership structure and corporate performance. Research on Financial and Economic Issues, 6, 80–83.
Yu, D. Z. (2001). Ownership structure, governance efficiency and corporate performance. China Industry Economics, 5, 54–62. Zhang, C., & Fang, P. (2009). An empirical study on relationship between performance and ownership structure of private listed
companies. Journal of Shanghai University (Social Sciences), 2, 90–105.
Zhang, H. J. (2000). Theoretical and empirical analysis on ownership structure and corporate performance of Chinese listed companies. Economic Science, 4, 34–44.
Zhang, J. X., & Zhang, H. (2004). Corporate performance, market value and governance structure of private listed companies.