RESEARCH
Zinc supplementation improves body
weight management, inflammatory
biomarkers and insulin resistance in individuals
with obesity: a randomized, placebo-controlled,
double-blind trial
Hoda Khorsandi
1, Omid Nikpayam
2,3, Reyhaneh Yousefi
1, Maryam Parandoosh
1, Nima Hosseinzadeh
4,
Atoosa Saidpour
1*and Arman Ghorbani
5Abstract
Background: The present study was designed to determine whether zinc supplementation would increase the effects of restricted calorie diet (RCD) on obesity.
Methods and materials: A randomized, double-blind clinical trial was performed on 40 obese subjects who were randomly assigned to receive zinc supplements (30 mg/day) or placebo for a period of 15-weeks. Both groups were under a restricted calorie diet (~ 300 kcal lower than the estimated energy requirement). Anthropometric measure-ments, biochemical markers, appetite, and dietary intakes were determined during the study period.
Results: The reductions of body weight, body mass index, waist circumference, and hip circumference were sig-nificantly higher in the zinc group compared to the placebo group (P = 0.032, 0.025, 0.003, and 0.0001, respectively). Lower levels of high sensitivity C-reactive protein, apelin, homeostatic model assessment of insulin resistance (HOMA-IR), and appetite score were observed in the zinc group in comparison with the placebo group (P = 0.0001, 0.001, 0.031 and 0.001 respectively).
Conclusion: This study indicates that Zn supplementation with a restricted calorie diet has favorable effects in reduc-ing anthropometric measurements, inflammatory markers, insulin resistance and appetite in individuals with obesity, and may play an effective role in the treatment of obesity.
Trial registration This clinical trial was registered at clinicaltrials.gov at the U.S. National Library of Medicine (NCT02516475).
Keywords: Zinc supplement, Obesity, Anthropometric measurements, hs-CRP, Insulin resistance
© The Author(s) 2019. This article is distributed under the terms of the Creative Commons Attribution 4.0 International License (http://creat iveco mmons .org/licen ses/by/4.0/), which permits unrestricted use, distribution, and reproduction in any medium, provided you give appropriate credit to the original author(s) and the source, provide a link to the Creative Commons license, and indicate if changes were made. The Creative Commons Public Domain Dedication waiver (http://creativecommons.org/ publicdomain/zero/1.0/) applies to the data made available in this article, unless otherwise stated.
Background
As the etiology of obesity is complex [1], current
inter-ventions for weight management are only modestly
successful [2]. Restricted calorie diets (RCD) are playing
a fundamental role in prevention and treatment of
obe-sity [3, 4]; but these diets often result in micronutrient
deficiencies [5]. Furthermore, obesity and obesity-related
inflammation are related to abnormal micronutrient
sta-tus [5–7]. Among these micronutrients, zinc (Zn)
defi-ciency is a common problem in obese individuals [8–10].
Furthermore, Zn has been reported as limiting nutrients
in RDCs [11]. Previous studies have also demonstrated
Open Access
*Correspondence: [email protected]; [email protected]
1 Department of Clinical Nutrition & Dietetics, National Nutrition
and Food Technology Research Institute, Faculty of Nutrition Sciences and Food Technology, Shahid Beheshti University of Medical Sciences, 46, West Arghavan St., Farahzadi Blvd., Shahrak Qods, P.O. Box 19395-4741, Tehran, Islamic Republic of Iran
that plasma Zn level and dietary intake of Zn are
insuf-ficient in obese individuals [12–14]. So, it seems that
further weight gain or development of obesity-related disorders may occur if the Zn deficiency is not
cor-rected [15]. Payahoo et al. [16] also showed that daily
intake of 30 mg Zn gluconate for 1 month decreased sig-nificantly body weight and body mass index (BMI). Two key assumptions about the possible mechanisms for the effects of Zn supplementation on weight loss are
includ-ing appetite regulation [17] and improving insulin
resist-ance (IR) [18, 19]. Another important aspect which worth
to notice is the beneficial effects of dietary intake of Zn
and plasma Zn level on inflammatory status [20, 21]. Zn
has shown possible anti-inflammatory effects through
cytokine signaling pathways [22] and the attenuation
of plasma levels of Interleukin-6 (IL-6), tumor necrosis
factor-α (TNF-α) and C-reactive protein (CRP) [23, 24].
Moreover, a growing body of literature has demonstrated that these inflammatory markers are directly or indirectly correlated with obesity-related IR through blocking the insulin signaling receptors activation in pancreatic β-cells
[25]. More recently, apelin is also proposed as an
adi-pokine mediator which might have an adaptive response to prevent chronic inflammation associated with obesity
[26, 27]. Previous reports also imply that higher
ape-lin levels are associated with both insuape-lin resistance and
chronic inflammation in individuals with obesity [28].
So, based on previous studies, low Zn concentration and high level of inflammatory markers maybe correlated to
high BMI [29, 30], and it seems reasonable to assume that
Zn supplementation may have favorable effects on weight loss or reversing obesity-related comorbidities such as IR. Therefore, this study was designed to evaluate the effects of daily intake of 30 mg Zn supplement along with RCD on anthropometric measurements, appetite, IR, and serum levels of inflammatory markers, apelin, and neuro-peptide Y (NPY), in obese individuals.
Materials and methods
Study design and participants
This double-blind randomized clinical trial was con-ducted from December 2015 to April 2016. In order
to detect a difference of 4.5 kg/m2 in the BMI and with
respect to a pooled standard deviation of 26.21 kg/m2,
obtaining from the study by Payahoo et al. [16], the
sam-ple size was calculated 20 subjects for each group. In this two-arm parallel study with two-tailed testing, a power
(1–β) of 80% and α = 0.05 was used. Fifty healthy adults
(men and women) with obesity and BMI more than
30 kg/m2 in the age range of 18–45 years were selected
using convenience sampling from the Specialized Clinic of Nutrition & Diet Therapy located at the Faculty of Nutrition Sciences and Food Technology of Shahid
Beheshti University of Medical Sciences in Tehran, Iran. In our study, exclusion criteria were the presence of preg-nancy or lactation, chronic kidney or hepatic disease, autoimmune and infectious disease, chronic inflamma-tory diseases, recent surgery, smoking, having weight loss diets in the last 2 months, the use of Zn, calcium, or iron supplements in the last 2 months, and taking antico-agulant drugs, lipid-lowering or beta-blocker drugs. The primary outcomes were anthropometric measurements, and secondary outcome were appetite score, serum lev-els of inflammatory markers, apelin, NPY, glucose, Zn and insulin, and IR. The study protocol was approved by the Ethics Committee of the National Nutrition and Food Technology Research Institute of Iran (IR.SBMU. nntri.Rec.1394.407). The study was in adherence with the Declaration of Helsinki. Written informed consent was obtained from all subjects before initiating the study. This clinical trial was registered at clinicaltrials.gov at the U.S. National Library of Medicine (NCT02516475).
Randomization
The subjects were randomly allocated to either a Zn or placebo group by block randomization. A trained dieti-tian completed the block randomization with a block size of 4 and possible balanced combinations with 2 P (pla-cebo) and 2 Z (Zn supplement) subjects, calculated as 6 blocks (ZZPP, PZPZ, PZZP, ZPZP, PPZZ, ZPPZ). Then, blocks were randomly chosen, using a simple random sampling method to determine the assignment of all the participants into the groups.
Intervention
During this study, subjects in the Zn group received 30 mg zinc sulfate as 1 capsule (between meals) while those in the placebo group received corresponding pla-cebo capsules containing starch (also between meals). All capsules were produced by Dineh Iran Company, Tehran, Iran. According to the literature, zinc supplement is safe
at a dose of 30 mg/day [31, 32]. Blinding was performed
by a trained dietician, and the patients and researchers were kept blinded to the allocation. In addition, subjects in both Zn and placebo groups received a restricted calo-rie diet (RCD) with ~ 300 kcal lower than the estimated energy requirement based on the Mifflin-St Jeor equation in order to reduce their weight about 1 kg per month, and this RCD contained ~ 55% carbohydrate, ~ 15%
protein and ~ 30% fat [33]. Adherence to the diet was
diet, their degree of compliance was determined and the data of individuals with the degree of compliance more than 90% were analyzed at the end of the study.
Dietary intakes and appetite assessments
Dietary intakes of participations were assessed using a 3-day dietary recall (2 weekdays and
1 weekend day) at baseline and at the end of week 15. Individuals’ diets were analyzed by Nutritionist IV soft-ware (N Squared Computing, San Bruno, CA, USA). Basal metabolic rate (BMR) was calculated based on
Mifflin and St Jeor et al. [34]. Underreporting was defined
as a ratio reported energy intake by 3-day dietary recall/
BMR < 1.1 [35]. Simplified nutritional appetite
ques-tionnaire (SNAQ), a valid 4-item quesques-tionnaire
recom-mended for clinical purposes [36], were used to assess the
appetite at baseline and week 15. The SNAQ items were as follows: #1, Appetite; #2, Feeling full; #3, Food tastes; #4, Feeling hunger, and the sum of the 4 items scores con-stitutes the total SNAQ score which ranges from 4 to 20. The total score of 4 to 14 and 15 to 20 indicates low and
normal appetite, respectively [36].
Anthropometric assessments
Weight was measured with minimum clothes and with-out shoes using a calibrated scale (Seca, CA, USA) and precision of 100 g. Height was measured using a wall-mounted stadiometer with the precision of 0.5 cm. Hip and waist circumference were also measured using an inflexible tapeline with the precision of 0.5 cm, in the narrowest circumference below the rib cage and above the umbilicus and the largest circumference between the
waist and knees, respectively [37]. BMI was calculated
as the ratio of weight (kg)/height2 (m2). Anthropometric
parameters were measured at baseline and at the end of weeks 7 and 15.
Physical activity assessment
Physical activity level was estimated using a valid and
reliable physical activity questionnaire [38] and
calculat-ing metabolic equivalent (MET) at baseline and the end of the study.
Blood samples and biochemical assessments
A sample of 5 ml blood was collected from all par-ticipants after a 12 to 14 h fast, at baseline and at the end of week 15. These samples were centrifuged at 4000 rpm for 15 min. The samples of serum were sepa-rated into small aliquots and were frozen at − 80 °C. For Zn analysis, all tubes were washed by acid and rinsed with distilled water, then atomic absorption spectrom-etry (variant Chemthech Analytical 2000) was used to
determine serum Zn concentration [39, 40]. Serum
con-centration of high-sensitivity C-reactive protein (hs-CRP) was determined by enzyme-linked immunosorbent assay (ELISA) kits (Diagnostics Biochem Canada, Ontario, Canada) with an intra-assay coefficient of variation (CV) of 7.2%. Serum TNF-α was measured by ELISA kits (Dia-clone, Besancon, France). Intra-assay CV for serum TNF-αwas 6.5%. Serum apelin concentration was assessed by ELISA kits (ZellBio GmbH, Ulm, Germany), with an intra-assay CV of 7.2%. Serum insulin was determined by ELISA kits (Monobind, USA), with an intra-assay CV of 7.4%. Serum glucosewas measured by commercial kits (Pars Azemoon, Tehran, Iran) with the aid of a Selectra 2 Autoanalyzer (Vital Scientific, Spankeren, The Nether-lands). Homeostatic Model Assessment of Insulin Resist-ance (HOMA-IR) was determined using the following equation:
Statistical analysis
Intention-to-treat principle was applied for anthropo-metric and dietary intake variables. Per-protocol analy-sis (PPA) was performed for analyzing the biochemical data. Data analysis was performed using SPSS version 20. The results are presented as mean (± SD) and fre-quency (percent) for quantitative and qualitative vari-ables, respectively. The Kolmogorov–Smirnov test was used to assess normal distribution of data. None normal data distribution has been presented as 25/75 IQR. Nat-ural log transformations on plasma Zn, insulin, TNF-α, NPY, apelin and HOMA-IR were transformed through Box-Cox transformation. To compare qualitative vari-ables between the two groups, the Chi square test was
used. We used a t test and paired t-test to compare
quan-titative parameters between and within groups, respec-tively. In addition, because anthropometric parameters were measured 3 times during the study, analysis of vari-ance for repeated measurements was used to compare data between various times. Analysis of covariance was performed in order to remove the effect of confounding
factors. In this study, P values of less than 0.05 were
con-sidered statistically significant.
Results
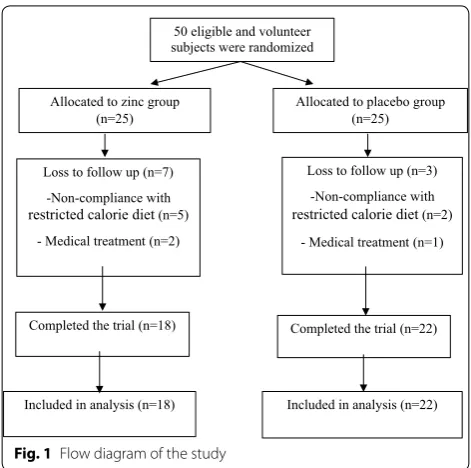
Of the 50 subjects initially enrolled, 10 subjects were eliminated because of non- compliance and medical
treatment (Fig. 1). The baseline characteristics of the
sub-jects did not differ significantly between the two groups
(Table 1).
HOMA-IR = Fasting serum glucosemg/dL
Dietary intakes and physical activity
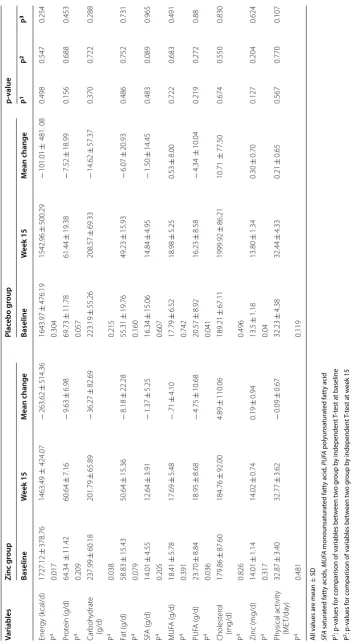
As is shown in Table 2, dietary intakes of energy, protein,
carbohydrate, fat, saturated fatty acids (SAFA), monoun-saturated fatty acids (MUFA), polyunmonoun-saturated fatty acids (PUFA), cholesterol, and Zn were not significantly differ-ent between the groups at baseline and the end of week 15. No significant changes were observed in physical activity levels between the two groups during the study.
Effects on anthropometric measurements
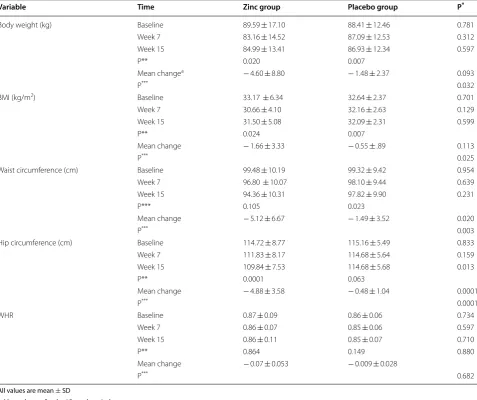
Weight, BMI, waist circumference and hip circumfer-ence decreased in both groups compared to baseline.
However, the reductions of weight (P = 0.032), BMI
(P = 0.025), waist circumference (P = 0.003) and hip
circumference (P = 0.0001) were significantly higher in
the Zn group than in the placebo group (Table 3). No
sig-nificant change was observed in WHR within each group
during the study (Table 3).
Effects on biochemical markers and appetite
Serum zinc concentration increased significantly in the Zn group at the end of week 15 compared with baseline
(P = 0.0001), whereas no significant change was observed
in the placebo group. The increment of serum zinc con-centration in the Zn group was significant in
compari-son with the placebo group (P = 0.002; Table 4). Serum
hs-CRP reduced significantly in the Zn group at the end
of week 15 in comparison with baseline (P = 0.0001),
whereas no significant change was observed in the pla-cebo group. The reduction of serum hs-CRP in the Zn group was significant in comparison with the placebo
group (P = .0001; Table 4). Serum TNF-α concentration
did not significantly change within each group during the
study (Table 4). Serum apelin reduced significantly in the
Zn group at the end of week 15 in comparison with
base-line (P = 0.042), whereas it increased significantly in the
placebo group (P = 0.001). The reduction of serum
ape-lin in the Zn group was significant in comparison with
the placebo group (P = 0.001; Table 4). Serum glucose
(P = 0.046) and insulin (P = 0.002) reduced significantly
in the Zn group at the end of week 15 in comparison with baseline. However, these reductions in the Zn group were not significant in comparison with the placebo. In addition, HOMA-IR decreased significantly in the Zn group at the end of week 15 in comparison with baseline
(P = 0.0001), whereas no significant change was observed
in the placebo group. The reduction of HOMA-IR in the Zn group was significant in comparison with the placebo
group (P = .031; Table 4). Serum NPY decreased in the
Zn group and this reduction was significant in
compari-son with the placebo group (Table 4; P = 0.048); however,
after statistical adjustment for age and calorie intake, the reduction of NPY in the Zn group was not significant in comparison with the placebo group. Appetite score decreased significantly in the Zn group at the end of
week 15 in comparison with baseline (P = 0.004), whereas
no significant change was observed in the placebo group. The reduction of appetite score in the Zn group was
sig-nificant in comparison with the placebo group (P = .001;
Table 4).
Discussion
In our study, mean serum zinc in the Zn group
(65.2 ± 5.9 µg/dL) was lower than normal range (70–
120 µg/dL) at baseline [41]. At the end of week 15, mean
serum zinc increased significantly in the Zn group
(75.4 ± 8.2 µg/dL), whereas no significant change was
50 eligible and volunteer subjects were randomized
Allocated to zinc group
(n=25) Allocated to placebo group (n=25)
Completed the trial (n=18) Completed the trial (n=22) Loss to follow up (n=3)
-Non-compliance with
restricted calorie diet(n=2) - Medical treatment (n=1) Loss to follow up (n=7)
-Non-compliance with
restricted calorie diet(n=5) - Medical treatment (n=2)
Included in analysis (n=18) Included in analysis (n=22)
Fig. 1 Flow diagram of the study
Table 1 Baseline characteristics of subjects in the Zinc and Placebo groups
a Values are mean ± SD
Characteristics Zinc (n = 18) Placebo (n = 22)
Age (years)a 35.63 ± 3.2 32.95 ± 1.7
Sex (n/%)
Male 6 (24%) 8 (32%) Female 19 (76%) 17 (68%) Past experiences with weight-reducing treatment (n/%)
Yes 15 (60%) 13 (52%) No 10 (40%) 12 (48%) Marital status (n/%)
Table 2 D ietar y in tak es and ph ysic al ac tivit
y in the Zinc and Plac
eb o gr oups A ll v alues ar e mean ± SD SFA sa tur at ed fa tt y acids , MUF A monounsa tur at ed fa tt y acid , PUF A polyunsa tur at ed fa tt y acid P
1: p
-v
alues f
or c
ompar
ison of v
ar iables bet w een t w o g roup b y independen t T -t est a t baseline P
2: p
-v
alues f
or c
ompar
ison of v
ar iables bet w een t w o g roup b y independen t T -t est a t w eek 15 P
3: p
-v
alues f
or c
ompar
ison of mean change of v
ar iables bet w een t w o g roup b y independen t T -t est P
4: p
-v
alues f
or c
ompar
ison of v
ar
iables within g
observed in the placebo group. In the present study, weight, BMI, waist circumference and hip circum-ference decreased in both groups compared to base-line. However, the reductions of these anthropometric parameters were significantly higher in the Zn group than in the placebo group. To our knowledge, this is the first study to evaluate the co-administration of Zn sup-plement and RCD in individuals with obesity. In
agree-ment with the present study, Payahoo et al. [16] showed
that daily administration of 30 mg zinc gluconate for 1 month reduced body weight, BMI and waist circum-ferences in the healthy obese adults. It is documented
that body weight management requires restricting energy intake, and increasing energy expenditure
[42]. No significant changes were observed in physical
activity levels between the two groups. In our study, although the difference in energy intake between the two groups was not statistically significant, the reduc-tion of energy intake was higher in the Zn group than in the placebo group. Based on previous studies, it seems that improvement in Zn status could have
ben-eficial effects on food intake regulation [43]. One of the
suggested mechanisms may be related to the favorable effect of improvement in Zn status on leptin regulation
Table 3 Anthropometric parameters in Zinc and Control groups
All values are mean ± SD
a Mean change for the 15-week period
P*: p-values for comparison of variables between two group by independent T-test
P**: p-values for comparison of variables within groups by analysis of variance for repeated measurement
P***: p-values for comparison between mean changes of variables by Analysis of covariance (adjusted for age, mean change of calorie intake, mean change of zinc intake)
Variable Time Zinc group Placebo group P*
Body weight (kg) Baseline 89.59 ± 17.10 88.41 ± 12.46 0.781 Week 7 83.16 ± 14.52 87.09 ± 12.53 0.312 Week 15 84.99 ± 13.41 86.93 ± 12.34 0.597
P** 0.020 0.007
Mean changea − 4.60 ± 8.80 − 1.48 ± 2.37 0.093
P*** 0.032
BMI (kg/m2) Baseline 33.17 ± 6.34 32.64 ± 2.37 0.701
Week 7 30.66 ± 4.10 32.16 ± 2.63 0.129 Week 15 31.50 ± 5.08 32.09 ± 2.31 0.599
P** 0.024 0.007
Mean change − 1.66 ± 3.33 − 0.55 ± .89 0.113
P*** 0.025
Waist circumference (cm) Baseline 99.48 ± 10.19 99.32 ± 9.42 0.954 Week 7 96.80 ± 10.07 98.10 ± 9.44 0.639 Week 15 94.36 ± 10.31 97.82 ± 9.90 0.231
P*** 0.105 0.023
Mean change − 5.12 ± 6.67 − 1.49 ± 3.52 0.020
P*** 0.003
Hip circumference (cm) Baseline 114.72 ± 8.77 115.16 ± 5.49 0.833 Week 7 111.83 ± 8.17 114.68 ± 5.64 0.159 Week 15 109.84 ± 7.53 114.68 ± 5.68 0.013
P** 0.0001 0.063
Mean change − 4.88 ± 3.58 − 0.48 ± 1.04 0.0001
P*** 0.0001
WHR Baseline 0.87 ± 0.09 0.86 ± 0.06 0.734 Week 7 0.86 ± 0.07 0.85 ± 0.06 0.597 Week 15 0.86 ± 0.11 0.85 ± 0.07 0.710
P** 0.864 0.149 0.880
Mean change − 0.07 ± 0.053 − 0.009 ± 0.028
Table 4 Bio chemic al mar kers and app etit
e in the Zinc and Plac
eb
o gr
oups
a V
alues ar
e geometr
ic mean (minimum, maximum)
b V
alues ar
e mean
±
SD
P
1: p
-v
alues f
or c
ompar
ison of v
ar
iables within g
roups b y P air ed T-t est P
2: p
-v
alues f
or c
ompar
ison of v
ar iables bet w een t w o g roups b y independen t T -t est a t baseline P
3: p
-v
alues f
or c
ompar
ison of v
ar iables bet w een t w o g roup b y independen t T -t est a t w eek15 P
4: p
-v
alues f
or c
ompar
ison of mean change of v
ar iables bet w een t w o g roup b y independen t T -t est P
5: p
-v alues f or c ompar ison bet w
een mean changes of v
ar
iables b
y A
naly
sis of c
ov ar ianc e (adjust ed f or age
, and mean change of calor
ie in take) Variables Zinc g roup Plac ebo g roup p-value Baseline W eek 15 M ean change Baseline W eek 15 M ean change P 2 P 3 P 4 P 5 Zinc (µg/dL) 1 65.2 ± 5.9 75.4 ± 8.2 10.2 ± 6.8 71.15 ± 13.2 68.15 ± 10 − 3 ± 13.1 0.086 0.018 0.0001 0.002 P 1 0.0001 0.296 hs-CRP (mg/L) 1 5.27 ± 2.93 b 3.37 ± 2.24 − 1.89 ± 1.60 4.75 ± 2.28 3.98 ± 2.04 − 0.07 ± 1.8 0.124 0.064 0.0001 0.0001 P 1 0.0001 0.60 TNF-α (pg/ml) 2
32.41 (10.92, 708.48)
a
30.43 (11.79, 546.19)
−
1.98
26.07 (13.19, 67.47)
25.07 (9.62, 94.65)
− 1.0 0.170 0.238 0.293 0.723 P 1 0.473 0.451 Apelin (pg/ml) 2
1568.20 (1119, 3282)
1245.13 (482, 2087)
−
323.07
1493.45 (505, 4467)
1683.32 (963, 3804)
189.87 0.805 0.017 0.002 0.001 P 1 0.042 0.001 FBS (mg/dL) 1 86.83 ± 11.94 83.50 ± 7.36 − 3.33 ± 6.56 86.90 ± 9.93 86.90 ± 13.42 0.00 ± 6.00 0.983 0.343 0.102 0.088 P 1 0.046 1.00 Insulin (micr oU/L) 2 5.91 (1.7,18.60) 4.05 (1,9.1) − 1.86
5.07 (1.8, 22.6)
5.08 (1.7, 27.2)
0.01 0.135 0.33 0.019 0.073 P 1 0.002 0.735 HOM A-IR 2
1.35 (0.37, 2.81)
0.83 (0.21, 2.27)
−
0.52
1.02 (0.41, 5.88)
1.08 (0.33, 9.27)
0.06 0.160 0.294 0.011 0.031 P 1 0.0001 0.757 NPY (ng/l) 2
306.1 (178.8, 1540.5)
273.8 (170.1, 1022.8)
−
32.27
400.9 (198.9, 2239.2)
411.6 (180.6, 1900.9)
for inhibiting eating behaviors through reduction in
neuropeptide Y mRNA level [44]. Zn deficiency and
obesity can lead to leptin resistance which may increase NPY levels in the hypothalamus of rodents and men
[45]. Previous findings also report that Zn deficiency
can cause a 50% increase in NPY levels [46], but despite
the higher level of NPY in Zn deficient rats, their food
intake is reduced because of NPY resistance [46, 47].
On the other hand, previous reports imply that Zn has an essential role in serotonin synthesis which
stimu-lates satiety and reduce food intake [48]. Based on our
knowledge, the functional role of zinc status in weight or appetite management of individuals with obe-sity has not been revealed. However, the role of lower
plasma zinc level in inhibiting TSH secretion [49] and
the involvement of zinc in the production, storage and
release of insulin were also previously showed [50]. So
it seems reasonable that zinc level may have an essen-tial role in weight or appetite management of individu-als with obesity. In our study, the baseline Zn level was
below than the normal range (70–120 µg/dL) [51] in
the Zn group; however, Zn levels turn to a normal sta-tus after the supplementation. In agreement with previ-ous studies, serum NPY decreased in the Zn group and this reduction was significant in comparison with the placebo group. In addition, appetite score decreased significantly in the Zn group at the end of week 15 in comparison with baseline, and this reduction was sig-nificant in comparison with the placebo group. Welch
et al. [52] also documented that NPY not only effect
on food intake but also seems to be associated with macronutrient selection, such a way that increase car-bohydrate intake. In agreement with Welch et al. study, carbohydrate and fat intakes were significantly reduced in the Zn group as compared to the placebo group in our study. In the present study, serum hs-CRP, an inflammatory marker, reduced significantly in the Zn group at the end of week 15 in comparison with base-line, and this reduction was significant in comparison with the placebo group. Inflammation is one of the
main complications of obesity [53] and weight loss
through dietary restriction may have a favorable effect
on obesity-related inflammatory status [54]. Selvin et al.
[55] suggested that a 1 kg weight loss through changes
in diet and lifestyle will lead to a 0.13 mg/L reduction in serum CRP level. In our study, Serum TNF-α con-centration did not significantly change in the Zn group.
In agreement with this study, Kim et al. [30] did not
find any significant reduction in serum TNF-α after a 8-week supplementation with Zn. In addition, serum
apelin, an adipose tissue inflammatory biomarker [28],
reduced significantly in the Zn group at the end of week 15 in comparison with baseline, and this reduction was
significant in comparison with the placebo group. To our knowledge, no studies to date have evaluated the effects of Zn supplementation on apelin levels; how-ever, some studies revealed that weight loss with RCD
can cause a significant reduction in apelin level [28,
56] which seems this reduction has been largely
attrib-uted to decreased inflammation or increased insulin
sensitivity [28, 55–62]. Serum glucose and
HOMA-IR reduced significantly in the Zn group at the end of week 15 in comparison with baseline. Insulin sensitiv-ity improvement is documented in previous weight loss
interventions using calorie restriction [57–59]. It has
been shown that a 5–10% weight loss increases insulin
sensitivity [60, 61]. However, the effectiveness of the Zn
supplementation on IR is controversial [18, 62, 63]. It
seems that zinc supplementation with longer duration has more favorable effects on IR or glucose tolerance
[64, 65]. One of the probable mechanisms for the
ben-eficial effects of Zn on IR may be related to decreased
inflammation [66]. Few studies have proposed that
higher levels of hs-CRP are associated with insulin
resistance and hyperinsulinemia [67–69]. Furthermore,
the role of apelin in the development of insulin resist-ance has also attracted a lot of attention in the recent
years [70, 71]. It has been shown that apelin level is
higher in insulin-resistant individuals and it has also been suggested that apelin can inhibit the insulin
secre-tion [70, 72, 73]. The proposed mechanisms for the role
of apelin in insulin sensitivity include direct effects on glucose uptake or insulin signaling pathways and
indi-rect effects on energy metabolism [28]. A limitation of
our study was the small sample size.
Conclusion
This study indicates that Zn supplementation with a restricted calorie diet has favorable effects in reducing anthropometric measurements, inflammatory markers, insulin resistance and appetite in individuals with obesity, and may play an effective role in the treatment of obesity.
Abbreviations
Zn: zinc; RCD: restricted calorie diet; HOMA-IR: homeostatic model assessment of insulin resistance; hs-CRP: high-sensitivity C-reactive protein; BMI: body mass index; IR: insulin resistance; IL-6: interleukin-6; TNF-α: tumor necrosis factor-α; NPY: neuropeptide Y; SNAQ: Simplified Nutritional Appetite Question-naire; MET: metabolic equivalent; PPA: per-protocol analysis; SAFA: saturated fatty acids; MUFA: monounsaturated fatty acids; PUFA: polyunsaturated fatty acids.
Acknowledgements
Authors’ contributions
HKH and AS had full access to all of the data in the study and took responsibil-ity for the integrresponsibil-ity of the data and the accuracy of data analysis. NH, RY and AS conceived and designed the study and provided administrative support. HKH, RY, NH, MP, and AS conducted the study. AS, ON wrote the manuscript. All authors read and approved the final manuscript.
Funding
This study was funded by the National Nutrition and Food Technology Research Institute of the Shahid Beheshti University of Medical Sciences in Tehran, Iran (Grant Number: IR.SBMU.nntri.Rec.1394.407)
Availability of data and materials
The datasets used and analyzed during the current study are available from the corresponding author on reasonable request.
Ethics approval and consent to participate
Awritten informed consent was obtained from all subjects before initiation of the study.
Consent for publication Not applicable.
Competing interests
The authors declare that they have no competing interests.
Author details
1 Department of Clinical Nutrition & Dietetics, National Nutrition and Food
Technology Research Institute, Faculty of Nutrition Sciences and Food Tech-nology, Shahid Beheshti University of Medical Sciences, 46, West Arghavan St., Farahzadi Blvd., Shahrak Qods, P.O. Box 19395-4741, Tehran, Islamic Republic
of Iran. 2 Student Research Committee, Nutrition Research Center, Tabriz
University of Medical Sciences, Tabriz, Iran. 3 Department of Clinical Nutrition,
Faculty of Nutrition and Food Science, Tabriz University of Medical Sciences,
Tabriz, Iran. 4 Faculty of Biostatistics, Shahid Beheshti University of Medical
Sciences, Tehran, Islamic Republic of Iran. 5 Department of Cellular and
Molec-ular Nutrition, Faculty of Nutrition Science and Food Technology, National Nutrition and Food Technology Research Institute, Shahid Beheshti University of Medical Sciences, Tehran, Iran.
Received: 24 September 2019 Accepted: 21 November 2019
References
1. Gamboa-Gomez CI, Rocha-Guzman NE, Gallegos-Infante JA, Moreno-Jimenez MR, Vazquez-Cabral BD, Gonzalez-Laredo RF. Plants with poten-tial use on obesity and its complications. EXCLI J. 2015;14:809–31. 2. Svetkey LP, Stevens VJ, Brantley PJ, Appel LJ, Hollis JF, Loria CM, et al.
Comparison of strategies for sustaining weight loss: the weight loss maintenance randomized controlled trial. JAMA. 2008;299:1139–48. 3. Piehowski KE, Preston AG, Miller DL, Nickols-Richardson SM. A
reduced-calorie dietary pattern including a daily sweet snack promotes body weight reduction and body composition improvements in premenopau-sal women who are overweight and obese: a pilot study. J Am Diet Assoc. 2011;111:1198–203.
4. Most J, Tosti V, Redman LM, Fontana L. Calorie restriction in humans: an update. Ageing Res Rev. 2017;39:36–45.
5. Cheng HL, Griffin HJ, Bryant CE, Rooney KB, Steinbeck KS, O’Connor HT. Impact of diet and weight loss on iron and zinc status in overweight and obese young women. Asia Pac J Clin Nutr. 2013;22:574–82.
6. Cheng HL, Bryant C, Cook R, O’Connor H, Rooney K, Steinbeck K. The relationship between obesity and hypoferraemia in adults: a systematic review. Obes Rev. 2012;13:150–61.
7. García OP, Ronquillo D, del Carmen Caamaño M, Martínez G, Camacho M, López V, et al. Zinc, iron and vitamins A, C and E are associated with obesity, inflammation, lipid profile and insulin resistance in Mexican school-aged children. Nutrients. 2013;5:5012–30.
8. Farsani GM, Targhi FZ, Pishgahroudsari M, Mokhber S, Pazouki A. High prevalence of zinc deficiency in Iranian morbid obese patients undergo-ing bariatric surgery. J Minim Invasive Surg Sci. 2015;4:e33347. 9. Esposito K, Pontillo A, Di Palo C, Giugliano G, Masella M, Marfella R, et al.
Effect of weight loss and lifestyle changes on vascular inflammatory markers in obese women: a randomized trial. JAMA. 2003;289:1799–804. 10. Ishikawa Y, Kudo H, Kagawa Y, Sakamoto S. Increased plasma levels of zinc
in obese adult females on a weight-loss program based on a hypocaloric balanced diet. In Vivo. 2005;19:1035–7.
11. Helen O, Munas Z, Griffin H, Rooney K, Cheng HL, Steinbeck K. Nutritional adequacy of energy restricted diets for young obese women. Asia Pac J Clin Nutr. 2011;20:206–11.
12. Damms-Machado A, Weser G, Bischoff SC. Micronutrient deficiency in obese subjects undergoing low calorie diet. Nutr J. 2012;11:34. 13. Kimmons JE, Blanck HM, Tohill BC, Zhang J, Khan LK. Associations
between body mass index and the prevalence of low micronutrient levels among US adults. Med Gen Med. 2006;8:59.
14. Marreiro DDN, Fisberg M, Cozzolino SMF. Zinc nutritional status in obese children and adolescents. Biol Trace Elem Res. 2002;86:107–22. 15. Kaidar-Person O, Person B, Szomstein S, Rosenthal RJ. Nutritional
deficien-cies in morbidly obese patients: a new form of malnutrition? Obes Surg. 2008;18:870–6.
16. Payahoo L, Ostadrahimi A, Mobasseri M, Bishak YK, Farrin N, Jafarabadi MA, et al. Effects of zinc supplementation on the anthropometric meas-urements, lipid profiles and fasting blood glucose in the healthy obese adults. Adv Pharm Bull. 2013;3:161.
17. do Nascimento Marreiro D, Geloneze B, Tambascia MA, Lerário AC, Halpern A, Cozzolino SMF. Effect of zinc supplementation on serum leptin levels and insulin resistance of obese women. Biol Trace Elem Res. 2006;112:109–18.
18. Cruz KJC, de Oliveira ARS, Morais JBS, Severo JS, Mendes PMV, de Sousa Melo SR, et al. Zinc and insulin resistance: biochemical and molecular aspects. Biol Trace Elem Res. 2018;186:407–12.
19. Haase H, Maret W. Protein tyrosine phosphatases as targets of the combined insulinomimetic effects of zinc and oxidants. Biometals. 2005;18:333–8.
20. Olechnowicz J, Tinkov A, Skalny A, Suliburska J. Zinc status is associated with inflammation, oxidative stress, lipid, and glucose metabolism. J Physiol Sci. 2017;68:19–31.
21. Mantzoros CS, Prasad AS, Beck FW, Grabowski S, Kaplan J, Adair C, et al. Zinc may regulate serum leptin concentrations in humans. J Am Coll Nutr. 1998;17:270–5.
22. Bonaventura P, Benedetti G, Albarede F, Miossec P. Zinc and its role in immunity and inflammation. Autoimmun Rev. 2015;14:277–85. 23. Prasad AS. Zinc: role in immunity, oxidative stress and chronic
inflamma-tion. Curr Opin Clin Nutr Metab Care. 2009;12:646–52.
24. Foster M, Petocz P, Samman S. Inflammation markers predict zinc trans-porter gene expression in women with type 2 diabetes mellitus. J Nutr Biochem. 2013;24:1655–61.
25. Rehman K, Akash MSH. Mechanisms of inflammatory responses and development of insulin resistance: how are they interlinked? J Biomed Sci. 2016;23:87.
26. Lago F, Dieguez C, Gomez-Reino J, Gualillo O. Adipokines as emerging mediators of immune response and inflammation. Nat Clin Pract Rheu-matol. 2007;3:716–24.
27. Antushevich H, Wójcik M. Apelin in disease. Clin Chim Acta. 2018;483:241–8.
28. Krist J, Wieder K, Klöting N, Oberbach A, Kralisch S, Wiesner T, et al. Effects of weight loss and exercise on apelin serum concentrations and adipose tissue expression in human obesity. Obes Facts. 2013;6:57–69. 29. García OP, Long KZ, Rosado JL. Impact of micronutrient deficiencies on
obesity. Nutr Rev. 2009;67:559–72.
30. Kim J, Ahn J. Effect of zinc supplementation on inflammatory mark-ers and adipokines in young obese women. Biol Trace Elem Res. 2014;157:101–6.
31. Maret W, Sandstead HH. Zinc requirements and the risks and benefits of zinc supplementation. J Trace Elem Med Biol. 2006;20:3–18.
32. Prasad AS. Impact of the discovery of human zinc deficiency on health. J Am Coll Nutr. 2009;28:257–65.
34. Mifflin MD, St Jeor ST, Hill LA, Scott BJ, Daugherty SA, Koh YO. A new predictive equation for resting energy expenditure in healthy individuals. Am J Clin Nutr. 1990;51:241–7.
35. Goldberg G, Black A, Jebb S, Cole T, Murgatroyd P, Coward W, et al. Critical evaluation of energy intake data using fundamental principles of energy physiology: 1. Derivation of cut-off limits to identify under-recording. Eur J Clin Nutr. 1991;45:569–81.
36. Wilson MM, Thomas DR, Rubenstein LZ, Chibnall JT, Anderson S, Baxi A, et al. Appetite assessment: simple appetite questionnaire predicts weight loss in community-dwelling adults and nursing home residents. Am J Clin Nutr. 2005;82:1074–81.
37. Mahan LK, EHammond K. Dietary and clinical assessment. Krause’s food and nutrition therapy; 2000, p. 372.
38. Aadahl M, JØrgensen T. Validation of a new self-report instrument for measuring physical activity. Med Sci Sports Exerc. 2003;35:1196–202. 39. Chou D. Clinical guide to laboratory tests. JAMA. 1984;251:2587–8. 40. Bishop ML, Fody EP, Schoeff LE. Clinical chemistry: principles, techniques,
and correlations. Philadelphia: Lippincott Williams & Wilkins; 2013. 41. Smith J, Butrimovitz G, Purdy W. Direct measurement of zinc in plasma by
atomic absorption spectroscopy. Clin Chem. 1979;25:1487–91. 42. Chong PW, Beah ZM, Grube B, Riede L. IQP-GC-101 reduces body weight
and body fat mass: a randomized, double-blind, placebo-controlled study. Phytother Res. 2014;28:1520–6.
43. Jing M-Y, Sun J-Y, Weng X-Y. Insights on zinc regulation of food intake and macronutrient selection. Biol Trace Elem Res. 2007;115:187–94. 44. Costarelli L, Muti E, Malavolta M, Cipriano C, Giacconi R, Tesei S, et al.
Distinctive modulation of inflammatory and metabolic parameters in relation to zinc nutritional status in adult overweight/obese subjects. J Nutr Biochem. 2010;21:432–7.
45. Baltaci AK, Mogulkoc R. Leptin and zinc relation: in regulation of food intake and immunity. Indian J Endocrinol Metab. 2012;16:S611. 46. Lee RG, Rains TM, Tovar-Palacio C, Beverly JL, Shay NF. Zinc deficiency
increases hypothalamic neuropeptide Y and neuropeptide Y mRNA levels and does not block neuropeptide Y-induced feeding in rats. J Nutr. 1998;128:1218–23.
47. Selvais PL, Labuche C, Ninh NX, Ketelslegers JM, Denef JF, Maiter DM. Cyclic feeding behaviour and changes in hypothalamic galanin and neuropeptide Y gene expression induced by zinc deficiency in the rat. J Neuroendocrinol. 1997;9:55–62.
48. Johnson S. Micronutrient accumulation and depletion in schizo-phrenia, epilepsy, autism and Parkinson’s disease? Med Hypotheses. 2001;56:641–5.
49. Baltaci AK, Mogulkoc R, Kul A, Bediz CS, Ugur A. Opposite effects of zinc and melatonin on thyroid hormones in rats. Toxicology. 2004;195:69–75. 50. Robertson R, Zhou H, Slucca M. A role for zinc in pancreatic islet β-cell
cross-talk with the α-cell during hypoglycaemia. Diabetes Obes Metab. 2011;13:106–11.
51. Mashhadi MA, Bakhshipour A, Zakeri Z, Ansari-Moghadam A. Reference range for zinc level in young healthy population in southeast of Iran. Health Scope. 2017;6:e18181.
52. Welch CC, Grace MK, Billington CJ, Levine AS. Preference and diet type affect macronutrient selection after morphine, NPY, norepinephrine, and deprivation. Am J Physiol. 1994;266:R426–33.
53. Lago F, Dieguez C, Gómez-Reino J, Gualillo O. Adipokines as emerging mediators of immune response and inflammation. Nat Rev Rheumatol. 2007;3:716.
54. Rodríguez-Hernández H, Simental-Mendía LE, Rodríguez-Ramírez G, Reyes-Romero MA. Obesity and inflammation: epidemiology, risk
fac-tors, and markers of inflammation. Int J Endocrinol. 2013. https ://doi.
org/10.1155/2013/67815 9.
55. Selvin E, Paynter NP, Erlinger TP. The effect of weight loss on C-reactive protein: a systematic review. Arch Intern Med. 2007;167:31–9. 56. Heinonen M, Laaksonen D, Karhu T, Karhunen L, Laitinen T, Kainulainen
S, et al. Effect of diet-induced weight loss on plasma apelin and cytokine
levels in individuals with the metabolic syndrome. Nutr Metab Cardiovasc Dis. 2009;19:626–33.
57. Weickert MO. Nutritional modulation of insulin resistance. Scientifica. 2012;2012:424780.
58. Straznicky NE, Lambert EA, Grima MT, Eikelis N, Richards K, Nestel PJ, et al. The effects of dietary weight loss on indices of norepinephrine turnover: modulatory influence of hyperinsulinemia. Obesity (Silver Spring, Md). 2014;22:652–62.
59. Weiss EP, Albert SG, Reeds DN, Kress KS, Ezekiel UR, McDaniel JL, et al. Calorie Restriction and Matched Weight Loss From Exercise: independ-ent and Additive Effects on Glucoregulation and the Incretin System in Overweight Women and Men. Diabetes Care. 2015;38:1253–62. 60. Weiss EP, Racette SB, Villareal DT, Fontana L, Steger-May K, Schechtman
KB, et al. Improvements in glucose tolerance and insulin action induced by increasing energy expenditure or decreasing energy intake: a rand-omized controlled trial. Am J Clin Nutr. 2006;84:1033–42.
61. Tuomilehto J, Lindstrom J, Eriksson JG, Valle TT, Hamalainen H, Ilanne-Parikka P, et al. Prevention of type 2 diabetes mellitus by changes in lifestyle among subjects with impaired glucose tolerance. N Engl J Med. 2001;344:1343–50.
62. Kim J, Lee S. Effect of zinc supplementation on insulin resistance and metabolic risk factors in obese Korean women. Nutr Res Pract. 2012;6:221–5.
63. Kelishadi R, Hashemipour M, Adeli K, Tavakoli N, Movahedian-Attar A, Shapouri J, et al. Effect of zinc supplementation on markers of insulin resistance, oxidative stress, and inflammation among prepubescent chil-dren with metabolic syndrome. Metab Syndr Relat Disord. 2010;8:505–10. 64. Ranasinghe P, Jayawardena R, Pigera A, Katulanda P, Constantine GR,
Galappaththy P. Zinc supplementation in pre-diabetes: study protocol for a randomized controlled trial. Trials. 2013;14:52.
65. Islam MR, Attia J, Ali L, McEvoy M, Selim S, Sibbritt D, et al. Zinc sup-plementation for improving glucose handling in pre-diabetes: a double blind randomized placebo controlled pilot study. Diabetes Res Clin Pract. 2016;115:39–46.
66. Chen L, Chen R, Wang H, Liang F. Mechanisms linking inflammation to insulin resistance. Int J Endocrinol. 2015;2015:9.
67. Gelaye B, Revilla L, Lopez T, Suarez L, Sanchez SE, Hevner K, et al. Associa-tion between insulin resistance and c-reactive protein among Peruvian adults. Diabetol Metab Syndr. 2010;2:30.
68. Preethi B, Kumar KP, Jaisri G, Suresh K. High-sensitivity C-reactive protein a surrogate marker of insulin resistance. J Physiol Pathophysiol. 2013;4:29–36.
69. Yang JS, Gerber JN, You HJ. Association between fasting insulin and high-sensitivity C reactive protein in Korean adults. BMJ Open Sport ExerMed. 2017;3:e000236-e.
70. Xu S, Tsao PS, Yue P. Apelin and insulin resistance: another arrow for the quiver? J Diabetes. 2011;3:225–31.
71. Li L, Yang G, Li Q, Tang Y, Yang M, Yang H, et al. Changes and relations of circulating visfatin, apelin, and resistin levels in normal, impaired glucose tolerance, and type 2 diabetic subjects. Exp Clin Endocrinol Diabetes. 2006;114:544–8.
72. Yue P, Jin H, Aillaud M, Deng AC, Azuma J, Asagami T, et al. Apelin is nec-essary for the maintenance of insulin sensitivity. Am J Physiol Endocrinol Metab. 2010;298:E59–67.
73. Assaad SN, El-Aghoury AA, El-Sharkawy EM, Azzam EZ, Salah MA. Study of serum apelin and its relation to obesity-associated hypertension. Egypt J Obes Diabetes Endocrinol. 2015;1:28.
Publisher’s Note