R E S E A R C H A R T I C L E
Open Access
Proton nuclear magnetic resonance and pattern
recognition analysis of liver extracts from rats
under different anesthetics
Tomoyuki Tajima
1*, Keiko Hirakawa
2, Hiroshi Kawaguchi
1and Atsuhiro Sakamoto
1Abstract
Background:Although general anesthesia is widely used in the surgical arena, the mechanisms by which general anesthetics act remain unclear. We previously described alterations in gene expression ratios in hepatic tissue taken from rats treated with anesthetics. Consequently, it is considered that anesthetics influence liver metabolism. Thus, the goal of this study was to use pattern recognition analysis of proton nuclear magnetic resonance spectra to visualize changes in liver metabolic phenotypes in response to widely used intravenous anesthetics (propofol and dexmedetomidine) and inhalational anesthetics (sevoflurane and isoflurane).
Methods:Rats were randomized into 13 groups (n = 6 in each group), and each group received one of following agents: propofol, dexmedetomidine, sevoflurane, isoflurane, or no anesthetic (control group). The liver was directly removed from rats immediately after or 24 h or 48 h after a 6-h period of anesthesia. Hydrophilic compounds were extracted from the liver and were analyzed with proton nuclear magnetic resonance spectroscopy. All spectral data were processed and analyzed by principal component analysis for comparison of metabolite profiles.
Results:Data were visualized by plotting principal component (PC) scores. In the plots, each point represents an individual sample. Each group was clustered separately on the plots, and the PC scores of the propofol group were clearly distinct from those of the control group and other anesthetic groups. The difference in PC scores was more pronounced immediately after completion of anesthesia when compared with 24 or 48 h after completion of anesthesia. Although the effect of intravenous anesthetics on the liver dissipated over time, the effect of inhalational anesthetics persisted.
Conclusions:Propofol, dexmedetomidine, sevoflurane and isoflurane exert different effects on liver metabolism. In particular, liver metabolism was markedly altered after exposure to propofol. The effect of anesthesia on the liver under propofol or dexmedetomidine resolved rapidly when compared with the effect under sevoflurane or isoflurane.
Background
General anesthesia is widely used in the surgical arena, with good efficacy and safety demonstrated for a variety of agents, including sevoflurane [1], isoflurane [2], pro-pofol [3], and dexmedetomidine [4]. However, the mechanisms by which these agents act remain unclear. We previously reported that anesthetic agents altered the gene expression ratios in rat livers [5], which suggest that these agents can influence hepatic metabolism.
Sevoflurane and isoflurane are inhalational anesthetics. They have low solubilities in blood and tissues (resulting in rapid recovery from anesthesia), and are frequently used. Propofol is the most commonly used intravenous anesthetic and is administered as an alkylphenol formu-lated in a lipid emulsion [6]. Propofol provides rapid and smooth induction of anesthesia and exhibits rapid clear-ance from the body. Dexmedetomidine is an ideal intra-venous anesthetic. It is a highly selective α2-adrenergic
agonist, produces sedation, hypnosis, and analgesia, and has a minimal effect on respiration. Dexmedetomidine is rapidly metabolized in the liver and is excreted in both the urine and feces.
* Correspondence:[email protected] 1
Department of Anesthesiology, Nippon Medical School, Bunkyo-ku, Tokyo, Japan
Full list of author information is available at the end of the article
We previously used microarray analyses to show that anesthesia under sevoflurane affected expression ratios of 177 of 10,000 genes in various organs from rats [7]. The highest number of altered genes was detected in the liver and included several genes encoding drug-metabolizing enzymes (DMEs). Furthermore, we investi-gated the expression ratios of eight genes encoding DMEs that showed the greatest alterations among the affected genes in the liver [5]. We also investigated changes in brain metabolic phenotypes in response to anesthetics by means of a metabolomics study and demonstrated that intravenous and inhalational anes-thetics exert differential effects on brain metabolism under anesthesia [8].
Metabolomics is defined as“the exhaustive analysis of endogenous metabolites”. Metabolomics can reveal pro-files of endogenous low molecular weight metabolites and can measure dynamic multiparametric responses of living systems to internal and external influences [9]. The main analytical techniques employed for metabolo-mic studies are based on proton nuclear magnetic reson-ance (1H-NMR) spectroscopic analysis. To interpret 1 H-NMR digitized spectra data, pattern recognition analysis was used in the present study. One of the most useful and easily applied pattern recognition analyses is princi-pal component analysis (PCA). Moreover, 1H-NMR spectroscopy is the only method that can measure many types of metabolites in a tissue or in an organism nonin-vasively and nondestructively.
The liver plays an important role in drug metabolism, and anesthetics change liver metabolism. Clarification of the different effects of different anesthetics on liver me-tabolism is important and could provide useful informa-tion with regards to the rainforma-tional selecinforma-tion of anesthetics for clinical use. The purpose of this study was to com-pare metabolic responses of the liver to anesthesia with representative inhalational (sevoflurane, isoflurane) and intravenous (propofol, dexmedetomidine) anesthetics using pattern recognition 1H-NMR spectroscopy with multivariate analyses.
Methods
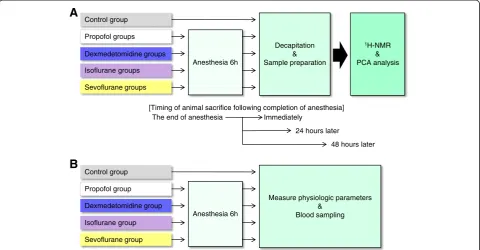
The flow chart of the experimental protocol is shown in Figure 1. A previous study model [8] on acquisition of data, data processing and statistical analysis of 1H-NMR data was used.
Animals and preparation
The animal protocol was approved by the Animal Ex-perimental Ethics Review Committee of Nippon Medical School and involved 9-week-old male Wistar rats weigh-ing 300 ± 20 g (Saitama Experimental Animals Supply, Saitama, Japan). A venous catheter was inserted into the tail vein of all rats, and rats was housed in individual
plastic cages (45 × 32 × 23 cm). Rats were anesthetized for 6 h with sevoflurane, isoflurane, propofol or dexme-detomidine, and animals were sacrificed immediately after completion of anesthesia (0-h time-point) or 24 or 48 h later (24 or 48-h time-points). Rats undergoing inhalational anesthesia were placed in plastic boxes sup-plied with sevoflurane (Maruishi Pharmaceutical, Osaka, Japan; 2.4% gas-air mixture) [10] or isoflurane (Abbot Japan, Tokyo, Japan; 1.5% gas-air mixture) [11] at a rate of 6 L/min (33% oxygen), and normal saline was admi-nistered via a venous catheter at a rate of 1 mL/h. Rats undergoing intravenous anesthesia were housed in plas-tic boxes supplied with 33% oxygen at a rate of 6 L/min and were administered propofol (AstraZeneca, Osaka, Japan; 600 μg/kg/min) [12] or dexmedetomidine (Hos-pira Japan, Osaka, Japan; 1μg/kg/min) [13] via a venous catheter at a rate of 1 mL/h. All rats were allowed to breathe spontaneously.
Rats were randomly assigned to 1 of 13 groups (n = 6 per group; one control group and 12 anesthesia groups). Four anesthesia groups (sevoflurane, isoflurane, propofol or dexmedetomidine group) were divided into three sub-groups, according to the time of animal sacrifice (imme-diately after completion of anesthesia or 24 or 48 h later). In the control group, rats were housed in individ-ual plastic cages (45 × 32 × 23 cm) and were not given any anesthetics. These animals were not given access to feed, and they were sacrificed 6 h later. The left lateral lobe of the liver was extracted from each sacrificed rat within 1 min after death, and livers were immediately frozen in liquid nitrogen and stored at−80°C.
Physiological parameters
Physiological variables were measured in the five separ-ate groups not taken for liver metabolic evaluation (n = 6 each), including those treated with isoflurane, sevoflur-ane, propofol, dexmedetomidine, or no anesthetic (con-trol group) (Figure 1B). For all rats, a catheter was inserted into the tail vein, and lactated Ringer’s solution was infused continuously at 10 mL/kg/h. During the ex-periment, each rat was placed into a plastic cage (45 × 32 × 23 cm). All rats were supplied with 33% oxygen and were allowed to breathe spontaneously. Body temperature was maintained at 37°C with a heat lamp. Anesthetics were administered as described above. An arterial catheter was placed in the left femoral artery in all rats to draw blood samples for measurement of arter-ial PO2, arterial PCO2, arterial blood pH, plasma glucose
blood samples were taken 6 h after the induction of anesthesia.
Sample preparation
Neutral extraction was performed according to the method described by Yoshioka et al. [14]. The method described by Folch [15] was originally designed for ex-traction of hydrophobic substances, but this method is also useful for extracting low molecular weight hydro-philic organic compounds, essentially without any in vitro modifications, oxidation hydrolysis or decom-position. Frozen tissue samples were ground and pulver-ized into a fine powder in liquid nitrogen using a frozen cell crusher (Cryo-PressTM, Microtec, Chiba, Japan) and some of the fine powder (approximately 1.0 g) was then homogenized in 10 mL of a chloroform/methanol (2:1) mixture. After removing the residues by filtration, 1 mL of distilled water was then added to the filtrates. After thoroughly mixing, they were left to stand for 24 h at 4° C to separate the hydrophilic phase layer from the hydrophobic phase. The hydrophilic phase was evapo-rated in an evacuated centrifuge overnight. Dried extracts were reconstituted in 0.6 mL of deuterium oxide (D2O) (ISOTEC Inc., Laurenceville, NJ, USA) containing
0.25 mM sodium (3-trimethylsilyl) tetradeuteriopropio-nate-2,2,3,3-d4 (TMSP) (MSD Isotopes, Montreal, Canada) and then were pipette into 5-mm NMR tubes (Wilmad-LabGlass, Buena, NJ, USA) for subsequent NMR measurements. D2O provided a deuterium field
frequency lock for the NMR spectrometer, while TMSP provided an internal chemical shift reference (δ= 0.00). The pH of the sample solutions was 7.2 to 7.4.
Acquisition of proton nuclear magnetic resonance data
Solution state1H NMR spectroscopy was performed at a proton resonance frequency of 300 MHz using an ECX NMR spectrometer interfaced with a TH5 probe (normal geometry, auto tunable type) equipped with an auto-matic 16-position sample changer and DeltaTM NMR processing and control software (version 4.3.2, JEOL Ltd., Tokyo, Japan). Two different1H NMR spectra were acquired for each sample. In all cases, the water reson-ance was suppressed using a conventional presaturation pulse sequence for the water (HDO) proton signal sup-pression based on homo-gated irradiation and dante pulse sequence (presaturation time = 2 s, dante pulse = 8 μs, dante interval = 0.1 ms, dante loop = 185, dante at-tenuator = 24dB). Standard one-dimensional (1D) spectra were acquired using a 45° pulse, 5,580-Hz spectral width, a relaxation delay of 2.0 s between pulses (repetition time = 3.47 s), and 400 transients. Two-dimensional J RES spectra were collected using a double spin echo se-quence with 48 transients. This method yields good in-formation on the multiplicity and coupling patterns of resonances, which facilitates molecule identification. The appropriate projection of this spectrum onto the chem-ical shift axis yields a fingerprint of peaks from only the most highly mobile small molecules, with the added Control group
Propofol groups
Dexmedetomidine groups
Isoflurane groups
Sevoflurane groups
Anesthesia 6h
1H-NMR
& PCA analysis Decapitation
& Sample preparation
[Timing of animal sacrifice following completion of anesthesia] The end of anesthesia Immediately
24 hours later
48 hours later
A
B
Control group
Propofol group
Dexmedetomidine group
Isoflurane group
Sevoflurane group
Anesthesia 6h
Measure physiologic parameters &
Blood sampling
Figure 1Flow chart of the experimental protocol. (A)Experimental protocol of1H-NMR and PC analysis.(B)Experimental protocol for
benefit that all of the spin coupling peak multiplicities have been removed.
Data processing and reduction
The resultant spectra were processed using Alice2TM, version 5.5 (JEOL DATUM Ltd., Tokyo, Japan). Free in-duction decays (FIDs) were subjected to an exponential weighting function of 0.5 Hz, Fourier transformed from the time to frequency domain, and then phased manu-ally, followed by linear baseline correction and referen-cing to the TMSP singlet at 0.00 ppm.
To simplify the 1H NMR spectra of the tissues by means of data compression, all spectra were integrated between 0.5 and 9.5 ppm using an integration macro written within the Alice2 for MetabolomeTM, version 1.0 (JEOL DATUM Ltd., Tokyo, Japan) software package, which integrated the spectrum into 215 segments (buck-ets) with 0.04 ppm integral regions. Regions containing resonances of residual water (4.6 ppm to 5.0 ppm) were excluded before integration. Close inspection of the im-portant integral regions for pattern recognition identified some cases where one resonance straddled two or more integral buckets, and therefore, these integral regions were corrected manually combining or extending the regions to include one resonance in a single integral re-gion. Other regions that largely consisted of noise were excluded to produce more significant multivariate map-ping. Finally, all the spectral data were reduced into 186 buckets. To account for the bulk mass differences be-tween samples, each spectral region was normalized to the sum of all of the integrals of the buckets.
Assignments of metabolites in the 1H NMR spectra were made by comparing the proton chemical shifts with literature values [16,17] and by comparison with spectra of authentic compounds via an in-house spectral database.
Multivariate analysis and statistical analysis
Calculated results obtained from all measured spectra were exported to a spreadsheet as a text file, which was then used as the input into the pattern recognition/
multivariate statistics software package for non-biased metabolic profiling. Datasets were imported into the ADMEWORKS/ModelBuilderTM software, version 4.5 (Fujitsu Kyushu Systems Ltd., Fukuoka, Japan) software package. All data were mean-centered, and a multicolli-nearity test and genetic-algorithm were used to identify the buckets that included the resonances from key meta-bolites that differed among the groups. Using the selected bucket data, PCA was performed to discern the presence of inherent similarities between spectral pro-files. Data were visualized using the PC score and load-ing plots. PCA was used to examine trends and clustering in an unsupervised manner. In this analysis, the algorithm calculates the maximum amount of corre-lated variation in a data set and scores each spectrum according to this variation along PC1. This procedure is repeated for other components until the majority of the variations in the data set are described. Being an un-supervised method, spectra are grouped according to the highest amount of variance in the data set, regardless of the group of each sample. For each type of analysis, data were visualized by plotting PC scores. In the plots, each point represents an individual sample. The plots allow the recognition of clusters of samples with similar scores. Each score plot has an associated loading profile, which helps in identifying the spectral regions (metabo-lites responsible for the sample clustering observed).
An analysis of variance (ANOVA) test was used to compare physiological variables between the experimen-tal and control groups. P < 0.01 was considered to be statistically significant. Data are given as the mean ±
standard deviation (SD).
Results
Physiological parameters in control and anesthetized rats
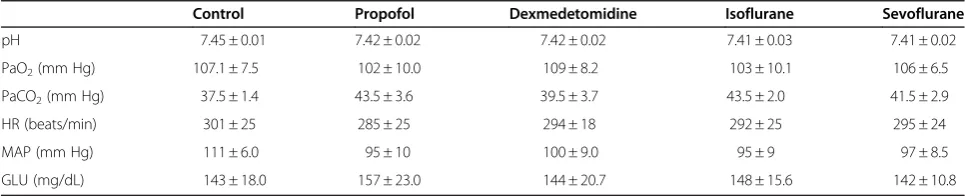
Physiologic parameters were observed in control and anesthetized rats (Table 1). There were no significant differences in pH, PaO2, PaCO2, heart rate, mean arter-ial pressure or plasma glucose concentration between groups.
Table 1 Physiological Parameters in Control and Anesthetized Rats
Control Propofol Dexmedetomidine Isoflurane Sevoflurane
pH 7.45 ± 0.01 7.42 ± 0.02 7.42 ± 0.02 7.41 ± 0.03 7.41 ± 0.02
PaO2(mm Hg) 107.1 ± 7.5 102 ± 10.0 109 ± 8.2 103 ± 10.1 106 ± 6.5
PaCO2(mm Hg) 37.5 ± 1.4 43.5 ± 3.6 39.5 ± 3.7 43.5 ± 2.0 41.5 ± 2.9
HR (beats/min) 301 ± 25 285 ± 25 294 ± 18 292 ± 25 295 ± 24
MAP (mm Hg) 111 ± 6.0 95 ± 10 100 ± 9.0 95 ± 9 97 ± 8.5
GLU (mg/dL) 143 ± 18.0 157 ± 23.0 144 ± 20.7 148 ± 15.6 142 ± 10.8
Data represent mean ± SD for six animals in each group. Low mean blood pressure and high PCO2were observed following the administration of anesthetic
Proton NMR of hydrophilic liver extracts in control rats
A typical proton NMR spectrum of hydrophilic extracts from rat livers in the control group is shown in Figure 2. Assignments of metabolites in the1H NMR spectra were made by comparing the proton chemical shifts with lit-erature values [16,17] and by comparison with spectra of authentic compounds via an in-house spectral database.
PCA score plots
A PCA score plot (PC1 vs. PC2) of hydrophilic liver extracts from rats sacrificed immediately after anesthesia is shown in Figure 3A. PCA is a multivariate technique that reduces highly dimensional data into only a few PCs, which are variables created from the linear combi-nations of the starting variables with appropriate weight-ing coefficients. The first PC (PC1) contains the largest part of the variance of the data set. In this manner, the data can be reduced into two dimensions, which allows graphic representation of data trends. The plots for the intravenous anesthetic groups (propofol and dexmedeto-midine) and inhalational anesthetic groups (isoflurane and sevoflurane) were divided into separate clusters. In particular, the propofol group was separated from the other groups in the direction to PC1 dominantly. The dexmedetomidine group was separated from the other groups in the direction to PC2. By contrast, the
separation of data clusters was subtler when comparing the inhalational anesthetic groups and the control group.
PC loading plots of individual data sets
Loading plots for PC1 vs. PC2 corresponding to Figure 3A are shown in Figure 3B and Figure 3C, re-spectively. Loading plots show the relative contribution to the PCs of the original variable. The numbers in the loading plots indicate the center value of each of the in-tegral area as follows: 1.19 and 1.22 ppm (3-D-hydroxy-butyrate (3-D-HB)), 1.32 and 1.35 ppm (lactate), 2.40 ppm (succinate), 2.46 ppm (glutamine), 3.20 ppm (cho-line), 3.22 ppm (choline, phosphocho(cho-line), 3.24 ppm (glycerophosphorylcholine (GPC)), 3.28 ppm (trimethy-lamine-N-oxide (TMAO)), 3.43 ppm (taurine), 3.75 (mannitol), 3.91 (betaine) and 3.30-4.00 ppm (glucose). TMAO was most effective metabolite that separated the PC scores in the PC1 direction. GPC was also effective in separation in the PC2 direction.
PCA score plots over time
Changes in liver metabolism were observed over time. The PCA score plot revealed that the differences be-tween anesthetized groups get into trifle with time (Figure 4A-4C). Consequently, liver metabolism was compared among different groups at the 0-h time-point. On the other hand, the PC scores at the 24-h time-point
TMAO
TMAO
TMSP
0 0.5
1.0 1.5
2.0 2.5
3.0 3.5
4.0
1.0 1.5
2.0 2.5
3.0 3.5
4.0
4.0 4.5
5.0 5.5
6.0 6.5
7.0 7.5
8.0
PPM
Glucose
Cho/Pcho
Ala Lac
3-D-HB Succinate
Gln
GSH/Gln/Glu
Ace Lys
Lac -Glucose
Glycogen
Leu
Val GPC
-Glucose His
Inosine/adenosine Nicotinurate
Asp Cho taurine
mannitol
betaine
showed that the effect of intravenous anesthetics on the liver resolved quickly when compared to the effect of inhalational anesthetics (Figure 4B).
Discussion
The present study demonstrated that different liver metabolic phenotypes result from exposure to different types of anesthetic agents. In particular, the liver meta-bolic phenotype after exposure to propofol was markedly
different from that after exposure to other anesthetic agents. However, the differences in liver metabolic phenotype between anesthetics decreased over time.
In this study, experiments were conducted using intra-venous anesthetics (propofol and dexmedetomidine) and inhaled anesthetics (isoflurane and sevoflurane). These anesthetics are extensively used in everyday clinical prac-tice. Metabolomic changes in the livers of rats anesthe-tized with one minimum alveolar concentration of inhaled
Control Propofol
Dexmedetomidine Sevoflurane Isoflurane
A
C
0 5 10
PC1 (68.6 %)
15
PC2 (15.0 %)
0
20 5
10
-5
-10
-5 -10
PC1
PC2
0 1.0
1.0
3.28 3.24
3.22
3.91
3.20 3.75
1.22
3.43 3.56
-0.4 -0.2 0 0.2 0.4 0.6 0.8 1
3.99 3.91 3.85 3.83 3.79 3.77 3.75 3.67 3.59 3.56 3.52 3.50 3.47 3.45 3.43 3.42 3.41 3.40 3.38 3.28 3.25 3.24 3.22 3.20 2.46 2.40 1.38 1.35 1.32 1.22 1.19 -0.5
0 0.5 1
Chemical shift (ppm)
PC2 (15.0%)
PC1 (68.6%)
B
anesthetics (sevoflurane at 2.4%, isoflurane at 1.5%) [10,11] or with continuous infusion of intravenous anes-thetics (propofol at 600μg/kg/min, dexmedetomidine at 1 μg/kg/min) [12,13] were investigated. Infusion of propofol at 600 μg/kg/min is a median effective dose (ED50) for rats. These doses were chosen because lower doses may not induce adequate anesthesia and because higher doses can produce hemodynamic changes that can independ-ently alter liver metabolism. In a previous study of changes in brain metabolism over time in response to anesthetics, rats were anesthetized for 2 h and at 6 h [8]; the 6-h anesthesia groups exhibited clear metabolic changes. Therefore, in the present study, it was thought that 6 h was a sufficient time period to produce metabolic changes, but sufficiently short to prevent any toxicity.
Separation of PCA scores between the different groups was related to differences in 3-D-HB, choline, phospho-choline, GPC, TMAO, taurine, mannitol, betaine and
glucose levels (Figure 3C). 3-D-HB is a ketone body derived from fatty acids metabolism in liver mitochon-dria (lipidβ-oxidation). In the context of hepatic insuffi-ciency, lipid β-oxidation and gluconeogenesis accelerates, and acetyl-coenzyme A (acetyl-CoA) derived from glycolysis and lipid β-oxidation exceeds the cap-acity of the Krebs cycle [18,19]. Normally, ketone bodies are transported from the liver to other tissues, where they can be reconverted to acetyl-CoA to produce en-ergy; impairment of the Krebs cycle leads to increased release of ketone bodies from the liver as fuel for other tissues [20].
A change in the level of hepatic glucose in anesthe-tized rats suggests an alteration in the rate of glycogen-olysis and glycolysis that is consistent with mitochondrial impairment, and can lead to an inability to use pyruvate in the Krebs cycle and to enhancement of anaerobic metabolism [21]. Thus, the changes of
3-D-12 6
0 0
-6
PC1
PC2
PC1 PC1
0
0
A
B
6
0
-6
PC2
PC2
0 6
-6
-6 -6 -6
6 6
6 12
12
C
-12
-12 -12
3.20 0
3.28 3.24
1 0.8
3.22
1 0
0.4
3.28
3.20 3.22
PC1
PC2
3.28 1
3.20 0.4
0 3.22
PC1 PC1
PC2
PC2
HB and glucose likely reflect a general decrease in en-ergy metabolism.
In addition, rats were not fed during this study. Thus, it is possible that changes in the level of glucose, manni-tol and taurine may have resulted from the fasting state. Among the four anesthetics administered in this study, only propofol can provide calories due to its fat content. Indeed, propofol is a 1% fat preparation, which corre-sponds with 1.1 kcal/mL and a total of 7.3 kcal adminis-tered to rats during this study. Mannitol is a sugar alcohol, while taurine is related to bile acids and diges-tion. Thus, the fasting state may also affect levels of those substances.
Choline and phosphocholine are metabolic products of phosphatidylcholine, which is a major membrane con-stituent. GPC is also a membrane constituent, while TMAO is a product of choline degradation. Betaine helps to maintain cellular osmotic pressure when the cell membrane damaged. Increased levels of choline, phos-phocholine, GPC, TMAO and betaine are associated with cell membrane disruption [22].
Changes of endogenous metabolites in hepatic tissue suggest that propofol was the most influential anesthetic on hepatic energy metabolism among the four anes-thetics administered in the present study. PC scores showed that TMAO was the most effective metabolite that separated the propofol group from the other groups in the PC1 direction (Figure 3A, 3B, 3C). The dexmede-tomidine group was separately clustered from the other groups, but the extent of the difference on the PCA plot was smaller than the difference between the propofol group and the other groups. PC scores showed that GPC was effective in separation of the dexmedetomidine group from the other groups in the PC2 direction (Figure 3A, 3B, 3C). It is possible that the intravenous anesthetics affected the metabolism in the liver by differ-ent mechanisms. There was little difference in hepatic metabolites when comparing the inhalational anesthetic groups to the control group. However, the effect of inha-lational anesthetics persisted at the 24-h time point while the effect of intravenous anesthetics on the liver resolved over time (Figure 4B), suggesting that propofol and dex-medetomidine were metabolized rapidly when compared with sevoflurane and isoflurane. The loading plot included in Figure 4A-4C remained static over time, and at the 48-h time-point, PCA plots were mixed, and the difference between groups became unclear (Figure 4C).
Sevoflurane and isoflurane are metabolized by hepatic cytochrome P450 CYP2E1 [23], and hepatotoxicity is rarely seen with these two agents [24-27]. In a previous study, there were no significant differences in liver func-tion or total hepatic blood flow when comparing sevo-flurane and isosevo-flurane anesthesia [28]. This finding is consistent with observations from the present study, in
which PCA scores were relatively similar when compar-ing the inhalational anesthetic groups and the control group. Indeed, investigators have suggested that liver function is relatively preserved with inhalational anes-thetics when compared with intravenous anesanes-thetics [29,30].
Propofol is rapidly metabolized in the liver by conjuga-tion to glucuronide and sulfate to produce water-soluble compounds, and 68.3% of these compounds are excreted in the urine within 24 h [31]. Dexmedetomidine is rap-idly distributed and extensively metabolized in the liver. It undergoes conjugation (41%), N-methylation (21%) or hydroxylation followed by conjugation, and 85% of the resulting compounds are excreted in the urine within 24 h [32,33]. Some reports suggest that dexmedetomidine preserves blood flow to the most vital organs (e.g., brain, heart, liver, kidneys) [34] and that there is no difference in clearance of indocyanine green or hepatic blood flow when comparing propofol and dexmedetomidine [32,35]. By contrast, the PCA scores in the present study suggest that propofol has a larger effect on hepatic metabolism when compared with dexmedetomidine.
In previous studies, propofol administration did not affect hepatic arterial blood flow [36], but increase total liver blood flow, portal tributary blood flow, and hepatic oxygen consumption [37]. The increase in oxygen con-sumption may reflect an increase in hepatic metabolic activity during the clearance of propofol and reflect propofol-induced changes in hepatic metabolism. Previ-ous studies reported that the expression ratios of genes encoding DMEs were elevated under anesthesia and that the expression ratio of Ugt1a7 (a gene encoding DME) was elevated under propofol anesthesia. Ugt1a7 is bio-transformation enzyme of the glucuronidation pathway that transforms small lipophilic molecules into water-soluble excretable metabolites [38], and propofol is mainly metabolized by glucuronidation in the liver. In addition, propofol is administered as an emulsion con-sisting of soybean oil, glycerol, and purified egg phos-phatide, which may also affect hepatic metabolism. Further, propofol delivers calories in the form of fat, which may result in differences from other anesthetics and control groups on PCA in this study.
To investigate the utility of1H-NMR for clinical appli-cations, the hydrophilic fraction of the rat liver extracts were analyzed in this study. When the metabolic state is investigated for clinical purposes, the major target is the hydrophilic fraction. The extracted endogenous metabo-lites in the present study may have utility as a marker of liver metabolism, thereby enhancing the clinical utility of1H-NMR.
the patterns of spectra using chemometric methods to visualize the metabolic phenotypes of the samples. Fur-ther investigations that target individual metabolites with refined analysis may be of benefit.
In the present study, metabolite profiling of the liver showed that anesthesia with propofol, dexmedetomidine, sevoflurane and isoflurane exerted different effects on rat liver metabolism. Although analysis of metabolic sub-stances from the liver after exposure to various drugs has been conducted [39], an exhaustive analysis of liver metabolites after exposure to anesthetics has not previ-ously been reported. Thus, the results from this study may enhance the clinical use of anesthetics.
Conclusions
In conclusion, pattern recognition analysis of 1H-NMR of liver tissue under anesthesia revealed that propofol, dexmedetomidine, sevoflurane and isoflurane exert dif-ferent effects on rat liver metabolism. In particular, liver metabolism was markedly altered after exposure to pro-pofol. The inclusion of fat within the propofol prepar-ation may contribute to this finding. Further, the effects of intravenous anesthetics (propofol, dexmedetomidine) resolved rapidly when compared with the effects of inha-lational anesthetics (sevoflurane, isoflurane).
Abbreviations
DMEs: Drug-metabolizing enzymes; GPC: Glyserophosphorylcholine; H-NMR: Proton nuclear magnetic resonance; PCA: Principal component analysis; 3-D-HB: 3-D-hydroxybutyrate; TMAO: Trimethylamine-N-oxide; TMSP: Tetradeuteriopropionate-2,2,3,3-d4.
Competing interests
The authors declare that they have no competing interests.
Authors' contributions
TT and AS conceived and designed the experiments. TT, KH and HK performed the experiments. TT and KH analyzed the data. TT contributed reagents, materials, and analysis tools. TT wrote the paper. All authors read and approved the final manuscript.
Acknowledgements
We are grateful to Prof. K. Koike (Kyoto University), Prof. Y. Ohno (Nippon Medical School) and the technical staff of the NMR laboratory at Nippon Medical School for their advice.
This study was supported by a Grant-in-Aid for Scientific Researches (20591820) from the Ministry of Education, Culture, Sports, Science and Technology (MEXT), Japan.
Author details
1Department of Anesthesiology, Nippon Medical School, Bunkyo-ku, Tokyo, Japan.2NMR Laboratory and Department of Legal Medicine, Nippon Medical School, Bunkyo-ku, Tokyo, Japan.
Received: 5 April 2012 Accepted: 13 August 2012 Published: 16 August 2012
References
1. Mazze RI:The safety of sevoflurane in humans.Anesthesiology1992, 77:1062–1063.
2. Levy WJ:Clinical anaesthesia with isoflurane. A review of the multicentre study.Br J Anaesth1984,56(Suppl 1):101S–112S.
3. Marik PE:Propofol: therapeutic indications and side-effects.Curr Pharm Des2004,10:3639–3649.
4. Gerlach AT, Dasta JF:Dexmedetomidine: an updated review.Ann Pharmacother2007,41:245–252.
5. Nakazato K, Yoshida Y, Takemori K, Kobayashi K, Sakamoto A:Expressions of genes encoding drug-metabolizing enzymes are altered after
sevoflurane, isoflurane, propofol or dexmedetomidine anesthesia.
Biomed Res2009,30:17–24.
6. Simons PJ, Cockshott ID, Douglas EJ, Gordon EA, Hopkins K, Rowland M: Disposition in male volunteers of a subanaesthetic intravenous dose of an oil in water emulsion of 14C-propofol.Xenobiotica1988,18:429–440. 7. Sakamoto A, Imai J, Nishikawa A, Honma R, Ito E, Yanagisawa Y, Kawamura
M, Ogawa R, Watanabe S:Influence of inhalation anesthesia assessed by comprehensive gene expression profiling.Gene2005,356:39–48. 8. Kawaguchi H, Hirakawa K, Miyauchi K, Ohno Y, Sakamoto A:Pattern
recognition analysis of proton nuclear magnetic resonance spectra of brain tissue extracts from rats anesthetized with propofol or isoflurane.
PLoS One2010,5:e11172.
9. Nicholson JK, Lindon JC, Holmes E:'Metabonomics': understanding the metabolic responses of living systems to pathophysiological stimuli via multivariate statistical analysis of biological NMR spectroscopic data.
Xenobiotica1999,29:1181–1189.
10. Obal D, Preckel B, Scharbatke H, Mullenheim J, Hoterkes F, Thamer V, Schlack W:One MAC of sevoflurane provides protection against reperfusion injury in the rat heart in vivo.Br J Anaesth2001,87:905–911. 11. Shichino T, Murakawa M, Adachi T, Adrai T, Miyazaki Y, Mori K:Effects of
inhalation anaesthetics on the release of acetylcholine in the rat cerebral cortex in vivo.Br J Anaesth1998,80:365–370.
12. Orth M, Barter L, Dominguez C, Atherley R, Carstens E, Antognini JF: Halothane and propofol differentially affect electroencephalographic responses to noxious stimulation.Br J Anaesth2005,95:477–484. 13. Bol CJJG, Danhof M, Stanski DR, Mandema JW:
Pharmacokinetic-pharmacodynamic characterization of the cardiovascular, hypnotic, EEG and ventilatory responses to dexmedetomidine in the rat.J Pharmacol Exp Ther1997,283:1051–1058.
14. Yoshioka Y, Masuda T, Nakano H, Miura H, Nakaya S, Itazawa S, Kubokawa M:In vitro 1H-NMR spectroscopic analysis of metabolites in fast- and slow-twitch muscles of young rats.Magn Reson Med Sci2002,1:7–13. 15. Folch J, Rebaron FN:The chemistry of the phosphoinositides.Can J
Biochem Physiol1956,34:305–319.
16. Bollard ME, Garrod S, Holmes E, Lindon JC, Humpfer E, Spraul M, Nicholson JK:High-resolution (1)H and (1)H-(13)C magic angle spinning NMR spectroscopy of rat liver.Magn Reson Med2000,44:201–207.
17. Martinez-Granados B, Monleon D, Martinez-Bisbal MC, Rodrigo JM, del Olmo J, Lluch P, Ferrandez A, Marti-Bonmati L, Celda B:Metabolite identification in human liver needle biopsies by high-resolution magic angle spinning 1H NMR spectroscopy.NMR Biomed2006,19:90–100.
18. McGarry JD, Boyd ME, Foster DW:Regulation of hepatic fatty acid oxidation and ketone body production.Annu Rev Biochem1980, 49:395–420.
19. Wu H, Zhang X, Li Z, Wu Y, Pei F:Comparison of metabolic profiles from serum from hepatotoxin-treated rats by nuclear-magnetic-resonance-spectroscopy-based metabonomic analysis.Anal Biochem2005, 340:99–105.
20. Knowles SE, Jarrett IG, Filsell OH, Ballard FJ:Production and utilization of acetate in mammals.Biochem J1974,142:01–411.
21. Solanky KS, Bailey NJ, Beckwith-Hall BM, Davis A, Bingham S, Holmes E, Nicholson JK, Cassidy A:Application of biofluid 1H nuclear magnetic resonance-based metabonomic techniques for the analysis of the biochemical effects of dietary isoflavones on human plasma profile.
Anal Biochem2003,323:197–204.
22. Griffin JL, Mann CJ, Scott J, Shoulders CC, Nicholson JK:Choline containing metabolites during cell transfection: an insight into magnetic resonance spectroscopy detectable changes.FEBS Lett2001,509:263–266. 23. Kharasch ED, Thummel KE:Identification of cytochrome P450 2E1 as the
predominant enzyme catalyzing human liver microsomal defluorination of sevoflurane, isoflurane, and methoxyflurane.Anesthesiology1993, 79:795–807.
25. Watanabe K, Hatakenaka S, Ikemune K, Chigyo Y, Kubozono T, Arai T:A case of suspected liver dysfunction induced by sevoflurane anesthesia.Masui
1993,42:902–905.
26. Carrigan TW, Straughen WJ:A report of hepatic necrosis and death following isoflurane anesthesia.Anesthesiology1987,67:581–583. 27. Sinha A, Clatch RJ, Stuck G, Blumenthal SA, Patel SA:Isoflurane
hepatotoxicity: a case report and review of the literature.Am J Gastroenterol1996,91:2406–2409.
28. Nishiyama T, Tokoyama T, Hanaoka K:Effects of sevoflurane and isoflurane anesthesia on arterial ketone body ratio and liver function.Acta Anaesthesiol Scand1999,43:347–351.
29. Tao KM, Yang LQ, Liu YT, Tao Y, Song JC, Wu FX, Yu WF:Volatile anesthetics might be more beneficial than propofol for postoperative liver function in cirrhotic patients receiving hepatectomy.Med Hypotheses
2010,75:555–557.
30. Fukuda I, Uchihashi Y, Kira M, Ogura T, Shizukuishi M, Kazama T, Sugiura Y: Effects of propofol on hepatic venous oxygen saturation–a comparison with isoflurane or sevoflurane anesthesia.Masui2005,54:736–741. 31. Guitton J, Buronfosse T, Desage M, Flinois JP, Perdrix JP, Brazier JL, Beaune
P:Possible involvement of multiple human cytochrome P450 isoforms in the liver metabolism of propofol.Br J Anaesth1998,80:788–795. 32. Gertler R, Brown HC, Mitchell DH, Silvius EN:Dexmedetomidine: a novel
sedative-analgesic agent.Proc (Bayl Univ Med Cent)2001,14:13–21. 33. Kaivosaari S, Toivonen P, Aitio O, Sipila J, Koskinen M, Salonen JS, Finel M:
Regio- and stereospecific N-glucuronidation of medetomidine: the differences between UDP glucuronosyltransferase (UGT) 1A4 and UGT2B10 account for the complex kinetics of human liver microsomes.
Drug Metab Dispos2008,36:1529–1537.
34. Lawrence CJ, Prinzen FW, de Lange S:The effect of dexmedetomidine on nutrient organ blood flow.Anesth Analg1996,83:1160–1165.
35. Memis D, Kargi M, Sut N:Effects of propofol and dexmedetomidine on indocyanine green elimination assessed with LIMON to patients with early septic shock: a pilot study.J Crit Care2009,24:603–608. 36. Haberer JP, Audibert G, Saunier CG, Muller C, Laxenaire MC, Hartemann D:
Effect of propofol and thiopentone on regional blood flow in brain and peripheral tissues during normoxia and hypoxia in the dog.Clin Physiol
1993,13:197–207.
37. Carmichael FJ, Crawford MW, Khawam N, Saldivia V:Effect of propofol infusion on splanchnic hemodynamics and liver oxygen consumption in the rat. A dose–response study.Anesthesiology1993,79:1051–1060. 38. Shelby MK, Cherrington NJ, Vansell NR, Klaassen CD:Tissue mRNA
expression of the rat UDP-glucuronosyltransferase gene family.Drug Metab Dispos2003,31:326–333.
39. Bedirli N, Ofluoglu E, Kerem M, Utebey G, Alper M, Yilmazer D, Bedirli A, Ozlu O, Pasaoglu H:Hepatic energy metabolism and the differential protective effects of sevoflurane and isoflurane anesthesia in a rat hepatic ischemia-reperfusion injury model.Anesth Analg2008, 106:830–837.
doi:10.1186/1471-2342-12-28
Cite this article as:Tajimaet al.:Proton nuclear magnetic resonance and pattern recognition analysis of liver extracts from rats under different anesthetics.BMC Medical Imaging201212:28.
Submit your next manuscript to BioMed Central and take full advantage of:
• Convenient online submission • Thorough peer review
• No space constraints or color figure charges
• Immediate publication on acceptance
• Inclusion in PubMed, CAS, Scopus and Google Scholar
• Research which is freely available for redistribution