METHOD DEVELOPMENT AND VALIDATION FOR SIMULTANEOUS ESTIMATION OF OFLOXACCIN AND SATRANIDAZOLE BY USING RP-HPLC
5
0
0
Full text
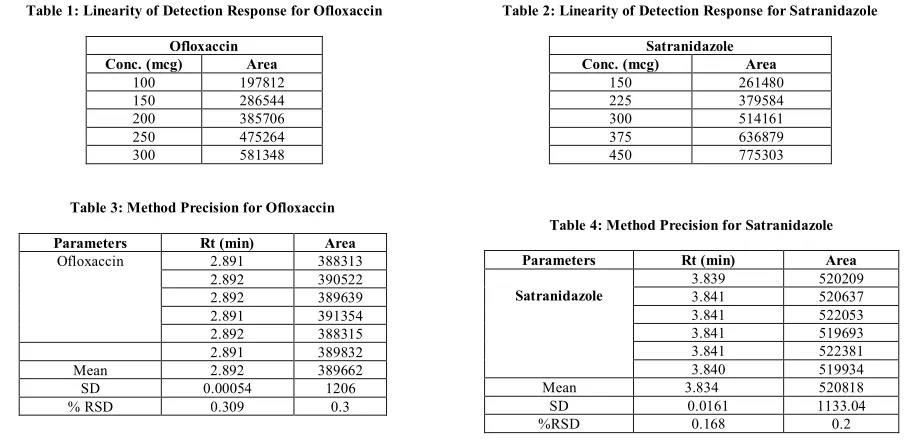
(2) K. S. Nataraj et al. Int. Res. J. Pharm. 2013, 4 (8) above solution was filtered through 0.45 µm PVDF membrane filter.. Satranidazole that indicates good precision of the sample analyzed. Table 3, 4 shows the data.. Calibration Curves Linearity experiments were performed by giving five replicates for both the components and the response was found to be linear in the range of 100 to 300 ppm for Ofloxaccin and 150 to 450 ppm for Satranidazole. The linearity of Ofloxaccin and satranidazole was plotted by a graph between response factor and concentration. (Figure 3,4).. Accuracy (Recovery Studies) Accuracy of method was calculated by recovery studies (n = 6) at six levels. Standard drug solution containing drugs in the range for Ofloxaccin and Satranidazole of concentration was added to previous analyzed test solution. Amount of drug recovered at each level (n = 6) was determined. Percent recovery at each level was calculated. Table 5, 6 shows data from the recovery study for Ofloxaccin, satranidazole were 99.003 – 100.5 % for Ofloxaccin, 98.6 – 100.4 % for satranidazole, respectively. High percentage recovery showed that the method was free from interference of excipients used in formulation.. Analysis of Tablet Formulation A quantity of the mixed contents was weighed accurately that is 20 tablets equivalent to about 200 mg of Ofloxaccin and transferred into a 100 ml volumetric flask. 20 ml of diluent was added and sonicated for about 10 minutes and diluted to the volume with diluent. 5 ml of the above solution was further diluted to 50 ml with diluent and mixed. The above solution was filtered through 0.45 μm PVDF membrane filter. Procedure The column was equilibrated for not less than 30 minutes with initial gradient at a flow rate of 1.0 ml / min. 10 µl of blank solution (Diluent), standard solution (5 injections) and sample solution were injected separately into the chromatographic system. The chromatograms were recorded and the peak responses were measured. Validation of HPLC Method Specificity The specificity of the RP – HPLC method was determined by comparison of the chromatogram of mixed standard and sample solution which were injected separately and the parameters like retention time, resolution and tailing factor were calculated. Good correlation was found between the results of mixed standards and sample solutions. Precision Precision of proposed HPLC method was found to be 0.309 (% RSD) for Ofloxaccin and 0.168 (% RSD) for Table 1: Linearity of Detection Response for Ofloxaccin. Robustness Robustness of the method was checked by changing flow rate, temperature, and standard was able to give system suitability parameters with in limit, which indicates that the method is robust results are shown in Table 7. System Suitability Parameters The system suitability parameters were evaluated. The % RSD for five replicate injections of Ofloxaccin and Satranidazole was 0.309 and 0.168 and found to be within the limits. The tailing factors for Ofloxaccin and satranidazole peaks were 1.6 and 1.16 respectively. The theoretical plates for Ofloxaccin and satranidazole are 41549 and 6809 were found to be within the limits. The system suitability parameters were evaluated and found to be within the limits. Results are shown in Table 8. RESULTS AND DISCUSSION The proposed method was a RP – HPLC procedure which employed a Hypersil BDS C18 (250 mm X 4.6 mm, 5 µ) column. Water + OPA (pH 5.0) and acetonitrile in the composition of 60:40 % v/v was used as the mobile phase. The drug solutions were scanned in the range of 200 to 400 nm on a UV – Visible spectrophotometer for selection of sampling wavelength. After recording the spectra of the two drugs, 295 nm was selected as a suitable wavelength for estimation. Table 2: Linearity of Detection Response for Satranidazole. Ofloxaccin Conc. (mcg) Area 100 197812 286544 150 200 385706 475264 250 300 581348. Satranidazole Conc. (mcg) 150 225 300 375 450. Area 261480 379584 514161 636879 775303. Table 3: Method Precision for Ofloxaccin Table 4: Method Precision for Satranidazole Parameters Ofloxaccin. Mean SD % RSD. Rt (min) 2.891 2.892 2.892 2.891 2.892 2.891 2.892 0.00054 0.309. Area 388313 390522 389639 391354 388315 389832 389662 1206 0.3. Parameters Satranidazole. Mean SD %RSD. Rt (min) 3.839 3.841 3.841 3.841 3.841 3.840 3.834 0.0161 0.168. Area 520209 520637 522053 519693 522381 519934 520818 1133.04 0.2. Page 241.
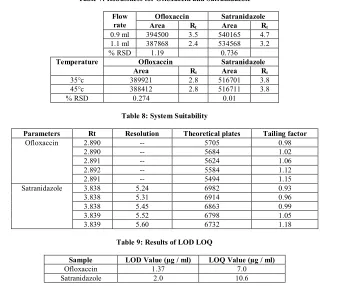
(3) K. S. Nataraj et al. Int. Res. J. Pharm. 2013, 4 (8) Table 5: Accuracy Results of Ofloxaccin Drug Ofloxaccin. Sample 50 % - 01 50 % - 02 50 % - 03 50 % - 04 50 % - 05 50 % - 06 100 % - 01 100 % - 02 100 % - 03 150 % - 01 150 % - 02 150 % - 03 150 % - 04 150 % - 05 150 % - 06. Sample weight (mcg) 320.0 320.0 320.0 320.0 320.0 320.0 636.0 636.0 636.0 953.0 953.0 953.0 953.0 953.0 953.0. Amount Added (mcg / ml) 100.6 100.6 100.6 100.6 100.6 100.6 200.0 200.0 200.0 299.6 299.6 299.6 299.6 299.6 299.6. Amount Estimated (mcg / ml) 102.9 103.8 102.2 102.8 103.3 100.63 195.41 198.32 195.17 297.19 298.9 299.6 298.5 302.12 301.59. % Recovery 102 102 102 102 103 100 98 99 98 99 100 100 100 101 101. % mean 102. 98. 100. Table 6: Accuracy Results of Satranidazole Drug Satranidazole. Sample 50 % - 01 50 % - 02 50 % - 03 50 % - 04 50 % - 05 50 % - 06 100 % - 01 100 % - 02 100 % - 03 150 % - 01 150 % - 02 150 % - 03 150 % - 04 150 % - 05 150 % - 06. Sample weight (mcg) 320.0 320.0 320.0 320.0 320.0 320.0 636.0 636.0 636.0 953.0 953.0 953.0 953.0 953.0 953.0. Amount Added (mcg / ml) 150.9 150.9 150.9 150.9 150.9 150.9 300.0 300.0 300.0 449.5 449.5 449.5 449.5 449.5 449.5. Amount Estimated (mcg / ml) 152.9 154.3 154.5 153.5 153.7 147.0 293.2 293.0 291.7 445.1 444.2 447.6 445.6 460.7 451.4. % Recovery 101 102 102 102 103 97 98 98 97 99 99 100 99 102 100. % mean 101. 98. 100. Table 7: Robustness for Ofloxaccin and Satranidazole Flow rate 0.9 ml 1.1 ml % RSD Temperature 35°c 45°c % RSD. Ofloxaccin Rt Area 394500 3.5 387868 2.4 1.19 Ofloxaccin Rt Area 389921 2.8 388412 2.8 0.274. Satranidazole Area Rt 540165 4.7 534568 3.2 0.736 Satranidazole Area Rt 516701 3.8 516711 3.8 0.01. Table 8: System Suitability Parameters Ofloxaccin. Satranidazole. Rt 2.890 2.890 2.891 2.892 2.891 3.838 3.838 3.838 3.839 3.839. Resolution -----5.24 5.31 5.45 5.52 5.60. Theoretical plates 5705 5684 5624 5584 5494 6982 6914 6863 6798 6732. Tailing factor 0.98 1.02 1.06 1.12 1.15 0.93 0.96 0.99 1.05 1.18. Table 9: Results of LOD LOQ Sample Ofloxaccin Satranidazole. LOD Value (µg / ml) 1.37 2.0. LOQ Value (µg / ml) 7.0 10.6. Page 242.
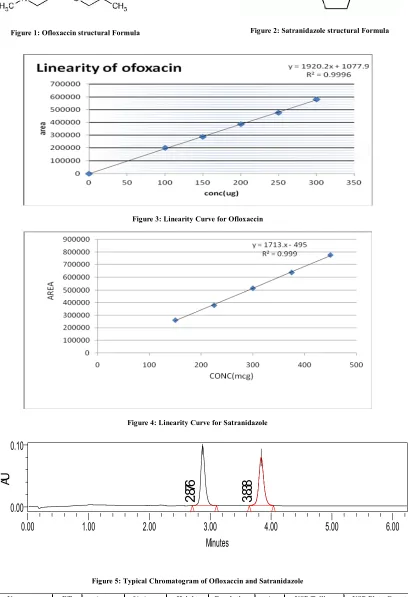
(4) K. S. Nataraj et al. Int. Res. J. Pharm. 2013, 4 (8). Figure 2: Satranidazole structural Formula. Figure 1: Ofloxaccin structural Formula. Figure 3: Linearity Curve for Ofloxaccin. Figure 4: Linearity Curve for Satranidazole. 0.00 1.00. 0.00. 2.00. 3.838. 2.876. AU. 0.10. 3.00 Minutes. 4.00. 5.00. 6.00. Figure 5: Typical Chromatogram of Ofloxaccin and Satranidazole Name Ofloxaccin Satranidazole. RT 2.876 3.838. Area 463601 449289. % Area 50.78 49.22. Height 96190 77557. Resolution 7. s/n 122.81 99.02. USP Tailing 1.233 1.095. USP Plate Count 8862 10917. Page 243.
(5) K. S. Nataraj et al. Int. Res. J. Pharm. 2013, 4 (8) The best resolution between Ofloxaccin and Satranidazole was achieved with in 6 minutes of run time, with flow rate of 1.0 ml / min. The linearity response of the HPLC system for Ofloxaccin was found to be in the range of 100 to 300 ppm and for Satranidazole in the range of 150 to 450 ppm. Accuracy of the method was checked by adding standard drug solution containing drugs within the range. The recovery study for Ofloxaccin was between 99.003 – 100.5 % and 98.6 – 100.4 % for Satranidazole. Precision of the method was found to be 0.309 (% RSD) for Ofloxaccin and 0.168 (% RSD) for Satranidazole that indicates good precision of the sample analyzed. When changing the flow rate and temperature of the method, the system suitability parameters remained within limits, so that the method was proved to be robust. The LOD, LOQ values of Ofloxaccin were 1.37, 7.0 and Satranidazole 2.0, 10.6 respectively (Table 9). The other validation parameters, sensitivity and selectivity of the proposed method were found be within limits as the number of theoretical plates, tailing factor, resolution, separation factor, results of analysis and statistical parameters. CONCLUSION The present work describes simple, economical and noninterfering simultaneous method of estimation of Ofloxaccin and Satranidazole by using RP – HPLC. The method was found to be economic, simple, precise, accurate and reproducible during analysis of drug formulations containing the two drugs.. REFERENCES 1. Dash Arun Kumar, T. Siva Kishore, Loya Harika, Uma Devi Kothapalli. A Validated UV-Spectrophotometric method for the estimation of Ofloxaccin in bulk and Pharmaceutical dosage forms, International Journal of Pharmaceutical and biological archives 2011; 2(4): 11571161. 2. Rao Kareti Srinivasa, Benarjee Arijit, Keshar Nargesh Kumar. Spectrophotometric methods for the simultaneous estimation of Ofloxaccin and tinidazole in bulk and dosage forms, Chronicles of young scientists articles 2011; 2(2): 98-102. 3. Sherje AP, Tawade AP. Simultaneous spectrophotometric estimation of Ofloxaccin and Satranidazole from pharmaceutical dosage form, International Journal of Pharmatech Research 2010; 2(1): 5111-5114. 4. R Shinde Sachin, I Bhoir Suvarna, S Pawar Namdev, B Yadav Suman and M Bhagwat Ashok. Simultaneous Estimation of Satranidazole and Ofloxaccin in Tablet Dosage Form by High Performance Liquid Chromatography, Journal of chemistry 2010; 7(1): 198-202. 5. Bhatt KK, Patel NS, Patel JB, Jadeja J, Chaudhary B. Simultaneous Estimation of Ofloxaccin and Satranidazole in tablet by RP-HPLC method, International Journal of Pharmaceutical and Applied Sciences 2011; 2(1): 11-14. 6. Archana Raveendran, T Venkatachalam, N Senthil Kumar. RP-HPLC Method for Simultaneous determination of Ofloxaccin and satranidazole in tablet dosage form, Journal of Global Trends in Pharmaceutical sciences 2011; 2(3): 415-420. 7. Suvarna I Bhoir, Poonam V Gaikwad, Lavu S Parab. RP-HPLC Method Development and Validation for the Simultaneous Estimation of Satranidazole and Ofloxaccin in Pharmaceutical Dosage Form, Journal of chromatographic science 2009; 49(1): 84-87. Cite this article as: K. S. Nataraj, A. Srinivasa Rao, Nagesh Kumar Mutyala, P. Sivalingachari and K. Alekhya. Method development and validation for simultaneous estimation of ofloxaccin and satranidazole by using RP-HPLC. Int. Res. J. Pharm. 2013; 4(8):240-244 http://dx.doi.org/10.7897/2230-8407.04848. Source of support: Nil, Conflict of interest: None Declared. Page 244.
(6)
Figure
Related documents
Moreover, the fitting of the radiological guide model, obtained by processing DICOM images on the gypsum cast has been verified (Figure 9A) ( mean value -0.004 mm, SD 0.082 mm)..
(AT): anaerobic threshold; (BR): breathing reserve; (CPET): cardiopulmonary exercise testing; (HR): Heart rate; (HRR): Heart rate recovery; (HRRes): Heart rate reserve;
In our study, we showed that at 2 weeks after ACLT surgery, rats in the model group had significantly higher serum levels of COMP when compared to rats in the control group
LP: Locking plate alone; LPDP: Locking plate combined with a distal radius plate; LPMP: Locking plate combined with medial anatomical locking plate; LPSG: Locking plate combined with
The study ’ s primary objective was to demonstrate the ability of the harmonic scalpel (H) to reduce intra- operative conversion rates compared to the conventional monopolar
• The cattle that showed clinical signs before day 16 (early cases) stayed for a long time in the herd, and were culled only after a few days, while cattle that became sick later
A substitution is a mapping from term variables to terms, from sequence variables to sequences, from function vari- ables to functors and from context variables to contexts,
As any other surgery , complications happened , 5 patients developed penile abscesses treated with incision and drainage , 4 patients had urinary obstruction
