Early Television Exposure and Subsequent Attentional
Problems in Children
Dimitri A. Christakis, MD, MPH*‡§
㛳
; Frederick J. Zimmerman, PhD‡§; David L. DiGiuseppe, MSc‡; and
Carolyn A. McCarty, PhD*‡
ABSTRACT. Objective. Cross-sectional research has suggested that television viewing may be associated with decreased attention spans in children. However, longitu-dinal data of early television exposure and subsequent attentional problems have been lacking. The objective of this study was to test the hypothesis that early television exposure (at ages 1 and 3) is associated with attentional problems at age 7.
Methods. We used the National Longitudinal Survey of Youth, a representative longitudinal data set. Our main outcome was the hyperactivity subscale of the Be-havioral Problems Index determined on all participants at age 7. Children who were >1.2 standard deviations above the mean were classified as having attentional problems. Our main predictor was hours of television watched daily at ages 1 and 3 years.
Results. Data were available for 1278 children at age 1 and 1345 children at age 3. Ten percent of children had attentional problems at age 7. In a logistic regression model, hours of television viewed per day at both ages 1 and 3 was associated with attentional problems at age 7 (1.09 [1.03–1.15] and 1.09 [1.02–1.16]), respectively.
Conclusions. Early television exposure is associated with attentional problems at age 7. Efforts to limit tele-vision viewing in early childhood may be warranted, and additional research is needed. Pediatrics 2004;113:708 – 713;ADHD, television, attentional problems, prevention.
ABBREVIATIONS. ADHD, attention-deficit/hyperactivity disor-der; NLSY, National Longitudinal Survey of Youth; BPI, Behav-ioral Problems Index; SD, standard deviation; CES-D, Center for Epidemiologic Studies Depression scale.
A
ttention-deficit/hyperactivity disorder (ADHD)
affects between 4% and 12% of US children
and is the most common behavioral disorder
of childhood.
1–5Despite decades of research, there
are still significant gaps in our understanding of this
condition. In particular, we know surprisingly little
about its cause and what, if any, environmental
fac-tors may influence its development. ADHD has been
shown to have high heritability, and partly for this
reason research has focused on the structural and
neurochemical features of the brain,
6 – 8yet the
heri-tability of ADHD goes only so far in explaining its
cause. Twin studies have established 50% to 80%
concordance with monozygotics being more
concor-dant than dizygotic.
6 –11However, the most
promi-nent of the twin studies have not controlled for
en-vironmental influences.
9 –11Moreover, the emphasis
on structural or operational neurologic features of
the central nervous system has perhaps lent a sense
of inevitability or immutability to the condition and
contributed to an underappreciation of the
poten-tially crucial role that early childhood experiences
may have on either the development or the
modula-tion of attenmodula-tional problems.
12Recent research
sug-gests that gene– environment interactions may be
im-portant in conditioning the risk of ADHD as well as
its severity and progression.
7,13,14It is widely known that the newborn brain
contin-ues to develop rapidly through the first few years of
life and that considerable plasticity exists during this
period.
15,16Considerable evidence also exists that
environmental exposures, including types and
de-grees of stimulation, affect the number and the
den-sity of neuronal synapses.
17–19The types and
inten-sity of visual and auditory experiences that children
have early in life therefore may have profound
influ-ences on brain development.
In contrast to the pace with which real life unfolds
and is experienced by young children, television can
portray rapidly changing images, scenery, and
events. It can be overstimulating yet extremely
inter-esting. This has led some to theorize that television
may shorten children’s attention spans.
20,21Others
have speculated that it may lead to ADHD.
22Kool-stra and Van der Voort
23found that television
view-ing reduces readview-ing in later ages and self-reported
levels of concentration. However, most studies have
focused on television viewing during the school-age
years.
24The American Academy of Pediatrics
recom-mends that parents exercise caution in letting their
children under the age of 2 years watch television.
25We hypothesized that very early exposure to
tele-vision during the critical periods of synaptic
devel-opment would be associated with subsequent
atten-tional problems. This study tested that hypothesis
using observational data from a nationally
represen-tative longitudinal data set.
METHODS Data Source
Data for this study were drawn from the National Longitudinal Survey of Youth 1979 Children and Young Adults (NLSY-Child),
From the *Department of Pediatrics, University of Washington, Seattle, Washington; ‡Child Health Institute, University of Washington, Seattle, Washington; §Department of Health Services, Seattle, Washington; and
㛳Children’s Hospital and Regional Medical Center, Seattle, Washington. Received for publication Apr 17, 2003; accepted Aug 20, 2003.
Reprint requests to (D.A.C.) Child Health Institute, 6200 NE 74th St, Ste 210, Seattle, WA 98115-8160.E-mail: dachris@u.washington.edu
an outgrowth of the original National Longitudinal Survey of Youth 1979 (NLSY79). The NLSY79, sponsored by the US Depart-ment of Labor, began with a nationally representative sample of almost 12 700 individuals who were aged 14 to 22 years in 1979 and have been interviewed annually or biennially since (go to www.bls.gov/nls/y79summary.htm). Blacks and Latinos were oversampled to provide statistical power for subgroup analyses and population weights are available to draw valid national in-ferences. The NLSY-Child, begun in 1986 and conducted bienni-ally, is an extensive collection of information for⬎11 000 children of the female respondents to the NLSY79 regarding developmen-tal assessment, family background, home environment, and health history (go to www.bls.gov/nls/y79chyasum.htm). Information for the NLSY-Child is obtained from both the mother and the child, depending on the child’s age. The records from NLSY79 and NLSY-Child are linkable via the mother’s sample identification number. Data from both the 1986 –2000 NLSY-Child and NLSY79 were analyzed for this study using the Center for Human Re-source Research Database Investigator Software (The Ohio State University, Build 1.4.1.57, Columbus, OH).
Our sample consisted of children who were⬃7 years of age in 1 of the 3 most recent survey waves: 1996, 1998, or 2000. We considered the first interview that occurred between the ages of 6 years 9 months and 8 years 9 months as the representative “age 7” or “index” interview. This index interview was then used to derive the outcome variable and a subset of the covariates (ex-plained below). Age, in months, was determined by the age re-ported on the maternal supplement portion of the index survey.
Outcome Measure
Our outcome measure involved characterization of attentional problems at or near 7 years of age. Attentional problem status was derived from the hyperactivity subscale of the Behavioral Prob-lems Index (BPI),26which consists of 5 items that ask whether the
child has difficulty concentrating, is easily confused, is impulsive, has trouble with obsessions, or is restless. Each item allowed 3 responses: often true, sometimes true, and not true. After the survey, the administrators of the NLSY collapsed each item into a binary score (often or sometimes true vs not true). The 5 binary scores were summed, and the resulting subscale scores were cou-pled with national norms to create age-specific percentile and standardized scores, based on both same-gender and combined-gender distributions.
We created a binary classification representing attentional problems as either present or absent, using a cut point of 120 on the same-gender standardized BPI subscale score. That is, children with scoresⱖ1.2 standard deviations (SDs) above the mean were classified as having attentional problems. Although this cannot be viewed to be equivalent to a diagnosis of ADHD, the endorsed symptoms on the subscale are derived from items from the Achen-bach Child Behavior Checklist,27as well as other similar behavior
scales,28 –30and are similar to symptoms that are consistent with a
diagnosis of ADHD. We chose this cutoff in part because it yielded a prevalence for attentional problems that was similar to pub-lished reports of ADHD prevalence among similar-aged children in community samples.31
Main Predictor
Our main prediction variable was the number of hours of television watched per day. As of 1990, mothers were asked the number of hours of television the child (younger than 10 years) watched on a typical weekday and on a typical weekend day. When a response indicated no television in the home, television viewing hours were set to 0; when a response indicated⬎16 hours of viewing per day, the viewing was capped at 16 hours. The number of hours per week was computed as 5 times the number of hours watched during a typical weekday plus 2 times the number of hours watched on a typical weekend day. To get a daily average, we then divided this number by 7. This computation was performed for the survey years occurring 3 and 2 interview waves before the index year to ascertain the amount of television watched at approximately ages 1 and 3. We chose these 2 ages because they precede the age at which attentional problems are typically manifested or diagnosed and because television viewing at such young ages is controversial and discouraged.25,32
Covariates
Model covariates included gender, race/ethnicity (Hispanic, black, or non-Hispanic/nonblack), child age at the index interview (measured in months), gestational age at birth, maternal use of alcohol or tobacco during pregnancy, measures of cognitive stim-ulation and emotional support in the home environment at or near ages 1 and 3, the number of children in the household at or near ages 1 and 3, the presence of 2 parents in the household (mother and mother’s spouse/partner) at or near ages 1 and 3, maternal self-esteem as of 1987, maternal depression as of 1992, urban/rural residence at index, maternal age at index (in years), maternal education at index, and calendar year at index,
When gestational age was missing but survey data indicated that the child was born late, gestational age was set to 41 weeks. For perinatal substance use, ordinal-scale variables indicating graduated levels of substance abuse during pregnancy were re-coded as binary variables indicating “some” or “none.”
Measures of cognitive stimulation and emotional support in the household were derived from items on the maternal supplement based on the Home Observation for Measurement of the Environ-ment-Short Form (go to www.bls.gov/nls/y79cyaguide/1998/ nlsy79childg6.pdf). Although the specific survey items differ for 0-to 2-year-olds and 3- 0-to 5-year-olds, the cognitive stimulation score generally includes items related to outings, reading, playing, and parental role in teaching a child. For the youngest children, the emotional support score is composed of elements related to eating meals with both parents, parents talking to child while working, and spanking (reverse-scored). For the 3- to 5-year-olds, the emo-tional support score also includes items related to child’s choice in food decisions and methods of dealing with a child who hits a parent. To facilitate interpretation, we normalized these scores using the sample SD for each score.
Maternal self-esteem was derived from 10 items on the 1987 NLSY79 survey, the most recent year for which a self-esteem inventory was administered. Five items were asked in a positive form: I am a person of worth; I have a number of good qualities; I am as capable as others; I have a positive attitude; I am satisfied with myself. Five items were asked in a negative form: I am inclined to feel that I am a failure; I feel I do not have much to be proud of; I wish I had more self-respect; I feel useless at times; I sometimes think I am no good at all. Each item had a 4-level response ranging from 1 (strongly agree) to 4 (strongly disagree). We reverse-coded the negatively formed items, summed the total, and normalized, yielding scores with lower values representing higher levels of self-esteem.
Maternal depression was taken from the 1992 NLSY79 survey, the only year in which the full 20-item Center for Epidemiologic Studies Depression scale (CES-D) was administered. Sixteen of the 20 items asked about recent feelings in a negative form: bothered by things not usually bothersome; did not feel like eating; felt unable to shake blues; had trouble keeping mind on tasks; felt depressed; felt that everything took extra effort; felt like life had been a failure; felt fearful; had restless sleep; talked less than usual; felt lonely; felt others were unfriendly; had crying spells; felt sad; felt disliked by others; could not get going. Four items were positively worded: felt as good as other people; felt hopeful; felt happy; enjoyed life. Valid responses ranged from 0 (rarely) to 3 (all of the time). We reverse-coded positively worded items, then summed to get an overall CES-D score, with higher scores indi-cating more depressive symptoms. The CES-D has been used in ⬎500 published articles and has been shown to have very good validity and reliability.33–36
Exclusions and Sample Weights
Modeling
After examining the univariate characteristics of the indepen-dent variables, we developed 2 multivariable logistic regression models. The first related our outcome of attentional problems to the covariates, using the covariates relevant to early childhood as measured at or near age 1; the second substituted the covariates relevant to early childhood as measured at or near age 3. Regres-sions incorporated the sampling weights for the child as of the index interview. Given the possibility of multiple children sharing the same mother, we accounted for the potential lack of indepen-dence across observations by clustering on the mother’s identifi-cation number. All analyses were performed in Intercooled Stata 7.0 (Stata Corporation, College Station, TX). The study protocol was reviewed and approved by the University of Washington Institutional Review Board.
RESULTS
A total of 1278 children had data from age “1”
(mean: 1.8 years; SD: 0.6), and 1345 had data from
age “3” (mean: 3.8 years; SD: 0.6). Approximately
50% of the children were male, and 57% were white.
The demographic characteristics of included children
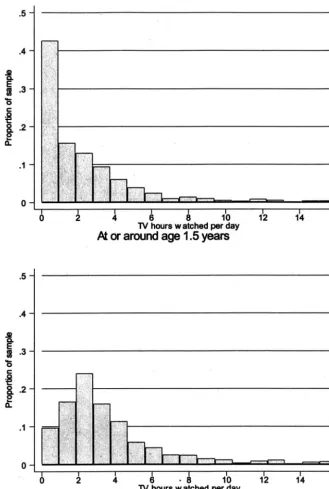
are summarized in Table 1. Children watched an
average of 2.2 hours (SD: 2.91) of television per day
at age 1 and 3.6 hours (SD: 2.94) per week at age 3.
The distributions of hours of television watched at
each age are presented in Fig 1. Ten percent of
chil-dren for whom data were available at ages 1 and 3
had attentional problems on the basis of our
defini-tion derived from the BPI.
In the logistic regression models, controlling for all
of the previously listed covariates, television hours
watched per day at both age 1 and age 3 was
asso-ciated with having attentional problems at age 7 (1.09
[1.03–1.15] and 1.09 [1.02–1.16]), respectively (Table 2).
DISCUSSION
We found that early exposure to television was
associated with subsequent attentional problems.
This finding was present even while controlling for a
number of potential confounding factors, including
prenatal substance use and gestational age, measures
of maternal psychopathology, and socioeconomic
status. The magnitude of the risk associated with
television viewing, expressed in our analysis in
terms of hours per day of television viewed, is
clin-ically significant when one considers the full range of
hours of television viewed in our sample (0 –16). A
1-SD increase in the number of hours of television
watched at age 1 is associated with a 28% increase in
the probability of having attentional problems at age
7. This result is robust and stable over time—a
sim-ilar effect size is obtained for the number of hours of
television watched at age 3. To our knowledge, ours
is the first study to test the hypothesis of very early
television viewing on subsequent inattention using a
nationally representative longitudinal sample.
Several limitations to this study warrant
consider-ation. First, the measure that we used for attentional
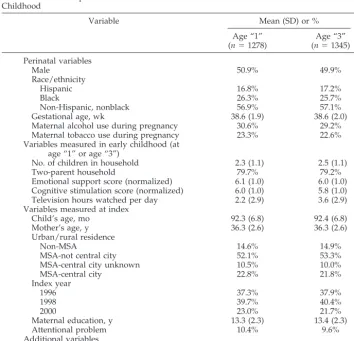
TABLE 1. Descriptive Statistics of Modeled Variables Measured at 2 Different Points in Early Childhood
Variable Mean (SD) or %
Age “1” (n⫽1278)
Age “3” (n⫽1345)
Perinatal variables
Male 50.9% 49.9%
Race/ethnicity
Hispanic 16.8% 17.2%
Black 26.3% 25.7%
Non-Hispanic, nonblack 56.9% 57.1%
Gestational age, wk 38.6 (1.9) 38.6 (2.0)
Maternal alcohol use during pregnancy 30.6% 29.2% Maternal tobacco use during pregnancy 23.3% 22.6% Variables measured in early childhood (at
age “1” or age “3”)
No. of children in household 2.3 (1.1) 2.5 (1.1)
Two-parent household 79.7% 79.2%
Emotional support score (normalized) 6.1 (1.0) 6.0 (1.0) Cognitive stimulation score (normalized) 6.0 (1.0) 5.8 (1.0) Television hours watched per day 2.2 (2.9) 3.6 (2.9) Variables measured at index
Child’s age, mo 92.3 (6.8) 92.4 (6.8)
Mother’s age, y 36.3 (2.6) 36.3 (2.6)
Urban/rural residence
Non-MSA 14.6% 14.9%
MSA-not central city 52.1% 53.3%
MSA-central city unknown 10.5% 10.0%
MSA-central city 22.8% 21.8%
Index year
1996 37.3% 37.9%
1998 39.7% 40.4%
2000 23.0% 21.7%
Maternal education, y 13.3 (2.3) 13.4 (2.3)
Attentional problem 10.4% 9.6%
Additional variables
Maternal CES-D, 1992 10.1 (9.3) 9.8 (9.0)
Maternal self-esteem, 1987 4.0 (1.0) 4.0 (1.0)
problems is not necessarily indicative of clinically
diagnosed ADHD. However, it was derived from the
subscale of the Child Behavior Checklist, which was
found to have a sensitivity of 75% and a specificity of
99% compared with
Diagnostic and Statistical Manual
of Mental Disorders, Third Edition
criteria in a large,
population-based sample.
37In a population referred
to a neuropsychology clinic, the overall accuracy of
the Child Behavior Checklist relative to structured
interview for ADHD using
Diagnostic and Statistical
Manual of Mental Disorders, Fourth Edition
criteria was
69%.
38Furthermore, the proportion of children who
met our criterion for having “attentional problems”
was 10%, which roughly corresponds with
popula-tion-based estimates of the prevalence of ADHD.
1– 4Nevertheless, we have not in fact studied or found an
association between television viewing and clinically
diagnosed ADHD.
Second, we relied on parental report of television
viewed. Although this may not be an entirely
accu-rate measure of the true amount, there are no a priori
reasons to believe that its imprecision would bias our
findings in one direction or another. To the extent
that it is merely inaccurate, it should bias them
to-ward the null.
Third, we cannot draw causal inferences from
these associations. It could be that attentional
prob-lems lead to television viewing rather than vice
versa. However, to mitigate this limitation, we
ex-ploited the longitudinality of the data set and
fo-cused on television viewing at 1 and 3 years of age,
well before the age at which most experts believe
that ADHD symptoms are manifest.
32,39It is also
possible that there are characteristics associated with
parents who allow their children to watch excessive
amounts of television that accounts for the
ship between television viewing and attentional
problems. For example, parents who were distracted,
neglectful, or otherwise preoccupied might have
al-lowed their children to watch excessive amounts of
television in addition to having created a household
environment that promoted the development of
at-tentional problems. Although we adjusted for a
number of potential confounders, including home
environment, maternal depression, cognitive
stimu-lation, and emotional support, our adjustment may
have been imperfect. Finally, we had no data on the
content of the television being viewed. Some
re-search indicates that educational television (eg,
Ses-ame Street) may in fact promote attention and
read-ing among school-aged children.
24Others have
disagreed and posited that even such programming
can be detrimental.
40If exposure to certain kinds of
programming is beneficial, even at a very young age,
then our results represent conservative estimates of
the risks of television as a medium in general
be-cause some proportion of the programming may
have moderated the detrimental aspects of others
and deviated the results toward the null. However,
more research is needed on the effects of varying
content of television, particularly for children who
are preschool age.
Despite these limitations, our results have some
important implications if replicated in future studies.
First, we added inattention to the previously studied
deleterious consequences of excessive television
viewing, including violent behavior and obesity.
41– 43Second, our findings suggest that preventive action
can be taken with respect to attentional problems in
children. Limiting young children’s exposure to
tele-vision as a medium during formative years of brain
development consistent with the American Academy
of Pediatrics’ recommendations may reduce
chil-dren’s subsequent risk of developing ADHD.
25ACKNOWLEDGMENTS
This study was funded in part by the Nesholm Family Foun-dation of Washington State as well as the Robert Wood Johnson Foundation (to Dr Christakis).
We are grateful to Dr Fred Rivara for thoughtful comments on a draft of this manuscript.
REFERENCES
1. Brown RT, Freeman WS, Perrin JM, et al. Prevalence and assessment of attention-deficit/hyperactivity disorder in primary care settings. Pedi-atrics. 2001;107(3). Available at: pediatrics.org/cgi/content/full/107/ 3/e43
2. Safer DJ, Malever M. Stimulant treatment in Maryland public schools.
Pediatrics. 2000;106:533–539
3. Kelleher KJ, McInerny TK, Gardner WP, Childs GE, Wasserman RC. Increasing identification of psychosocial problems: 1979 –1996. Pediat-rics. 2000;105:1313–1321
4. Wasserman RC, Kelleher KJ, Bocian A, et al. Identification of attentional and hyperactivity problems in primary care: a report from pediatric research in office settings and the ambulatory sentinel practice network.
Pediatrics. 1999;103(3). Available at: pediatrics.org/cgi/content/full/ 103/3/e38
5. Scahill L, Schwab-Stone M. Epidemiology of ADHD in school-age chil-dren.Child Adolesc Psychiatr Clin N Am.2000;9:541–555, vii
6. Barkley RA. Attention-deficit hyperactivity disorder.Sci Am.1998;279: 66 –71
7. Jensen PS. ADHD: current concepts on etiology, pathophysiology, and neurobiology.Child Adolesc Psychiatr Clin N Am.2000;9:557–572, vii–viii 8. Cantwell DP. Attention deficit disorder: a review of the past 10 years.
J Am Acad Child Adolesc Psychiatry. 1996;35:978 –987
9. Gjone H, Stevenson J, Sundet JM. Genetic influence on parent-reported attention-related problems in a Norwegian general population twin sample.J Am Acad Child Adolesc Psychiatry. 1996;35:588 –596
10. Gillis JJ, Gilger JW, Pennington BF, DeFries JC. Attention deficit disor-der in reading-disabled twins: evidence for a genetic etiology.J Abnorm Child Psychol. 1992;20:303–315
11. Stevenson J, Pennington BF, Gilger JW, DeFries JC, Gillis JJ. Hyperac-tivity and spelling disability: testing for shared genetic aetiology.J Child Psychol Psychiatry. 1993;34:1137–1152
12. Joseph J. Not in their genes: a critical view of the genetics of attention deficit hyperactivity disorder.Dev Rev. 2000;20:539 –567
13. Campbell SB. Attention-Deficit/Hyperactivity Disorder: A Develop-mental View. In: Sameroff AJ, Lewis M, Miller SM, eds.Handbook of Developmental Psychopathology. 2nd ed. New York, NY: Kluwer Academic/Plenum Publishers; 2000:383– 401
14. Faraone SV, Biederman J. Nature, nurture, and attention deficit hyper-activity disorder.Dev Rev.2000;20:568 –581
15. Barkovich AJ, Kjos BO, Jackson DE Jr, Norman D. Normal maturation of the neonatal and infant brain: MR imaging at 1.Radiology. 1988;166: 173–180
16. Yamada H, Sadato N, Konishi Y, et al. A milestone for normal devel-opment of the infantile brain detected by functional MRI.Neurology. 2000;55:218 –223
17. Wallace CS, Kilman VL, Withers GS, Greenough WT. Increases in dendritic length in occipital cortex after 4 days of differential housing in weanling rats.Behav Neural Biol. 1992;58:64 – 68
18. Greenough WT, Black JE, Wallace CS. Experience and brain develop-ment.Child Dev. 1987;58:539 –559
19. Turner AM, Greenough WT. Differential rearing effects on rat visual
TABLE 2. Regression Results for 2 Models, Differing by Early Childhood Time Period Considered Odds Ratio (95% CI)
Age “1” (n⫽1278)
Age “3” (n⫽1345)
Variables measured in early childhood (at age “1” or age “3”)
Television hours watched per day 1.09 (1.03–1.15) 1.09 (1.02–1.16) Emotional support score 0.82 (0.66–1.04) 0.81 (0.65–1.01) Cognitive stimulation score 0.84 (0.65–1.07) 0.79 (0.61–1.00) Variables measured at index
Child’s age, mo 1.03 (0.99–1.07) 1.04 (1.00–1.09)
Mother’s age, y 1.02 (0.91–1.14) 0.94 (0.84–1.05)
Maternal education, y 0.91 (0.82–1.02) 0.95 (0.85–1.06) Maternal psychopathology variables
Maternal CES-D, 1992 1.03 (1.01–1.05) 1.03 (1.01–1.05) Maternal self-esteem, 1987 1.36 (1.07–1.73) 1.30 (1.01–1.69)
CI indicates confidence interval.
cortex synapses. I. Synaptic and neuronal density and synapses per neuron.Brain Res. 1985;329:195–203
20. Singer JL. The power and limits of television: a cognitive-affective analysis. In: Tannenbaum P, ed.The Entertainment Function of Television.
Hillsdale, NJ: Erlbaum; 1980:312–360
21. Healy J.Endangered Minds: Why Children Don’t Think and What We Can Do About It. New York, NY: Simon and Schuster; 1990
22. Hartmann T.Beyond ADD: Hunting for Reasons in the Past and Present. Grass Valley, CA: Underwood; 1996
23. Koolstra C, Van der Voort T. Longitudinal effects of television on children’s leisure time reading: a test of three explanatory models.Hum Commun Res. 1996;23:4 –35
24. Anderson DR, Huston AC, Schmitt KL, Linebarger DL, Wright JC.Early Childhood Television Viewing and Adolescent Behavior. Boston, MA: Blackwell; 2001
25. American Academy of Pediatrics Committee on Public Education. Me-dia education.Pediatrics.1999;104:341–343
26. Center for Human Resource Research.NLSY Child Handbook. Rev ed. Columbus, OH: The Ohio State University; 1993
27. Achenbach TM, Edelbrock CS.Manual for the Child Behavior Checklist and Revised Child Behavior Profile. Burlington, VT: University of Vermont; 1983
28. Graham PJ, Rutter ML. The reliability and validity of the psychiatric assessment of the child. II. Interview with the parent.Br J Psychiatry. 1968;114:581–592
29. Kellam SK, Branch JD, Agrawal KC, Ensminger ME.Mental Health and Going to School: The Woodlawn Program of Assessment, Early Intervention, and Evaluation. Chicago, IL: University of Chicago Press; 1975 30. Rutter M, Tizard J, Whitmore K.Education, Health, and Behavior. London,
UK: Longman; 1970
31. Wolraich ML, Hannah JN, Pinnock TY, Baumgaertel A, Brown J. Com-parison of diagnostic criteria for attention-deficit hyperactivity disorder in a county-wide sample.J Am Acad Child Adolesc Psychiatry. 1996;35: 319 –324
32. American Academy of Pediatrics Committee on Quality Improvement Subcommittee on Attention-Deficit/Hyperactivity. Clinical practice
guideline: diagnosis and evaluation of the child with attention-deficit/ hyperactivity disorder.Pediatrics.2000;105:1158 –1170
33. Husaini BA, Neff JA, Stone RH. Psychiatric impairment in rural com-munities.J Community Psychol. 1979;7:137–146
34. Beekman AT, Deeg DJ, Van Limbeek J, Braam AW, De Vries MZ, Van Tilburg W. Criterion validity of the Center for Epidemiologic Studies Depression scale (CES-D): results from a community-based sample of older subjects in The Netherlands.Psychol Med. 1997;27:231–235 35. Thomas JL, Jones GN, Scarinci IC, Mehan DJ, Brantley PJ. The utility of
the CES-D as a depression screening measure among low-income women attending primary care clinics. The Center for Epidemiologic Studies-Depression.Int J Psychiatry Med. 2001;31:25– 40
36. Weissman MM, Sholomskas D, Pottenger M, Prusoff BA, Locke BZ. Assessing depressive symptoms in five psychiatric populations: a val-idation study.Am J Epidemiol. 1977;106:203–214
37. Boyle MH, Offord DR, Hofmann HG, et al. Ontario Child Health Study. I. Methodology.Arch Gen Psychiatry. 1987;44:826 – 831
38. Vaughn ML, Riccio CA, Hynd GW, Hall J. Diagnosing ADHD (predom-inantly inattentive and combined type subtypes): discriminant validity of the behavior assessment system for children and the Achenbach parent and teacher rating scales.J Clin Child Psychol.1997;26:349 –357 39. American Psychiatric Association.Diagnostic and Statistical Manual of
Mental Disorders. 4th ed. Washington, DC: American Psychiatric Association; 1994
40. Healy JM.Endangered Minds: Why Our Children Don’t Think. New York, NY: Simon and Schuster; 1990
41. Robinson TN, Hammer LD, Killen JD, et al. Does television viewing increase obesity and reduce physical activity? Cross-sectional and lon-gitudinal analyses among adolescent girls.Pediatrics. 1993;91:273–280 42. Robinson TN. Reducing children’s television viewing to prevent
obesity: a randomized controlled trial.JAMA. 1999;282:1561–1567 43. Robinson TN, Wilde ML, Navracruz LC, Haydel KF, Varady A. Effects
of reducing children’s television and video game use on aggressive behavior: a randomized controlled trial.Arch Pediatr Adolesc Med. 2001; 155:17–23
STRANGLING IN RED TAPE
“About $400 billion, or nearly one-third of all the money spent on health care, is
just for the paperwork. It’s a staggering sum—a Pentagon-sized sum. And,
accord-ing to the comprehensive study by researchers from the Harvard Medical School
and from Public Citizen that produced this estimate, some $286 billion of that is
utter waste. Compare that $286 billion savings to the estimated $80 billion cost of
insuring every American. Or, to the $53 billion price-tag for covering out-of-pocket
prescription drug costs not just for seniors, but for everyone.”
Bivens M. Dr Red Tape.The Nation. January 16, 2004