The Impact of Implementation of Total
Quality Management on Plants'
Productivity: Evidence from Poultry
Processing Plants- Saudi Arabia- Central
Region
Elhaj Abdelmoula.Elsiddig Musa*
Arasco Poultry Processing Plant
*
Email: [email protected]
*
00966540986714
Dr. ISAM KHALID ALAWAD
University of Juba School of Management
Abstract
Productivity index as an important business determinant factor for profitability and business performance has been studied in this research versus TQM varibles. The study highlighted out the impacts of implementation of TQM on productivity in poultry processing plants in Saudi Arabia – Central Region.
The significance of this research represented in exploring the impact of TQM practices on Poultry Processing Plants' productivity. Seven determinants of TQM practices and their impacts were measured against productivity. The determinants included top management commitment, customer focus, rewards & training, continual improvement, cooperation & teamwork, prevention focus and measurement system.
Data was collected by using Questionnaire tool. The Questionnaire is of closed ended questions. It consists of three parts, the first part is demographic information about the study sample, the second part about implementation of the total quality management and the third part is to measure productivity. A sample of three poultry processing plants that effectively implemented total quality management were purposively chosen out of eight plants in Saudi Arabia Central Region. The study respondents are purposively chosen which consists quality team, production supervisors, Total quality management and production managers. 73 respondents out 75 participated in the survey. The finding indicated that the TQM practices have positive impact on poultry processing plants' productivity.
Keywords and Phrase: Total Quality Management (TQM), Productivity, Poultry Processing Plant (PPP). I-Introduction
productivity can be defined as a ratio of total annual output out of the total annual cost [8], thereby any factor that may positively affects annual revenue or negatively affect total annual costs will positively enhance the productivity. The benefits of quality improvement can not only be reflected on decreasing costs, but also on maximizing business profits. In terms of quality improvement, what really counts for a firm is not just cost minimization, but the effect of superior quality has an effect on maximizing profits [9]. This study will explore the positive correlation between the degree of implementation of TQM basing on quality practices that implemented in TQM models and the corresponding productivity index.
II-Literature Review:
The main objective of the current study is to explore and highlight out the impact of Implementation of total quality management on poultry processing plants' productivity. Many researches have been undertaken abroad in nearly similar fields to assess the correlation between implementation of TQM on productivity but there is scarcity of the same researches locally. Many academics and practitioners advocate the positive effects of TQM practices on productivity improvement. Jamshed, H. Khan [8], has studied the impact of implementation of TQM on productivity in Pakistani SME and concluded that there is important and critical need for implementation of TQM to sustain the survival of industries locally and internationally. Thomas J. fisher,[10] argued that basing on several companies undertaking processes which are generally focused on total quality management concept. He concluded that approaches have had a significant impact on operation and relationship inside the organization which have probably contributed to their long-term viability. The direct impact of quality-oriented process is greatly over shadowed by effects of other internal and external factors which influence business performance [10]. Firms with effective TQM implementation can accomplish the internal benefits such as improving quality, enhancing productivity, or realizing better operating income ;[11] Hendricks and Singhal,[12].Arawati Agus et al,[13] in their empirical study explored the impact of TQM on productivity and profitability. Their study investigated the following TQM practices as independents variable top management commitment, customer focus, supplier relationship, training, Employee focus, benchmarking, quality measurement, process improvement and zero defects. They concluded that there were positive effects of all TQM practices on productivity and profitability. Literature review for QM researches that have been undergone shows that TQM implementation has a potential effect on increasing competitiveness [14]; Bayazit & Karpak,[15]. The independent variables used in the present study are TQM practices that considered to have strong correlation with productivity measurement. Top management commitment is the main compass that orientates the implementation of TQM towards creating, values, systems and goals to satisfy customer expectation and improve organization performance and productivity [14]. The customer focus provides awareness to the business to be updated to any environmental change in the field and undergoes the required change needed for product quality and innovative action. Quality oriented training is the most important practices to accustom employees (internal customers) to quality concept, methods and skills. Likewise the other practices of TQM are of the same importance and dully advocated by both practitioners and researchers.
III-Problem Statement:
Total quality management as a new managerial philosophy that becomes an urgent need for any organization to outperform over competitors. Since total quality management is a cost factor overall organizational levels, there should a clear explanation of the TQM implementation value added comparatively with quality cost. Productivity as a business excellence determinant has to be measured against degree of implementation of TQM to clarify the importance of TQM implementation. Thereby the key question of this study is:
Is the implementation of TQM has a positive effects on poultry processing plants' productivity?
The above stated question can be considered as a major question of the study but there are some factors positively or negatively affect the total revenue or the total cost of the plant which can be postulated in the following seven hypnoses:
H1. Top Manage commitment has a positive impact on plant productivity H2. Customer Focus has a positive impact on plant productivity
IV-Research Methodology:
Due to high confidentiality of in poultry in Saudi Arabia the present study used qualitative statistical method to answer the questions of the study. The study questions mainly depend on the degree of implementation of TQM and the corresponding productivity index. There are five steps used in the methodology:
1. Using appropriate constructs to measure degree of implementation of TQM and the corresponding productivity index.
2. Research population and sample 3. Data collection methods 4. Data presentation and analysis.
1-1 TQM Construct:
The effective implementation of total quality management was gauged through inspection of TQM implementation requirements which used in many previous studies. Suairy, Haifa [16]] in her study to the extent of harmonization of employees' values against Quality principles used commitment of top management, customer focus, rewards, training, teamwork, cooperation, measurement system, continual improvement, focus on prevention rather than inspection. Micaela Martínez-Costa and Angel R. Martínez-Lorente,[17] in their study they used Leadership, rewards system, process control, feedback, process management, performance, teamwork and customers orientation as variables for measuring degree of TQM implementation. Many previous researches stated different construct and parameter according to the nature of the study. This study used principles that have positive or negative impacts on productivity parameter variables (annual revenue and total annual). Thereby this study used the followings: top management commitment, rewards & training, customer focus, cooperation and teamwork, measurement system and analysis, prevention focus and continual improvement.
1-2 Productivity Construct:
Productivity is how efficiently a firm or any organization can change input into output in form of goods and services as stated in below formula: [18]
Productivity = output/ input = annual revenue/ annual cost
From above formula point of view, productivity is proportional with factors that positively affect annual revenue and reciprocally proportional with that positively affect annual cost and vice versa. So in order to construct a parameter to gauge productivity we have to point out factors that correlated with TQM, cost and revenue. The postulated factors for revenue are production rate, efficiency,
effectiveness, competitiveness. The cost factors were compared against the value added of quality against quality cost such as deterioration of raw material and rework etc.
2- Research Population and Sample:
Three out of eight poultry processing plants that effectively implement total quality management were purposively used to represent the whole community. The sample survey respondents were purposively selected from each plant which encompassed staffs that are aware of TQM requirements and its implementation. The sample consisted of 75 respondents included quality team, production supervisors, quality and production managers and Management representative (MR) in quality council.
3- Data Collection Method:
Data was collected by questionnaires tools. The questionnaire consisted of three parts. The first part was about the demographic profile the respondents. The second part was design to measure the degree of implementation of TQM. The third part of the questionnaire was designed to measure the corresponding productivity index.
4-Data Presentation and Analysis:
analysis was applied to check association of variables with each other and the extent of variance which determines the coefficient of determination independent variable.
V- Research Findings and Discussion
V-1-Reliability of Data:
The construct was tested by using SPSS. The reliability was tested by using Cronbach's Alpha. Tab 1 illustrates test results:
Tab 1: Reliability Test
In review the Alpha coefficients values for constructs variables, it was found that most of the coefficients of independent variables lay in the range between 0.737 and 0.887 which means the construct was reliable to measure the degree of implementation of quality practices. On the other hand only two variables are of less reliability comparing with the values of the remaining dependent variables. These variables are customer focus 0.503 and measurement system 0.684 but both of them are over 0.500 which to some extent are considered reliable values but comparatively weak with the others variables. The coefficient of dependent variable '' productivity'' was found to be 0.747 which lays in the acceptable range.This means that individual constructs were reliable to measure the parameters of productivity.
V.2 Research Sample Demographic Analysis:
In demographic analysis of the sample, it was found that 91.6% of respondents are less than 40 years and more than 75% having qualification of bachelor and above. 45.8% of staff having professional experience more that 5 years where as about 37.5 % having experience varies between 5 and 2 years. This indicates that the study sample is well educated with a good experience in quality management which creates rational answers of questionnaire. Despite that there is a weakness in training programs where there were 43.5 % of the respondents have never attended any training program where as those attending fundamental knowledge in TQM course were about 37% and those attended professional course are only 16.7% and the remains are missed answer.
SN. Variables No. of
Items
Reliability coefficient 1. Top management commitment 4 0737.
2. Customer Focus 4 0.5o3
3. Continual Improvement 6 0.828
4. Cooperation & Teamwork 6 0.825
5. Prevention Focus 8 0.877
6. Measurement System 5 0.684
7. Rewards & Training 5 0.887
Tab 2. Respondents Profile
V.3 Correlation Analysis:
The correlation coefficient is utilized in assessing the relationship between the dependent variables and independent ones. This coefficient answered the three questions, the first one is there any relationship between the two foresaid variables, if so what the direction of this relationship (positive or negative impact etc.) and it also answer the magnitude of this correlation. [19]
The values of correlations between dependent variable productivity (PRD) and independent variables TQM practices was found that there is a positive correlation between productivity and TQM practices in the construct as illustrated in Tab.2 and fig. 1
Tab2. Correlation between TQM practices and productivity
PRD MC CF Coop&twk Meas -syst
Con-Imv
Rew& Traing
PrevF
PRD 1 0.630 0.687 0.715 o.666 0.640 0.637 0.819
MC 0.630 1 0.706 0.744 0.785 0.708 0.690 0.852
CF 0.687 0.706 1 0.758 0.755 0.714 0.311 0.823
Coop&twk 0.715 0.744 0.785 1 0.651 0.617 0.569 0.875
Meas-syst 0.666 0.785 0.755 0.651 1 0.332 0.387 0.718
Con-Imv 0.666 0.708 0.417 0.617 0.333 1 0.860 0.768
Rew&traing 0.637 0.690 0.311 0.596 0.376 0.860 1 0.735
PrevF 0.819 0.852 0.823 0.875 0.718 0.768 0.735 1
Value of correlation of dependent variable productivity with management commitment (MC) is 0.630, 0.687 with customer focus (CF) and the same manner the other variables. High correlations were found between productivity and prevention focus (PrevF) and cooperation and teamwork o.819, 0.715 respectively. In addition to the correlation of TQM practices with productivity there correlation between TQM variable with each other which are statistically significant e.g. the correlation between prevention focus management commitment, customer focus and cooperation & teamwork were found to be 0.852, 0.823, 0.875 respectively and so on as stated in tab.2.
Variables Freq. % Variables freq %
Nationality Specialization Field
1- Saudi 42 58.3 Veterinary 9 12.5
2- Non-Saudi 30 41.7 Animal Production 30 41.7
Missed answer 0 0 Food Technology 15 20.8
Total 72 100 Science 12 16.7
Age Other 6 8.3
Less than 2oyrs 0 0 Missed answers 0 0
20 -30 yrs 33 45.8 Total 72 100
31-40 yrs 33 45.8 Training in Quality Field
Over 40yrs 6 8.4 None 30 43.5
Missed answer 0 0 Fundamental courses 27 37.5
Total 72 1oo Professional courses 12 16.7
Academic Qualification Missed answers 3 4.2
Primary - intermediate 0 0 Total 72 100
High school 0 0 Experience
Diploma 15 20.8 Less Than 1 Yrs 3 4.2
Bachelor 51 70.8 1-2 yrs 18 25
High Studies 3 4.3 Above 2 Yrs.- 5yrs 9 12.5
Missed answer 3 4.3 Above 5 Yrs. 33 45.8
Total 72 100 Missed Answers 9 12.5
Fig. 1 Correlation between Quality practices and productivity
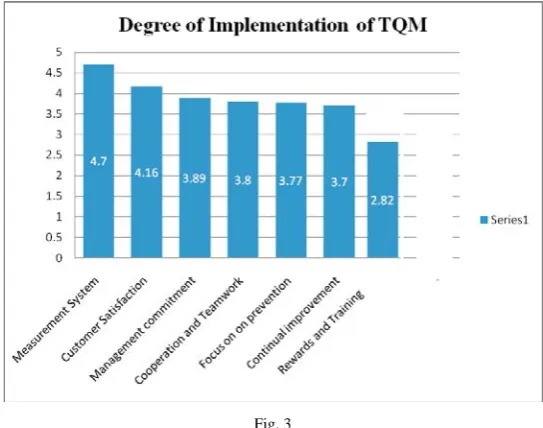
The degree of implementation of TQM in the study sample as illustrated in fig 2 shows high value of implementation of measurement system and analysis of 4.7 value and less value of implementation of rewards and training of 2.82 value. The overall degree of implementation of TQM practices can be arranged as follow starting from high degree of implementation to the less one, measurement system and analysis, customer Focus, management commitment, cooperation and teamwork, continual improvement, rewards and training.
Fig. 3
V.4 Multiple Regression Analysis
Multiple regression analysis is technique that used to explore the nature of a relationship between two groups of continuous random variables. Regression model is used to quantify the relationship between the two groups. Multiple regression equation method involves a linear combination of explanatory variables (independent) [20]. The present study consist of seven independent variables which encompass top management commitment, Customer focus, measurement system and analysis, cooperation and teamwork, continual improvement, prevention focus and Reward & training. Accordingly a multiple regression equation was developed as follows:
Prod = β0 +β1 MC+ β2 CF+ β3 MS+ β4 CTWK+ β5 CIMV+ β6 PrevF+ β7 RWDTR +ε
Where as:
Prod= Mean productivity
Y
0 0.2 0.4 0.6 0.8 1 1.2
PR D
MC CF
Coop& twk
Mea s-s
yst
C on-Imv
Rew &trai
ng Prev
F
β0= constant of proportionality
MC= management commitment CF= Customer Focus
MS= Measurement System and analysis CTWK= Cooperation & Teamwork CIMV= Continuous Improvement PrevF= Prevention Focus
RWDTR= reward and training
ε = error
The regression equation can be stated as follow as per details in tab. 4
Prod = 0.837 +0.383MC+ 0.378 MS+ 0.230CIMV+0.495PrevF+ 0.153 RWDTR +ε
In the model summary Tab.3 shows the result on entering of seven independent variables against productivity. R (0.890) is a correlation of the seven dependent variables with productivity. Taking in consideration the interaction and correlation between the dependents variables, the regression models shows R2 as (0.792) which indicated that 89% of variation in productivity value of the studied sample can be dully explained by the seven dependents variables. This value of R2 substantiates the model and the hypotheses of the study.
Tab. 3 Model Summary
Model R R-Squared Adjusted R Squared
Std. Error of the Estimate
1 0.890a 0.792 0.719 0.22140
Reference to the seven developed hypotheses regarding the independent variables which advocate the positive relationship with poultry processing plants' productivity, tab. 4 shows the values of β-coefficients of these predictor variables.
Tab. 4 Coefficients a
Model
Un-standardized Coefficients
Standardized Coefficients
β Std. Error Β T Sig.
1 constant 0.837 0.512 1.635 0.120
MC -o.383 0.134 -0.746 -2.851 0.011
CF -0.016 0.197 -0.020 -0.082 0.936
CTWK -0.027 0.113 -0.57 -0.242 0.936
CIMV 0.230 0.122 0.413 1.883 0.077
MS 0.378 0.145 0.564 2.603 0.015
PrevF 0.495 0.225 0.811 2.197 0.042
RWDTR 0.153 0/054 0.396 2.843 0.006
The values of β-Coefficients of prevention Focus, management commitment, measurement system and reward & training are statistically significant and dully substantiate our hypotheses regarding these four variables. Where as customer focus and cooperation and teamwork β-Coefficients are not statistically significant and of less contributions in the in the regression equation that measured the productivity. The continual improvement
β-Coefficient is of considerable value in the regression equation and its statistical significance can be estimated in a considerable range.
VI- Conclusion:
This study can be utilized by firms that target to maximize their productivity by using and activating the critical factors in productivity parameter.
References
[1] Unknown Author, Ministry of Agriculture, Food Balance Sheet, the period (2002-2004) to (1999 – 2001): (KSA, 2009) p3 [2] Deming, W. Edward , Out of the Crisis, MIT Press, Cambridge, 1986. p25
[3] Crospy, P, B, Quality is Free: The art of making quality certain, New York, N. Y, 1979, p 21
[4] Fardous Husain and Rachi Jain, Financial Structure, Production and Productivity Growth in U.S.A Food Manufacturing Industry ,Meeting of AAEA, Chicago, Aug. 28th.2001, P 12
[5] Juran, J.M, Juran on planning for Quality, New York, N.Y, McGrow-Hill, 1983, p 4
[6] Chengen Fan, How fast have China's Agricultural Production and Productivity Really been growing? ,International Food Research Institute, Chicago, Oct. 1997, P3
[7] John Janseen & Simon McLaughlin, New Zealand's Productivity Performance, New Zealand Treasury, Willington, April 2008 p4. [8] Jamshed H. Khan, Impact of Total Quality Management on Productivity,(The TQM Magazine, VOL 15 ISS:6 ) PP 374 - 380 [9] Freiesleben, J. the economic effects of quality improvement, Total Quality Management, 16(7), 2005, pp. 915-922.
[10] Thamson J. Fisher, The Impact of Implementation of Quality Management on Productivity, International Journal of Quality and Reliability Management VOL9 ISS:3 ,2003
[11] Corbett, C.J., Montes-Sancho, M.J. & Kirsch, D.K. , The financial impact of ISO 9000 certification in the United States: an empirical analysis, Management Science, 51(7), 2005, pp. 1046-1059.
[12] Hendricks, K.B. & Singhal, V.R. Does implementing an effective TQM program actually improve operating performance? Empirical evidence from firms that have won quality awards, Management Science, 43(9), 1997, pp. 1258-1274
[13] Arawati Agus, Mhd. Suhaimi Ahmed and Jaafar Muhammad, An Empirical Investigation on Impact of Quality Management on productivity and Profitability: Associations and mediating effect, cotemporary Management Research, Vol. 5, March 2009, PP 77-92. [14] Ahire, S. L, Golhar, D. Y & Waller,M.A, Development and Validation of QM Implementation Constructs , Decision Science,27(1),
1996, pp 23-55.
[15] Barazit, Ozden & Kapak, Birsen (2007). An analytical network process-based framework for successful total quality management (TQM): An assement of Turkish manufacturing Industry Readiness, International Journal of Production Economics, v105, pp 79-96 [16] Haifa Suairy, The Extent of Harmonization of Employees' Values with TQM principles: A survey on Saudi Basic Industries (SABIC)
,King Saud University , 2000, pp75-80
[17] Martinez-costa, M. and Martinez-Lorente, A. R. , ISO 9000 as a tool for TQM: a Spanish case study, Quality Management Journal, vol. 11, 2004, pp. 20-30.