ACTUAL AND POTENTIAL COMPUTER USE BY
A GROUP OF PRIMARY PRODUCERS
P L Nuthall
Research Report No.214
May
1992
Agribusiness & Economics Research Unit
PO Box 84
Lincoln University CANTERBURY
Telephone No: (64) (3) 325 2811 Fax No: (64) (3) 325 3847
The Agribusiness and Economics Research Unit (AERU) operates from Lincoln University providing research expertise for a wide range of organisations concerned with production, processing, distribution, finance and marketing.
The AERU operates as a semi-commercial research agency. Research contracts are carried out for clients on a commercial basis and University research is supported by the AERU through sponsorship of postgraduate research programmes. Research clients include Government Departments, both within New Zealand and from other countries, international agencies, New Zealand companies and organisations, individuals and farmers. Research results are presented through private client reports, where this is required, and through the publication system operated by the AERU. Two publication series are supported: Research Reports and Discussion Papers.
The AERU operates as a research co-ordinating body for the Economics and Marketing Department and the Department of Farm Management and Accounting and Valuation. This means that a total staff of approximately 50 professional people is po-tentially available to work on research projects. A wide diversity of expertise is therefore available for the AERU.
The major research areas supported by the AERU include trade policy, marketing (both institutional and consumer), accounting, finance, management, agricultural economics and rural sociol-ogy. In addition to the research activities, the AERU supports conferences and seminars on topical issues and AERU staff are involved in a' wide range of professional and University related extension activities.
Founded as the Agricultural Economics Research Unit in 1962 from an annual grant provided by the Department of Scientific and Industrial Research (DSIR), the AERU has grown to become an independent, major source of business and economic research expertise. DSIR funding was discontinued in 1986 and from April 1987, in recognition of the development of a wider research activity in the agribusiness sector, the name of the organisation was changed to the Agribusiness and Economics Research Unit. An AERU Management Committee comprised of the Principal, the Professors of the three associate departments, and the AERU Director and Assistant Director administers the general Unit policy.
AERU MANAGEMENT COMMITTEE 1992
,
Professor A C Bywater, B.Sc., Ph.D. (Professor of Farm Management) Professor A C Zwart, B.Agr.Sc., M.Sc., Ph.D.
(Professor of Marketing)
AERU STAFF 1992
)lrector
Professor AC Zwart, B.Agr.Sc., M.Sc., Ph.D. ~ssistantDirector
R L Sheppard, B.Agr.Sc. (Hons), B.B.S. tesearch Officers
G Greer, B.Agr.Sc. (Hons)
L S Storey, DipTchg, B.Sc., M.Soc.Sc (Hons)
RL Sheppard, B.Agr.Sc. (Hons), B.B.S. (Assistant Director, AERU)
Research Officers
JR Fairweather. B.Agr.Sc., B.A., M.A., Ph.D. S. S. F. Gilmour, B.A., MA (Hons)
T.M. Ferguson, B.Com. (Ag) Secretary
JClark
CONTENTS
LIST OF TABLES
PREFACE
ACKNOWLEDGEMENTS
Page
(iii)
(v)
CHAPTER 1
CHAPTER 2
INTRODUCTION
METHOD
1
3
CHAPTER 3 RESULTS 5
3.1 Uptake Level 5
3.2 Hardware and Software Factors 8
3.3 Economics and Value 11
3.4 Types of Computer Activities 13
3.5 Computer Use Practices 15
3.6 Financial Recording and Analysis Practices 21
CHAPTER 4
REFERENCES
CONCLUSION 27
29
Table
LIST OF TABLES
Page
1 Occupation of Respondents 4
2 Percentage of Producers with a Computer 5
3 Number of Properties (Farms Mainly) Serviced by Each Computer 6
4 Gross Income from Respondents' Properties 6
5 Number of Labour Units (Excluding Manger) Employed per Farm 7
6 Type of Microcomputer Used 8
7 Types of Software Used 9
8 Length of Ownership - "Users" 9
9 Views on Software Updates 10
10 Why People Do Not Update Software 10
11 Respondents' Belief of the Percentage of Computer Owners
Using the Named Types of Software 11
12 Profitability Beliefs of Computer Owning Respondents 11
13 Advantages of a Computer System 12
14 Disadvantages of a Computer System 13
15 Hours per Month Spent on Business Activities 14
16 Pre-Computer Recording and Analysis 15
17 Time Spent on Computer Operations 16
18 Frequency of Computer Use - Number of Times Turned on Each Month 16
19 Sources of Assistance 17
20 Computer Operator 17
21 Problems and Difficulties 18
22 Workshop Features 19
23 Reasons for Not Attending Workshops 19
24 Number of Clients Serviced by Accountants,
Consultants and Bureau Computers 20
25 Financial Systems Used by Non-K.F.M.U. Clients 21
26 Options Used Frequently in Financial Packages 22
27 Use of Financial Package Reports 23
28 Accounting Practice - Single or Double Entry System 24
29 Goods and Services Tax Return Period 24
30 Inclusion of G.S.T. in Transaction Records 24
31 Source of Financial Data 25
32 Frequency of Using a Financial Package 25
33 Adequacy of Financial Packages 26
34 Longer Run Use of Computers 27
35 Type of Computer Use in the Longer Run 28
PREFACE
Within the urban business environment, computer use has escalated dramatically over recent years. This escalation reflects both the tremendously increased processing power available from small machines and the fall in the real cost of computing.
In the rural sector, computer adoption has also been significant, although not at the rate evident in the urban scene. In order to identify the level andtypeof computer use practised by rural businesses, especially farmers, a survey was carried out by the Kellogg Farm Management Unit at Lincoln University. The results of that survey are presented in this Research Report.
The Agribusiness and Economics Research Unit has a continuing interest in farmer decision making, the information sources used and the aids employed in making farm business decisions. This Research Report provides information on the computing side of farmer decision making and provides useful insight to that process. We anticipate that publication of these research results willbe of considerable interest to those interested in farm business management and to those involved in providing computer hardware and software to the rural sector. We also anticipate that these research results will enable those servicing the rural sector to make more effective contributions to farmer decision making and so help to enhance the efficiency of the farm management process.
Ron Sheppard Assistant Director
ACKNOWLEDGEMENTS
Many people were involved in this survey, particularly the staff of the Kellogg Fann Management Unit. Without this involvement it would not have been possible to conduct such a large undertaking. For data coding and entry, Mr P Smith and Mrs S Clemes were heavily
involved and Mr P McCartin organised the computer runs. Mrs M Pascoe produced the
typed version. Mrs J Clark prepared the manuscript for publication.
CHAPTER ONE
INTRODUCTION
The use of computer based decision support systems is a vitally important area of study. In ten years the number of producers relying on computer systems as an important piece of decision technology has grown from zero to a significant number. The uptake of computers is still increasing, or it at least appears that this is the case. A more definite statement is not possible due to the lack of an extensive random survey in recent times. Few would doubt, however, that computer uptake will stop before the majority of producers have one, though this level of penetration will take many years and, on some properties, a generation change.
To date, people developing software, support and training systems, have relied on informed observations, experience and the feedback from a limited number of surveys. The study reported in this publication is the most extensive survey available in New Zealand which reports on the views of both existing computer users and those who have yet to acquire one.
The survey acquired producers' responses to a wide range of questions. These included what they believed the value of a computer was, what the operating costs were through to the problems they have encountered as well as their experiences with various packages. The questions were designed to provide, firstly, information highlighting where future developments should take place and, secondly, data to indicate to non-computer owners the benefits and problems they might encounter.
The producers invited to take part in the survey were all recipients of the Kellogg Farm Management Unit's (KFMU) newsletter. In no way can the respondents be regarded as a random sample. The recipients are the people who have purchased software from the Unit, and all those who have expressed an interest in receiving the newsletter. This publication is delivered free of charge on a quarterly basis and contains articles of interest to producers who use, or might potentially use, a computer. While the majority of recipients are primary producers, rural accountants, consultants and associated groups also receive copies. There are also a few' allied industry' recipients and examples include aruralservice station, a rural school and tertiary education establishments. The newsletter is distributed on both sides of the Tasman, though the majority are received at New Zealand addresses. The monetary values reported have all been converted to N.Z. dollars.
The respondents must be seen as a group with a real interest in computers, though if the sample had, in fact, been randomly selected it must be recognised those replying would have tended to have an interest in computers anyway. This is borne out by some U.S. and Australian studies in which the percentage with computers far exceeded what could possibly be the case given the statistics on computer sales. The Australia study (Kondinum) suggested some 50 % and the U.S. study (Novak and Stegelin 1988) 57 % of respondents had a computer. It is patently clear that those with a real interest in computers responded. Inthis current study 73 %of respondents had a computer.
Due to the non-random nature of the 'sample' , statistical significance studies were not carried out. The results must be simply seen as the opinions of a major section of the computer owners in New Zealand and Australia.
CHAPTER TWO
METHOD
In January 1990 questionnaires were sent to 1247 users of K.F.M.U. software and to 2332 people who were 'non-users'.
In the tables that follow, these two groups are mentioned as separate entities. This provides food for thought about the attitudes of one group who are clearly early innovators relative to 'non-users' who are still innovators, but are not, on average, using computers for management to the same extent.
In April 1990 another questionnaire was sent toall those who had not returned a completed questionnaire. Then, in July 1990, a reminder was forwarded to all non-respondents. Over the summer of 1990/91 coding of the replies was undertaken, so effectively the cut off point for returns was October 1990.
Prior to the first mailing of the questionnaire the schedule was pre-tested on eight professionals, three farmers and one consultant. Their suggestions were largely incorporated into the final questionnaire.
Two different questionnaires wereused - one for 'users' and the other for 'non-users'. The majority of the questions were the same, but re-ordering occurred so that 'non-users' without a computer had only to complete the first few pages.
Replies were obtained from 639 'users' (51.2%) and 1063 users' (45.6%). Of the users', 605 had computers (56.9%) leaving 458 non-owners. Of the computer-owning 'non-users' someusedspecialist agricultural software from a range of N.Z. and Australian sources (33.8%), but the majority relied on wordprocessors and spreadsheets as their major business software.
The results were obtained using SAS.
The occupations of the respondents are given in Table 1.
Table 1
Occupation of Res.pondents (percentages)
'Users' 'Non-users' Combined
Sheep farmer 34.3 30.9 32.1
Cattle farmer 4.7 8.5 7.1
Dairy farmer 15.5 22.1 19.7
Crop farmer 2.2 0.3 1.0
Mixed farmer 20.0 10.2 13.7
Other animal farmer 2.0 3.4 2.9
Orchard/fruit producer 4.5 6.2 5.6
Vegetable producer 0.8 0.6 0.7
Ornamental/flower producer 0.5 0.4 0.4
Accountant 2.0 2.4 2.3
Consultant 6.0 4.0 4.7
Computer agent 0.8 0.2 0.4
Software consultant 1.2 1.2 1.2
Teacher/lecturer 0.5 2.1 1.5
Student 0.5 1.0 0.8
Contractor 3.3 1.1 1.9
Secretary 0.5 0.1 0.2
Other 0.7 5.3 3.8
Number of Valid Replies 600 1058 1658
There are no major differences between the groups other than in the mixed farming category.
CHAPTER THREE
RESULTS
3.1 Uptake Level
Batte et al. (1990) review the percentages of producers with a computer as reported in a number of U.S. studies. Each was conducted in a different area. The figures include 15% of New York dairy farmers (1988), 31 % from a random telephone study, 25% of Californian farmers (1986), and 16% of Ohio farmers (1990). The last random survey in New Zealand was in 1986 (Pryde and McCartin (1987» at which time 6% had a computer and an additional 4% regular access to a computer. Since then the numbers have increased markedly.
The current survey contained a question asking respondents what they believed the adoption rate to be. The result is given in Table 2.
Table 2
PercentaJ:e of Producers With a Computer (Percentage Believing Uptake is Within Specific Ranges)
% of All Producers 'Users' 'Non-users' Combined
0- 4 27.3 58.9 47.7
5 - 10 56.1 31.9 40.5
11 - 15 5.3 3.4 4.0
16 - 20 5.1 3.1 3.8
21 - 25 1.7 0.5 0.9
>
25 4.5 2.2 3.1Number of Respondents 472 862 1334
Using the 'combined' percentages the overall average belief is that 8.4% of all producers have a computer. This is surprisingly low given the 1986 figure and is doubtful as an estimate of the true adoption level. The respondents, of course, are only casual observers of the true figure.
While the survey did not target factors affecting uptake, there were questions on the number and size of properties serviced by the computer. Table 3 gives information on the number of farms, Table 4 on their gross income, and Table 5 on the number of labour units employed.
Table 3
Number of Properties (Farms Mainly) Serviced by Each Computer (Percentages)
No. of Farms 'Users' 'Non-users' Combined
1 74.4 78.8 76.3
2 17.6 13.1 15.7
3 5.1 4.7 4.9
4 1.3 1.4 1.3
> 4 1.6 2.0 1.8
No of Respondents 472 358 830
While by far the majority are single property units, a significant number of computer owners have the records of two or more farms on their computer. A small number of users are clearly bureau operators.
Table 4
Gross Income From Respondents' Properties
Ran&e 'Users' 'Non-users' Combined
< 100,000 11.7 22.9 16.5
100,000 - 200,000 29.4 38.5 33.5
200,001 - 300,000 19.4 15.0 17.5
300,001 - 400,000 12.0 9.8 11.0
400,001 - 500,000 9.6 4.9 7.6
500,001 - 600,000 5.2 2.4 4.0
600,001 - 700,000 3.0 0.9 2.1
700,001 - 800,000 1.6 1.8 1.7
800,001 - 900,000 1.4 0.6 1.1
900,001 - 1,000,000 2.3 0.9 1.7
>1,000,000 4.4 2.3 3.5
7
It appears 'Users' have a higher gross income than the other group, and this is borne out by the average gross income figures ($399,263 for 'Users' and $285,742 for 'Non-Users'). It is also clear that producers interested and involved in computers have larger businesses than the general population of farmers. The N.Z. Meat and Wool Board's Economic Service (1991) reports that for N.Z. Sheep and Beef Farms the gross income for 1988/89 was $128,536, the provisional figure for 1989/90 was $138,600 and the 1990/91 estimate $121,500. In Australia the average forecast for the gross cash income across all properties over 1990/91 is approximately A$192,000 (based on figures from Agriculture and Resources Quarterly (1990) and a property population of 115,346 units).
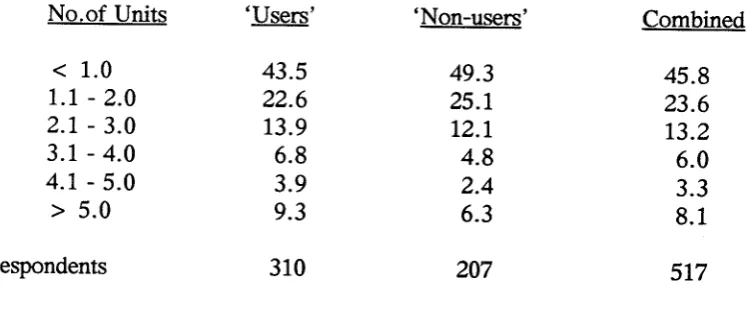
Table 5
Number of Labour Units (Excluding Manager> Employed Per Farm
No.of Units 'Users' 'Non-users' Combined
< 1.0 43.5 49.3 45.8
1.1 - 2.0 22.6 25.1 23.6
2.1 - 3.0 13.9 12.1 13.2
3.1 - 4.0 6.8 4.8 6.0
4.1 - 5.0 3.9 2.4 3.3
> 5.0 9.3 6.3 8.1
No of Respondents 310 207 517
The average for 'Users' was 2.95, and for 'Non-Users' 2.33 units. These figures re-inforce the fact that producers interested in computers tend to be larger units than the typical property (for example, the average N.Z. sheep farm spent $6582 on wages, excluding the manager, over 1988/89 (Meat and Wool Board's Economic Service (1990»).
3.2 Hardware and Software Factors
The newsletter readers were asked a range of questions about their hardware and software type and use. The responses are presented in the following tables.
Table 6
'[ype of Microcomputer Used (Percentages)
MSDOS
*
based. CP/M # based. AppleOther
No of Respondents
'Users'
95.3
3.1
1.4
0.2584
'Non-users'
81.9
3.5
6.3
8.3
602
Combined
88.5
3.3
3.9
4.31186
*
MSDOS Microsoft Disk Operating System# CP/M Control Program for Microcomputers
As the K.F.M.U. software is designed for MSDOS based. computers (and the earlier CP/M) it is clear most 'Users' would have MSDOS machines and, to a certain extent, also 'Non-Users'. The higher 'Other' for 'Non-Users' probably indicates the purchase of games orientated computers for family reasons. Some of the Apple computers would have CP/M cards.
Table 7 contains information on the general types of softwareusedby respondents. Focusing on the NEVER column, itis clear that word-processing is a major component of computing, and that spreadsheets and specialist agricultural software are also very important. As
expected, specialist agricultural software is much more important to 'Users' than 'Non-Users', and spreadsheets of greater relevance to 'Non-Users' than 'Users'.
9
Table 7
1J'pes of Software Used
(Percentages Using Frequently, Occasionally or Never)
Frequently Occasionally Never
'Users' 'Non- Com- 'Users' 'Non- Com- 'Users' 'Non-
Com-users' bined users' bined users' bined
Spreadsheet 44.1 62.4 52.1 24.1 22.0 23.2 31.8 15.6 24.7
Home*programs 7.6 20.1 13.1 8.5 9.8 9.1 83.9 70.1 77.8
Wordprocessor 60.3 65.7 62.7 30.3 30.3 30.3 9.4 4.0 7.0
Data base package 14.9 21.6 17.7 16.3 21.6 18.6 68.8 56.8 63.7
Agricultural+software 81.0 33.8 60.2 11.7 6.6 9.5 7.3 59.6 30.3
Utility packages# 22.9 27.3 24.8 19.7 22.5 20.9 57.4 50.2 54.2
Other (non-agric)+ 9.1 15.1 11.7 1.7 3.1 2.3 89.2 81.8 85.9
No of Respondents 'Users' 590. 'Non-Users' 458.
* 'Home' means programs writtenbycomputer owners or friends.
+ 'Agricultural' means specialist professionalprogramswrittenfor agriculture and/or horticulture.
# Utility packages refer to menu overlays, memory resident notepads and the like.
When asked how long they had owned their computer, the 'Users' gave 3.5 years, and the 'Non-Users' 3.08 years. For the 'Users' the period of ownership was as shown in Table 8.
Table 8
Length of Ownership - Users (Percentage)
<
2 years 3-4 years 5-6 years 7-8 years>
8 yearsNo of respondents
=
61534.0 31.2 23.3 7.8 3.7
It would appear that as the years progress the number of adoptees is increasing, though the increase in the last two years is not as great as in the previous two years.
Computer replacement was focused on by asking how long it would be before a new computer was purchased. 'Users' gave an average of 4.33 years (441 replies) and an expected cost of $4750, whereas 'Non-Users' gave 3.14 years and a cost of $3683 (476 replies) . Combining these figures with the average holding time would suggest producers plan on keeping their computer approximately 6 to 8 years.
Views on whether they will have a hard disk and colour screen in their new computer are quite clear. Across all respondents 98.46% will have a hard disk and 80.49% a colour screen.
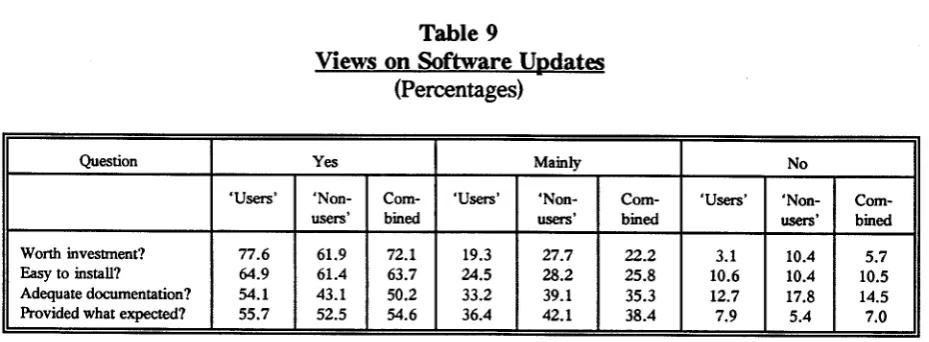
Turning to software updates, respondents were asked about their attitude to these. Table 9 liststhe views of those obtaining updates (new versions) and Table 10 of those who have not obtained an update.
Table 9
Views on Software Updates (Percentages)
Question Yes Mainly No
'Users' 'Non- Com- 'Users' 'Non- Com- 'Users' 'Non-
Com-users' bined users' bined users' bined
Worth investment? 77.6 61.9 72.1 19.3 27.7 22.2 3.1 10.4 5.7
Easyto install? 64.9 61.4 63.7 24.5 28.2 25.8 10.6 10.4 10.5
Adequate documentation? 54.1 43.1 50.2 33.2 39.1 35.3 12.7 17.8 14.5
Provided what expected? 55.7 52.5 54.6 36.4 42.1 38.4 7.9 5.4 7.0
No of Respondents 'Users' 379, 'Non-Users' 202
It is interesting to note the especially small numbers of 'Non-Users' replying to this question, and also the small numbers of 'Users'. As will be clear from the next table (Table 10), many people feel they do not need updates.
Of those that do, they are mainly satisfied with the worth of their investment and the ease of installation. However, they are not totally satisfied with the documentation and description of what to expect.
Table 10
Why People Do Not Update Software (Percentages)
Question Yes Mainly No
'Users' 'Non- Com- 'Users' 'Non- Com- 'Users' 'Non-
Com-users' bined users' bined users' bined
Didn't know available 18.2 18.4 18.3 4.5 5.4 5.0 77.3 76.2 76.7
Costtoogreat 6.8 15.6 11.5 18.2 10.2 14.0 75.0 74.2 74.5
Benefits NOT clear 17.4 20.4 19.0 16.7 18.4 17.6 65.9 61.2 63.4
Current version OK 51.5 64.6 58.4 29.5 24.5 26.9 19.0 10.9 14.7
Don't know how 8.3 11.6 10.0 9.1 7.5 8.2 82.6 80.9 81.8
Forgot to order 9.8 3.4 6.4 11.4 4.8 7.9 78.8 91.8 85.7
Other 25.0 11.6 17.9 6.1 0.0 2.9 68.9 88.4 79.2
11
As noted above it appears the main reason for not updating is a belief that their current version is acceptable. However, the number of respondents is quite small. The 'benefits NOT clear' category also bears consideration.
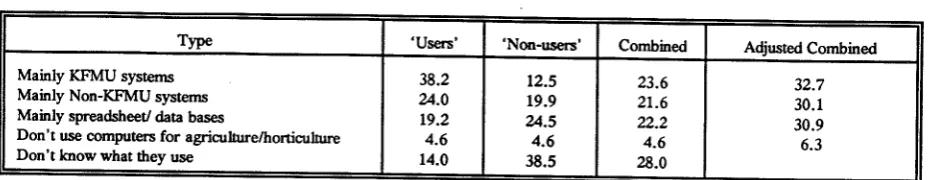
Of interest to the K.F.M.U., and other software groups, is the proportion of computer owners who use proprietary software. Thus, respondents were· asked the source and typeof software used by colleagues with a computer. Table 11 contains a summary of the responses.
Table 11
Respondents' Belief of the Percentage of Computer Owners Using the Named 'lJrpes of Software
Type 'Users' 'Non-users' Combined Adjusted Combined
Mainly KFMU systems 38.2 12.5 23.6 32.7
Mainly Non-KFMU systems 24.0 19.9 21.6 30.1
Mainly spreadsheet! data bases 19.2 24.5 22.2 30.9
Don't use computers for agriculturelhorticu1ture 4.6 4.6 4.6 6.3
Don't know what they use 14.0 38.5 28.0
No of Respondents 'Users' 374, 'Non-Users' 485.
Ifthe 'Don't Knows' are distributed into the other groups based on the same proportion, the figures in the right hand column are obtained. This would suggest about a third of computer owners use K.F.M. U. software, a third use other brands of specialist software and a third use primarily spreadsheets and general data base packages as their medium for keeping and analysing management data. Ifonly the beliefs of the 'Users' are taken, the figures swing towards K.F.M.U. software, whereas the 'Non-Users' swing the other way. Inassessing the combined and adjusted figures note that more 'Non-Users' responded than 'Users'.
3.3 Economics and Value
The comments of existing 'Users' are of crucial impOrtance in allowing 'non-computer' producers to assess whether they should become involved. The following tables give the respondents' beliefs on the advantages, disadvantages, costs and returns of computer use.
Table 12
Profitability Beliefs of Computer Owning Respondents (Percentages Believing in Each Category)
'User' 'Non-user' Combined
Profitable investment 57.9 54.2 56.3
Just breaks even 8.6 15.3 11.5
Does not cover costs 9.7 11.0 10.3
Don't know 23.8 19.5 21.9
A tenth of the respondents are convinced a computer is not an economic investment in equipment and time, and some 70% consider that computers are profitable. This is clearly a significant number and assuming some of the 'don't knows' actually gain an economic benefit, the real proportion is in fact greater than 70%. While farming conditions are quite different in the U.S., it is still interesting to note Batte et al.(1990) found 83% of a sample of Ohio farmers believed their computer was 'useful', and Novak and Stegelin (1988) found 93% of their survey respondents were 'satisfied' with their computer experiences.
When asked what the actual dollar PROFIT was for their computer, 'User' respondents gave an average of $5519 (standard deviation 11929) and 'Non-Users' an average of $3954 (standard deviation 11576). Note, however, that only 121 'Users' and 192 'Non-Users' were prepared to give a figure. Given the current cost of computer systems, if these estimates are reasonably accurate, a computer clearly provides a good return on capital. Whether the respondents allowed for a labour charge on their estimate is certainly not clear so this factor must be taken into account.
For running costs, 290 'Users' gave an annual average cost of $548 (standard deviation 741) and 'Non-Users' (369 of them) a cost of $489 (standard deviation 1300). It seems K.F.M. U. software Users spend and make more. Perhaps this reinforces the old adage of 'spending to make'.
When it comes to tabulating the specific advantages and disadvantages of using a computer the respondents' views are given in Tables 13 and 14.
Table 13
Advantal:~ of a Computer System
(Percentages Believing Whether Various Advantages are Relevant)
Benefit VeryImportant Important Not a Factor
'Users' 'Non- Com- 'Users' 'Non- Com- 'Users' 'Non-
Com-users' bined users' bined users' bined
Saving time 49.6 59.8 54,1 33.0 26.9 30.3 17.4 13.3 15.6
Selecting best products 12.1 10.5 11.4 21.3 20.1 20.8 66.6 69.4 67.8
Controlling expenditure 52.9 51.1 52.1 32.9 31.0 32.1 14.2 17.9 15.8
Feed supply management 5.5 5.9 5.7 11.8 15.1 13.2 82.7 79.0 81.1
Cash/fmance management 73.5 74.9 74.1 20.4 17.9 19.3 6.1 7.2 6.6
Easier record keeping 73.5 67.2 70.7 22.7 26.2 11.5 3.8 6.6 17.8
Office management 44.5 38.9 42.0 33.9 35.1 34.4 21.6 26.0 23.6
Peace of mind 37.2 38.9 37.9 30.6 32.1 31.3 32.2 29.0 30.8
Production records 20.8 24.7 22.5 29.8 28.4 16.7 49.4 46.9 60.8
Other 6.4 7.2 6.7 0.9 0.2 0.5 92.7 92.6 92.8
No of Respondents 'Users' 578, 'Non-Users' 458.
13
even less see 'selecting best products' as important. These results are similar to at least one U.S. study. Novak and Stegelin (1988) asked respondents to rank various uses and found 'accounting records', '[mancial decision aid' and 'production decision aid' were listed one, two and three.
Table 14
Disadvantages of a Computer System
(Percentages Believing Whether Various Disadvantages are Relevant)
Problem VeryTrue Occasionally True .- Not True
'Users' 'Non- Com- 'Users' 'Non- Com- 'Users' 'Non-
Com-users' bined users' bined users' bined
Excessive time 8.9 13.2 10.9 57.9 54.8 56.5 33.2 32.0 32.6
Frustrating/wrong 9.6 7.7 8.8 45.4 44.9 45.2 45.0 47.4 46.0
Re-leaming required 18.5 17.4 18.0 43.3 39.2 41.5 38.2 43.4 40.5
More worry 3.0 4.4 3.6 18.7 18.9 18.8 78.3 76.7 77.6
Data entry complex 3.8 5.1 4.4 27.6 23.1 25.6 68.6 71.8 70.0
Reports complex 1.6 2.9 2.2 15.9 10.1 13.3 82.5 87.0 84.5
Corrupted data 4.2 3.1 3.7 21.6 18.7 20.3 74.2 78.2 76.0
Fix upstooslow 5.6 5.1 5.4 16.6 14.5 15.7 77.8 80.4 78.9
Difficult setup/change 11.3 9.5 10.5 39.6 31.1 35.9 49.1 59.4 53.6
Other 2.3 4.2 3.0 0.5 0.9 0.7 97.2 94.9 96.3
No of Respondenls 'Users' 573, 'Non-Users' 454.
There are few problems that are 'very true'. The two that stand out most are the need for constant re-Iearning and the difficulties associated with setting up or changing a system. Most computer users would understand these 'statements', particularly as farmers are not constant and regular users of computer systems. Some of the 'occasionally true' figures are quite high, particularly the 'excessive time' and 'frustrating/wrong' categories. Again, the fact that primary producers are not professional office people would explain these figures. For software development the stress must be on designing self explanatory systems that do not rely on regular experience and manuals.
3.4 1Jrpes of Computer Activities
Table 15
Hours per Month Spent on Business Activities
Activity 'Users' 'Non-users' Combined
Whole fann budgeting 5.56 3.71 4.61
Livestock production recording 2.20 1.65 1.92
Payroll 0.77 0.54 0.65
Enterprise budgeting 0.98 0.79 0.88
Paddock/production recording 0.62 0.36 0.49
Letter and report writing 6.13 6.76 6.45
Financial data* 9.46 5.19 7.28
Spreadsheet use 2.90 3.25 3.08
Feed budgeting 0.49 0.24 0.36
Non-farm 1.27 0.57 0.91
Other 1.05 6.18 3.67
Total
Hours/week
31.43
7.32
29.24
6.60
30.30
6.84
* Financial data - includes recording and analysis
No. of Respondents'Users' 453, 'Non-Users' 473.
Inanother question respondents were asked the total time spent per week on business use of a computer. For 'Users' the response was 7.13, and for 'Non-Users' 6.22 hours per week. These averages are surprisingly similar to the figure calculated from the totals given in Table 15.
For 'Users' by far the most important activities are recording and analysing financial data, letter and report writing, and fann budgeting. For 'Non-Users' the 'other' category is nearly as important as word processing, and the financial and budgeting work is less important.
15
Table 16
Pre-Computer Recording and Analysis
(Percentages Carrying out Various Activities with Varying Frequency Levels)
Frequently Occasionally Virtually Never
'Users' 'Non- Com- 'Users' 'Non- Com- 'Users' 'Non-
Com-users' bined users' bined users' bined
Whole farm budgeting 43.0 50.4 47.5 42.3 37.1 39.1 14.6 12.5 13.3
Livestockdata 24.2 33.8 30.1 25.9 27.3 26.8 50.3 38.9 43.2
Payroll 29.5 32.1 31.0 13.7 19.0 17.0 56.8 48.9 52.0
Enterprisebudgeting 11.6 18.2 15.6 29.8 33.6 32.1 58.9 48.2 52.3
Paddock Production recording 10.8 12.2 11.7 19.0 20.5 19.9 70.2 67.2 68.4
Letter& reportwriting 41.8 45.9 44.3 37.2 35.6 36.3 21.0 18.5 19.4
Financialdata* 56.6 71.0 65.4 23.7 19.8 21.3 19.7 9.1 13.2
Spreadsheet-like calculations 21.3 30.3 26.8 25.5 33.8 30.6 53.2 35.9 42.6
Feed budgeting 6.3 9.5 8.2 15.7 22.5 19.8 77.9 68.0 71.9
Other 1.6 3.3 2.7 0.5 1.0 0.8 97.8 95.6 96.5
Non-farm 0.5 0.5 0.5 0.4 0.1 0.2 99.1 99.4 99.3
* Financialdata -includes recording and analysis No. of Respondents 'Users' 553, 'Non-Users' 867.
The figures in Table 16 suggest the pattern of office work does not change very much with the acquisition of a computer. Budgeting and financial recording were, and are, important 'frequent' activities. It is interesting to note than 'Non-Users' appear to be more active in all areas compared to 'Users'. Whether this is a significant difference is another matter.
In general, it could well be that managers moving into computing are not actually starting up new recording or analysis activities, but rather automating and extending their current practice.
3.5 Computer Use Practices
Table 17
TIme Spent on Computer Operations (Hours per week)
'Non-users' Combined
Business 7.13 6.22 6.67
Entertainment 0.73 1.11 0.92
Community work 0.60 0.50 0.55
Accessing remote data bases 0.10 0.15 0.12
Education 0.47 0.64 0.56
Learning/training 0.31 0.18 0.24
Desktop publishing 0.15 0.15 0.15
Other 0.31 0.30 0.30
Total 9.80 9.25 9.51
No of Respondents 'Users' 595, 'Non-Users' 605.
Business use is clearly the major use, though entertainment is also important, as are community work and education. Given many producers comment that the purchase of a computer is important for their family it is surprising the entertainment and education figures are not higher. However for 'Non-Users', for example, the range of responses for entertainment goes from zero to 20 hours per week, and for education from zero to 25 hours per week.
Table 18
Frequency of Computer Use - Number of TImes Turned on Each Month
'Users' 'Non-users' Combined
Times/month
No of Respondents
12.97
588
15.08
450
13.89
1038
This data would suggest the average time of each session is approximately 2.18 hours. It
17
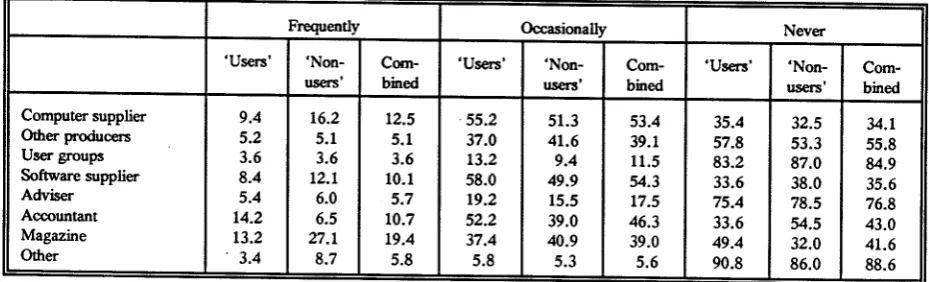
Table 19
Sources of Assistance
(Percentage of Respondents Accessing the Possibilities With the Stated Frequency)
Frequently Occasionally Never
'Users' 'Non- Com- 'Users' 'Non- Com- 'Users' 'Non-
Com-users' bined users' bined users' bined
Computer supplier 9.4 16.2 12.5 ·55.2 51.3 53.4 35.4 32.5 34.1
Other producers 5.2 5.1 5.1 37.0 41.6 39.1 57.8 53.3 55.8
Usergroups 3.6 3.6 3.6 13.2 9.4 11.5 83.2 87.0 84.9
Software supplier 8.4 12.1 10.1 58.0 49.9 54.3 33.6 38.0 35.6
Adviser 5.4 6.0 5.7 19.2 15.5 17.5 75.4 78.5 76.8
Accountant 14.2 6.5 10.7 52.2 39.0 46.3 33.6 54.5 43.0
Magazine 13.2 27.1 19.4 37.4 40.9 39.0 49.4 32.0 41.6
Other . 3.4 8.7 5.8 5.8 5.3 5.6 90.8 86.0 88.6
No. of Respondents 'Users' 500, 'Non-Users' 413.
It is surprising 'user groups' are not used more frequently, though in part the 83.2% (of 'Users') NEVER figure probably reflects the lack of access to such groups. Certainly those who do attend comment on how useful they are. Similarly, the 75.4% (of 'users') NEVER figure for 'advisers' (extension officers and consultants) probably reflects the low number of producers who access private or public advisers.
In contrast, MOST producers have an accountant, and they clearly access them for assistance. Computer suppliers and magazines are the other two sources of note. Only 32% of 'Non-Users' NEVER use magazines as a source of assistance. Overall, however, the figures in the 'frequently' column are surprisingly low.
Table 20 Computer Operator
(Percentage of Respondents Indicating Frequency of Various Operator Types)
Frequently Occasionally Never
'Users' 'Non- Com- 'Users' 'Non- Com- 'Users' 'Non-
Com-users' bined users' bined users' bined
Manager/owner 89.1 88.6 88.9 6.9 8.4 6.6 4.0 3.0 4.5
Manager's spouse 20.3 19.6 20.0 20.3 21.8 21.0 59.4 58.6 59.0
Children 11.4 15.1 13.1 24.0 22.7 23.4 64.6 62.2 63.5
Employee/s 9.2 11.7 10.3 4.8 2.4 3.7 86.0 85.9 86.0
Travelling secretary 2.1 0.6 1.4 0.1 1.1 0.5 97.8 98.3 98.1
Other 2.5 2.4 2.4 1.6 0.9 1.3 95.9 96.7 96.3
The traditional Australasian owner-operator is a 'jack-of-all-trades' (Table 20). It seems the operator figure further supports this concept. 'Spouse' is the next most important operator group. It is suspected the percentage inthis group will increase as more properties have a computer.
Table 21
Problems and Difficulties
(Percentage Believing VariOllS Categories are a Problem)
Major Problem Occasionally a Problem Not Much of a Problem
'Users' 'Non- Com- 'Users' 'Non- Com- 'Users' 'Non-
Com-users' bined users' bined users' bined
Computer breakdowns 3.4 3.3 3.3 21.3 20.4 20.9 75.3 76.3 75.8
madequatehMdwMehe~ 3.4 5.0 4.1 23.5 22.4 23.0 73.1 72.6 72.9
No adequate softwMe 4.8 17.5 10.5 19.5 28.1 23.4 75.7 54.4 66.1
No softwMehe~ 8.8 13.6 11.0 33.1 31.1 32.2 58.1 55.3 56.8
Time involvement excessive 3.6 4.4 4.4 28.8 28.3 28.6 67.6 67.3 67.0
Data entry mistakes 3.2 2.8 3.0 49.1 39.7 44.9 47.7 57.5 52.1
Data required not available 1.8 2.4 2.1 14.7 16.9 15.7 83.5 80.7 82.2
Manuals complex 29.7 24.6 27.4 44.8 45.2 45.0 25.5 30.2 27.6
Software setup difficuh 10.9 5.7 8.6 41.4 33.6 37.7 47.7 60.7 53.7
SoftwMetoodifficuh 2.9 3.7 3.3 26.7 20.8 24.0 70.4 75.5 72.7
Can't remember operating system 13.1 13.4 13.2 38.9 32.7 36.1 48.0 53.9 50.7
Other 2.0 2.6 2.3 0.9 1.1 1.0 97.1 96.3 96.7
No of Respondents 'Users' 558, 'Non-Users' 456.
The major problems are clearly the complexity of manuals, software setup and remembering how to use the operating system. Of these, manual complexity is the major stumbling block. Undoubtedly producers do not like reading manuals, and this is reflected in the figures, but whether these figures would decline significantly, given perfect manuals, is not clear.
Of note is that 'Non-Users' seem to have a greater problem in finding adequate software compared to 'Users', and though not so significant, are unhappier with software help. On the other hand, 'Non-Users' have less difficulty with software setup. Figures to indicate whether these differences are statistically significant were not calculated.
19
Newsletter recipients who had attended a training workshop were asked to respond to the question reported on in Table 22. The numbers who responded are quite small. Recipients who had not attended a workshop were asked to indicate the reasons for non-attendance
(Table 23).
Table 22 Workshop Features
(Percentage Believing the Truth of Various Features/Factors)
Defmitely True Mainly True Really not True
'Users' 'Non- Com- 'Users' 'Non- Com- 'Users' 'Non-
Com-users' bined users' bined users' bined
Lasting benefits 49.5 47.6 48.6 40.4 40.8 40.6 10.1 11.6 10.8
Too advanced 5.0 5.8 5.4 11.8 7.3 9.7 83.2 86.9 84.9
Irrelevant topics 3.2 7.8 5.4 10.4 16.7 13.4 86.4 75.5 81.2
Would like workshop
every six months 6.8 18.8 12.4 5.0 15.2 9.8 88.2 66.0 77.8
Would like workshop
every twelve months 32.7 25.1 29.1 26.4 26.2 26.3 40.9 48.7 44.6
Would like workshop
every two years 23.2 8.9 16.5 15.0 12.0 13.6 61.8 79.1 69.9
Other 1.8 1.6 1.7 0.4 0.0 0.2 97.8 98.4 98.1
No. of Respondents 'Users' 220, 'Non-Users' 191.
Table 23
Reasons for not Attending Workshops (Percentages Believing the Truth of VariOllS Reasons)
Defmitely True Mainly True Really not True
'Users' 'Non- Com- 'Users' 'Non- Com- 'Users' 'Non-
Com-users' bined users' bined users' bined
Didn't know held 13.5 7.9 11.3 10.9 11.9 11.3 75.6 80.2 77.4
Can't afford fee 4.0 4.4 4.2 10.9 11.9 11.3 85.1 83.7 84.5
Can't afford travel 10.2 7.9 9.3 13.9 16.8 15.1 75.9 75.3 75.6
No time 23.4 30.7 26.3 41.9 38.6 40.6 34.7 30.7 33.1
No benefits 3.3 8.9 5.5 16.5 20.3 18.0 80.2 70.8 76.5
Other 0.0 22.8 9.1 0.0 9.4 3.8 100.0 67.8 87.1
All in all, the workshop attendees seem to regard the workshops as reasonably beneficial and would like to attend one every one or two years. The really notable feature of the workshop data is the small number attending. Some 410 respondents have been to a workshop but 505 have not. The major reason for non-attendance is given as 'no time' , rather than factors such as 'no benefit' and 'can't afford the fee'. It might be suspected better time management and a stronger commitment to efficient computing would provide non-attendees with financial benefits.
When asked to comment on how 'help systems' might be improved, very few suggestions were provided. Those worth noting are more users groups, courses held locally and software tutorial systems.
Of the respondents, 124 said they were an accountant, consultant or bureau operator. Table 24 gives the number of clients they service.
Table 24
Number of Clients Serviced by Accountants. Consultants and Bureau Computers (Percentages in Each Range)
No. of Producers 'Users' 'Non-users' Combined
0- 5 26.9 30.6 29.0
6-10 25.0 15.3 19.4
11-20 13.4 9.7 11.2
21-30 13.4 4.2 8.1
31-40 7.7 8.4 8.1
> 40 13.6 31.8 24.2
Two observations were removed from these figures. One respondent, (a 'User'), said 600 properties were serviced and another (a 'Non-User'), gave a figure of 12,000 properties. If
21
3.6 Financial Recording and Analysis Practices
Recipients were asked to provide answers to a wide range of questions exploring their use of financial, specialist budgeting and physical recording systems (paddock, production, plot, livestock production). In the financial area large numbers of responses were obtained, whereas in the others the number of replies, particularly for 'Non-Users', meant it was not worth reporting the results.
The following tables summarise respondents' practices and views. Of the 'Users', 513 said they used a fmancial package, 96 didn't (there were 30 missing), whereas for the 'Non-Users' , 285 useda financial system, 179 didn't, leaving some 135 who didn't respond. The average number of years 'Users' had been using the financial package was 2.45.
Table 25 gives the packages used by 'Non-Users'.
Table 25
Financial Systems Used by Non K.F.M.U. Clients
Package Types
General ledger
Spreadsheet/data base Commercial package Own system
Other Missing
Percentage
5.3
11.9
26.9 2.8 34.0 19.1
It is suspected the 'other' involves spreadsheet and general data base systems.
Table 26
Options Used Frequently in Financial Packages (Percentages of Respondents +)
Option
Data entry
Good and Services Tax.
*
Cash flow - actualCash flow - budgeted Actual/budget comparison Account balances
Ledger accounts Enterprise reports Taxable profit forecast Transition lists
Change transactions Stock reports
Debtor options
Account list maintenance File backups
Bank reconciliation
Physical production reports Invoicing Depreciation reports Other 'Users' 35.5 61.1 20.1 39.1 19.7 20.5 32.7 11.3 13.1 17.9 2.1 18.3 3.9 3.3 5.5 0.4 0.7 0.5 0.0 13.4 'Non-users' 16.5 35.4 15.4 20.3 9.5 2.5 4.9 1.1 0.7 10.9 0.3 4.2 3.9 1.7 0.7 3.5 0.0 1.4 1.4 6.6 Combined 28.5 51.8 18.4 32.3 16.0 14.0 22.7 7.6 8.6 15.4 1.4 13.2 3.9 2.7 3.8 1.5 0.4 0.8 0.5 10.9
*
Adjusted to exclude Australian 'User' replies (no G.S.T.)+ Based on 513 'Users' and 285 'Non-Users'
For New Zealand producers, G.S.T. recording and reporting is clearly an important activity. For 'Users' the main functions are data entry, cash flow work (both actual and budget), account details (ledgers) and balances, actual/budget comparisons, and transaction lists (probably checking). The 'Non-User' percentages are surprisingly low, but this may in part
23
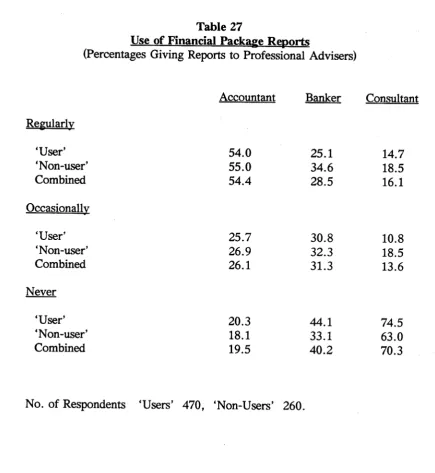
Table 27
Use of Financial Package Reports
(Percentages Giving Reports to Professional Advisers)
Accountant Banker Consultant
Regularly
'User' 54.0 25.1 14.7
'Non-user' 55.0 34.6 18.5
Combined 54.4 28.5 16.1
Occasionally
'User' 25.7 30.8 10.8
'Non-user' 26.9 32.3 18.5
Combined 26.1 31.3 13.6
Never
'User' 20.3 44.1 74.5
'Non-user' 18.1 33.1 63.0
Combined 19.5 40.2 70.3
No. of Respondents 'Users' 470, 'Non-Users' 260.
Surprisingly, there is still a fifth of all producers who do not share the output with their accountant. This would seem to be a shortsighted approach, though it is known some accountants will not accept farmers' computer output. For this reason, some farmers have changed their accountant.
Table 28
Accounting Practice - Single or Double Entry System (Percentage of Respondents Using Each System)
Practice Double entry Single entry 92.4 7.6 'Non-users' 48.2 51.8 Combined 77.2 22.8
No. of Respondents 'Users' 488, 'Non-Users' 257.
The big difference between 'User' and 'Non-User' recording practices is unlikely to be a major difference in their approach, but rather a reflection on the fact that many packages do not offer a choice.
Table 29
Goods and Services Tax Return Period (Percentages Using the Alternative Periods)
Period One month Two months Six months 'Users' 9.4 66.8 23.8 'Non-uSers' 17.5 54.6 27.9 Combined 12.6 62.0 25.4
No. of Respondents 'Users' 371, 'Non-Users' 240.
The majority of producers are on a two month period, but the other two options also have significant numbers.
Table 30
Inclusion of G.S.T. in Transaction Records (Percentages Using the Alternatives)
G.S.T. excluded (net) G.S.T. included (gross)
'Users' 58.1 41.9 'Non-users' 66.5 33.5 Combined 61.6 38.4
25
It is surprising that more producers do not exclude G.S.T. from reports as clearly the government's tax money is not part of the real costs and returns. It does, however, effect cash flows.
Table 31
Source of financial Data
(Percentage Using the Alternative Source)
Bank statements Cheque butts
Invoices/credit notes
'Users'
67.5 26.9 5.6
'Non-users'
56.1 33.1 10.8
Combined
63.5 29.1 7.4
No. of Respondents 'Users 490', 'Non-users' 269.
The low figure for 'Invoices/Credit notes' reflects the low number of people using a monthly G.S.T. return and consequently those who are probably required to operate on an invoice basis for G.S.T.. While most producers work from bank statements there is still a significant number entering data when the cheques are written.
Table 32
Frequency of Using a Financial Package
(Percentage of Respondents in Each Frequency Category)
'Users' 'Non-users' Combined
Frequent and heavy 33.9 38.9 35.6
Occasional but regular 59.7 56.6 58.6
Infrequent use 4.6 3.4 4.2
Really can't use at all 0.6 1.1 0.8
Other 1.2 0.0 0.8
No. of Respondents 'Users' 499, 'Non-User' 265.
Table 33
Adequacy of Financial Packages
(Percentage· Ranking Their Package on a Scale of 1 = Inadequate to 10 = Totally Adequate)
Scale Value 'Users' 'Non-users' Combined
1 0.6 1.1 0.8
2 0.6 0.0 0.4
3 0.6 2.6 1.4
4 0.6 0.7 0.7
5 5.7 10.5 7.5
6 5.5 4.1 5.0
7 14.0 13.5 13.9
8 34.5 35.7 34.9
9 22.3 15.0 19.7
10 15.6 16.8 15.7
No. of Respondents'Users' 470, 'Non-Users' 266.
The figures in Table 33 indicate 86.4% of 'Users' rank the package as 70% or better, and 81 % of 'Non-Users' rank theirs this level or better. These figures are remarkably high, indicating most are satisfied with their system. Whether they would find other systems an improvement on their current package is another matter as most have little opportunity to make comparisons.
CHAPTER FOUR
CONCLUSION
Increasing numbers of producers are using computer systems to assist their management. While not statistically proven, the figures presented strongly suggest most computer users gain considerable benefit from their systems, do not have major problems, and find the systems relatively easy to use following the initial learning and setting up phases.
Currently still only a minority use computers. There is a major training task ahead. When 'Non-Users' were asked whether they had attended a demonstration workshop or course of at least two hours duration, 602 said 'Yes' but 450 said 'No'. When asked whether they had read a book or booklet on computers 266 said 'No'. In that the newsletter recipients clearly have a real interest in computers, these 'No' figures are quite high. For the general producer community there must still be thousands who have little knowledge of computer systems and their operation. Novak and Stegelin (1988) came to a similar conclusion.
While the majority of computer owners believe their investment has been profitable, there is still no direct evidence through comparing before and after effects, or from cross sectional with-without studies.
Tables 34 and 35 give producers' views of the future use of computers. The message from these tables is clear. Financial management and budgeting will continue to be major uses, and increasing numbers of farmers/managers will use computers. Ifanything, their estimate of the numbers eventually using a computer must be considered low. In the long run, it is doubtful whether business will be possible without a computer.
Table 34
Longer Run Use of Computers
(Percentage of Respondents who Believe in the Following Categories)
Only a minority will use
A significant proportion will use All will eventually use
'Users'
24.4 71.4 4.2
'Non-users'
20.7 70.5 8.8
Combined
22.0 70.8 7.2
No. of Respondents 'Users' 570, 'Non-Users' 1051.
Table 35
'[ype of Computer Use in the Longer Run
(Percentage of Respondents who Believe the Following Use Types Will be Important)
verrhnportant Important Littlehnportance
'Users' 'Non- Com- 'Users' 'Non- Com- 'Users' 'Non-
Com-users' bined users' bined users' bined
Feed management 11.9 12.8 12.5 37.7 49.7 45.5 50.4 37.5 42.0
Financial management 93.0 89.9 91.0 6.5 9.5 8.4 0.5 0.6 0.6
Production recording 49.8 52.4 51.5 41.7 41.4 41.5 8.5 6.2 7.0
Infonnation from central
database 15.3 14.8 15.0 45.3 48.2 47.2 39.4 37.0 37.8
Budgeting/planning 79.1 78.7 78.8 18.2 19.4 19.0 2.7 1.9 2.2
Buying/selling 11.4 11.9 11.7 44.2 43.2 43.5 44.4 44.9 44.8
Other 4.4 5.8 5.3 1.6 5.1 3.9 94.0 89.1 90.8
No. of Respondents 'Users' 570, 'Non-Users' 1036.
Currently financial management and budgeting are the major function carried out on producers' computers. They find the specialist software available totally acceptable and spend an appreciable amount of time (approximately one day/week) using their systems. Surprisingly, very few major problems are experienced though it is clear, despite the average time spent per week, producers do not in general find computing simple. They comment that manuals are not easy to use and remembering the details of the procedures involved is difficult. These conclusions provide a clear message to developers that special efforts must be made to further develop systems that are self-explanatory without the need to get up from the computer and its screen.
While the sample used was not randomly selected, it does appear that a significant number of producers are not using specialist software. As it is doubtful this situation arises from everyone carefully assessing the alternatives, there is a need to provide more information and demonstration systems.
This gets back to the need for increased training and education to be made available for both computer users and those yet to move into the new technology. An important opportunity here is the development of user groups. Very few exist and yet the advantages are considerable, and the cost relatively minor. User groups need to be encouraged by all sectors of the industry.
REFERENCES
AGRICULTURE AND RESOURCES QUARTERLY (1990), "Commodity Overview", 2 (3); 237-242, Australian Bureau of Agricultural and Resource Economics, Canberra.
BATTE, M.T., E JONES and G.D. SCHNITKEY (1990) "Computer Use by Ohio Commercial Farmers". Am.J. Agricultural Economics, 72; 935-945.
JARVIS, A.M. (1990) "Computer Adoption Decisions - Implications for Research and Extensions: The Case of Texas Rice Producers" Am.J. Agricultural Economics, 72; 1388-1394.
NOVAK, J.L. and F.E. STEGELIN (1988), "U.S. Farmer's Attitudes Towards
Microcomputer Uses", Computers and Electronics in Agriculture, 3: 81-89.
NZ MEAT AND WOOL BOARDS' ECONOMIC SERVICE (1990) "The New Zealand Sheep and Beef Farm Survey 1988-89", Publication No 2020, Wellington.
NZ MEAT AND WOOL BOARDS' ECONOMIC SERVICE (1991), "Compendium of New Zealand Farm Production Statistics", Publication No 2030, Wellington.
NZ MEAT AND WOOL BOARDS' ECONOMIC SERVICE (1991a), "Annual Review of the N.Z. Sheep and Beef Industry 1990-91", Publication No 2036, August 1991, Wellington.
PRYDE, J.G. and P.J. McCARTIN (1987), "Survey of New Zealand Farmer Intentions and Opinions, October - December 1986", Agribusiness and Economics Research Unit, Research Report No 188, Lincoln College, Lincoln.
PULTER, D.S. and D. ZILBERMAN (1988), "Computer Use in Agriculture: Evidence from Tulare County, California", Am J. Agricultural Economics, 70: 790-802.
APPENDIX
LIST OF QUESTIONS IN THE SURVEY
IDENTIFICATION
1. User's name and address
2. Type of micro-computer?
3. Do you wish to continue receiving the KFMU newsletter? If you have ideas on how it might be improved please list them.
INTRODUCTORY
If you feel any of the questions are not relevant to your situation, please enter N/A (not applicable), (e.g. a computer agent will find the questions on co-operative assistance N/A).
4. If you are no longer using your computer for business purposes please describe the reasons and return the survey without answering further questions (unless you feel some are relevant to your circumstances).
5. Ifyou use your computer for business, but DO NOT use any of the Kellogg Farm Management Unit programs, please describe the reasons (also bypass the questions on the KFMU Software).
ECONOMICS
6. Has your investment in a computer and software been economically worthwhile?
A profitable investment? Just breaks even?
Does not cover costs? Don't know?
7. Ifyou feel able to, give an estimate of the annual average profit increase/decrease ($)
you believe has resulted from using a computer?
8. If you have a reasonable idea of the cost of running your computer (disks, paper, ribbons, repairs, software updates, insurance, electricity etc) please indicate the average annual cost. (Note - exclude any capital costs or payments e.g. loan repayments) .
COMPUTER USE OVERALL
9. On average, how many hours per week do you use your computer on
-Business?
Entertainment (games)? Community work?
COMPUTER OPERATION
Accessing central data bases? Education?
Other?
10. On average, how many times each month do youtumon your computer for business purposes (if less than once, give a fraction)?
BUSINESS USE OF YOUR COMPUTER
11. On average, how many hours per month, if any, do you use the computer
for-(a) Whole farm forecast budgeting - annual and cash flow? (b) Livestock data recording and analysis?
(c) Payroll work?
(d) Enterprise (gross margin) budgeting?
(e) Paddock/production recording and analysis?
(f) Letter and report writing?
(g) Recording and analysing fmancial data (and GST) (h) Sundry calculations using spreadsheets?
(i) Feed budgeting?
G)
Other (please specify)?RECORDING AND ANALYSIS IN PRE-COMPUTER DAYS
12. Did you carry out the functions listed below by hand and possibly a calculator, before you had a computer? (Frequently, Occasionally, Virtually Never)
(a) Whole farm forecast budgeting - annual and cash flow (b) Livestock data recording and analysis
(c) Payroll work
(d) Enterprise (gross margin) budgeting
(e) Paddock/production recording and analysis
(f) Letter and report writing
(g) Recording and analysing fmancial data (and GST) (h) Sundry calculations like spreadsheets sums
(i) Feed budgeting
33
HELP
13. What sources of assistance do you access? (Frequently, Occasionally, Virtually Never)
(a) Computer supplier
(b) Other producers on a casual basis (c) Other producers through a user group (d) Software producer/supplier
(e) Extension officer and/or consultant
(f) Accountant
(g) Computer magazines
(h) Other (specify)
TYPES OF SOFTWARE USED
14. Indicate the frequency with which you use the following classes of software (Frequently, Occasionally, Virtually Never)
-(a) Spreadsheets (e.g. Lotus, VP Planner)
(b) Programmes written by you/neighbourlfriend
(c) Wordprocessor (e.g. Wordperfect, Wordstar, Word ....) (d) General Data base package (e.g. Dbase, Reflex)
(e) Specialist agricultural software (e.g. KFMU packages)
(f) Utility packages (e.g. Menu overlay, notepad tree... )
(g) Other (specify)
COMPUTER OPERATION
15. For BUSINESS purposes, who operates your computer? (Frequently, Occasionally, Virtually Never)
-(a) Manager (probably yourself or owner)
(b) Manager's spouse
(c) Children
(d) Employee/s
(e) Travelling secretary (f) Other (specify)
ADVANTAGES AND DISADVANTAGES
16. Indicate the importance of your computer system in the following categories (Very Important, Important, Not a Factor)
-(a) Saving time
(b) Selecting the best products to produce (c) Controlling expenditure
(e) Managing cash and financial resources
(f) Easier record keeping
(g) Office management
(h) Improving your 'peace of mind'
(i) Keeping and analysing production records (pasture, crop, animal ... )
G)
Other (specify)17. Indicate the importance of the following DISADVANTAGES in using a computer system (Very True, Occasionally True, Seldom or Never True)
-(a) The time involved is excessive
(b) A frustrating experience - often goes wrong (c) Constant re-Ieaming required
(d) Increased worry (e.g. of losing data) (e) Data entry too complicated
(f) Printouts too complicated
(g) Getting corrupted data (e.g. power failure) (h) Can't get breakdowns fixed fast enough
(i) Setting up/changing structure of records too difficult
G)
Other (please specify)PROBLEMS AND DIFFICULTIES
18. Indicate the extent and nature of any problems you have experienced (Major Problem, Occasionally a Problem, Not Much of a Problem)
-(a) Computer break-downs
(b) Inadequate help with hardware (c) Can't find adequate software (d) Lack of help with software (e) Takes too much time for benefits (f) Making data entry mistakes
(g) Do not have the data required
(h) Complexity of manuals
(i) Software too difficult to set-up
G)
Software too difficult to run(k) Can't remember MSDOS (CP/M) commands
(1) Other (specify)
COMPUTER REPLACEMENT
19. Please complete the following details
-(a) How long have you had a computer?
35
WORKSHOPS/COURSFS
Answer EITHER question 20 or 21.
20. If you HAVE attended an 'advanced' workshop for one or more of the KFMU
packages indicate your feelings about these workshops (Definitely True, Mainly True, Really Not True)
(a) The workshop gave lasting benefit
(b) The workshop was too advanced
(c) Many of the topics were not relevant (d) I would like to attend one every 6 months (e) I would like to attend one every 12 months (f) I would like to attend one every 24 months
(g) Other (specify)
21. Ifyou have NEVER attended an advanced workshop, indicate the reason/s for non attendance (Definitely True, Mainly True, Really Not True).
(a) Didn't know they were held
(b) Can't afford the fee
(c) Can't afford the travelling costs
(d) Can't spare the time
(e) Wouldn't obtain any benefits
(f) Other (specify)
SOFrWARE UPDATES
Answer EITHER question 22 or 23.
22. Ifyou HAVE regularly received software updates have these
-(a) Been worth the investment?
(b) Easy to install?
(c) Had adequate documentation?
(d) Provided what you expected?
23. If you have NOT obtained updates is this due to
-(a) Didn't know an update was available
(b) Cost too great
(c) Benefits of obtaining an update not made clear (d) Current system does all I need
(e) Don't know how to obtain an update
(f) Forgot to get around to ordering
THE KELLOGG FINANCIAL RECORDING SYSTEM
24. Ifyou do NOT use the FRS, indicate here and move to the next section, (Question 46).
25. For how many years and months have youusedthe FRS?
26. Have you thoroughly explored all the FRS options available?
27. List the FRS options you use FREQUENTLY
-28. List the FRS options you use OCCASIONALLY
-29. List the FRS options you find most difficult to use (if any) and why
-30. Does your accountant use FRS output? (Regularly, Occasionally, Virtually Never).
31. Does your banker/s use FRS output? (Regularly, Occasionally, Virtually Never).
32. Does your advisor/consultant, if any, use the FRS output? (N/A, Regularly,
Occasionally, Never).
33. Do you use a double or single entry system?
34. Ifapplicable, indicate the length of your GST return period (N/A, 1, 2or6months).
35. Do you enter your transactions mainly from
-(a) Bank statements?
(b) Cheque butts?
(c) Invoices/credit notes?
36. Ifapplicable, in which mode do you use the FRS GST module
-(a) GST net?
(b) GST gross?
(c) N/A
FRS ADEOUACY
37. Rate on a scale of 1 (totally inadequate) to 10 (completely adequate) whether FRS provides the answers you require.
38. Give any comments on how the package might be improved.
FRS ERRORS
39. List out any errors or problems that have occurred
-FRS EASE OF USE
37
41. Give any comments on how the package might be made easier to use.
FRS FREOUENCY OF USE
42. Which statement best describes your use of this package? -(a) Frequent and heavy use
(b) Occasional but regular use (c) Infrequent use
(d) Really can't use it at all (e) Other (specify)
FRS USER GUIDE
43. Rate on a scale of 1 (very difficult) to 10 (very easy) whether the User Guide is easy to follow.
44. Rate on a scale of 1 (totally inadequate) to 10 (totally complete) whether the User Guide contains all you need.
45. Give any comments on how the Guide might be improved.
THE KELLOGG LIVESTOCK RECORDING SYSTEM
46. Ifyou do NOT use the LRS indicate here and move to the next section, (Question 63).
47. For how many years and months have you used the LRS?
48. Do you regularly use the LRS electronic scales interface (EDI)? If not, please indicate reason
-(a) Do not have electronic scales (b) Have scales but do not have EDI (c) Have scales and EDI but don't use EDI (d) use EDI regularly
49. Do you use formulae fields?
50. Have you thoroughly explored all the LRS options?
51. List the LRS options that you use frequently.
52. List the LRS options that you use occasionally.
53. List the LRS options that you find most difficult to use, (ifany), and why.
54. Rate on a scale of 1 (totally inadequate) to 10 (completely adequate) whether LRS contains the answers you require.
LRS ERRORS
56. List out any errors or problems that have occurred
-LRS EASE OF USE
57. Rate on a scale of 1 (very difficult) to 10 (very easy) how easy the package is to use.
58. Give any comments on how the package might be made easier to use.
LRS FREOUENCY OF USE
59. Which statement best describes your use of this package?
-(a) Frequent and heavy use
(b) Occasional but regular use
(c) Infrequent use
(d) Really can't use it at all
(e) Other (specify)
LRS USER GUIDE
60. Rate on a scale of 1 (very difficult) to 10 (very easy) whether the User Guide is easy to follow.
61. Rate on a scale of 1 (totally inadequate) to 10 (totally complete) whether the User Guide contains all you need.
62. Give any comments on how the Guide might be improved.
THE KELLOGG FINANCIAL BUDGETING SYSTEM (BGT package)
63. If you do NOT use the BGT indicate here and move to the next section, (Question 81).
64. For how many years and months have you used the BGT?
65. List the BGT options you use most frequently.
66. List the BGT options you use occasionally.
67. List the BGT options you find most difficult to use, (if any), and why.
68. Do you use the cashflow as a basis for discussions with your financiers? (Regularly, Occasionally, Virtually Never)
69. Do you use the annual budget as a basis for discussions with your
advisors/consultants? (N/A, Regularly, Occasionally, Virtually Never)
39
71. If your answer was 'No', please indicate the reason.
72. Rate on a scale of 1 (totally inadequate) to 10 (completely adequate) how well BGT provides the answers you require.
73. Give any comments on how the package might be improved.
BGT ERRORS
74. List out any errors or problems that have occurred.
BGT EASE OF USE
75. Rate on a scale of 1 (very difficult) to 10 (very easy) how easy the package is to use.
76. Give any comments on how the package might be made easier to use.
BGT FREOUENCY OF USE
77. Which statement best describes your use of this package? (a) Frequent and heavy use
(b) Occasional but regular use
(c) Infrequent use
(d) Really can't use it at all (e) Other (specify)
BGT USER GUIDE
78. Rate on a scale of 1 (very difficult) to 10 (very easy) whether the User Guide is easy to follow.
79. Rate on a scale of 1 (totally inadequate) to 10 (totally complete) whether the User Guide contains all you need.
80. Give any comments on how the Guide might be improved.
THE KELLOGG PRODUCTION RECORDING SYSTEM
81. Ifyou do NOT use the PRS indicate here and move to the next section, (Question 95).
82. For how many years and months have you used PRS?
83. List the PRS options you use most frequently.
84. List the PRS options you use occasionally.
86. Rate on a scale of 1 (totally inadequate) to 10 (completely adequate) whether PRS provides the answers you require.
87. Give any comments on how the package might be improved.
PRS ERRORS
88. List out any errors or problems that have occurred.
PRS EASE OF USE
89. Rate on a scale of 1 (very difficult) to 10 (very easy) how easy the package is to use.
90. Give any comments on how the package might be made easier to use.
PRS FREOUENCY OF USE
91. Which statement best describes your use of this package? (a) Frequent and heavy use
(b) Occasionally but regular use (c) Only use when forced to (d) Really can't use at all (e) Other (specify)
PRS USER GUIDE
92. Rate on a scale of 1 (very difficult) to 10 (very easy) whether the User Guide is easy to follow.
93. Rate on a scale of 1 (totally inadequate) to 10 (totally complete) whether the User Guide contains all you need.
94. Give any comments on how the Guide might be improved.
OTHER (besides FRS. LRS. BGT. PRS) KELLOGG PACKAGES
95. If you use other Kellogg packages (e.g. IRR, MORT, BE, GROSS MARGINS,
DAMS, DISK REPORT, AMALGAMATION ...) please describe what you use it/them for and the frequency of use.
USE OF COMPUTERS IN YOUR AREA
96. How many producers in your area do you know, or have heard about, who use a computer?
41
98. Indicate which of the following statements best describes what you think producers in general believe.
(a) Only a minority will ever use a computer.
(b) A significant proportion will eventually have a computer. (c) All producers will eventually have a computer.
99. In the longer run, which of the following do you believe will be the most important uses of computers? (Very Important, Important, Little Importance)
(a) Feed management
(b) Financial management
(c) Production recording and analysis (d) Accessing central data bases
(e) Budgeting and planning
(f) Buying and selling products
(g) Other (specify)
100. Of the other producers using a computer you know or have heard about, give the percentage in the following categories
-(a) Use mainly specialist agricultural/horticultural software from Kellogg Unit (b) Use mainly specialist agricultural/horticultural software from other sources (c) Use mainly general purpose packages (e.g. spreadsheet, data base package)
adapted for agriculture/horticulture
(d) Don't use their computer for agricultural/horticultural purposes (e) Don't know what they use/do with their computers
CO-OPERATIVE ASSISTANCE
When asked to be a 'Helper' most users responded YES. We would now like to ask
whether you wish to change your original answer and to ask if you have been called on by new users.
Ifyou respond 'YES' your name is forwarded to new users, and occasionally to prospective users, in your area with the comment that you have offered to help on a casual basis. The letter says "It should be appreciated that these people are volunteers, and in many cases still learners themselves, and consequently may feel that they are unable to help in some circumstances. Naturally, the privacy of the helpers should be respected!"
101. Do you wish to continue as a helper, or now become a helper?
102. Ifyou have been a helper, please indicate the number of requests for help you have received per annum.
GENERAL
104. Which of the following fanning, grazing, horticultural or 'other' occupation BEST describes your situation? (Give one category only)
(a) Sheep (b) Cattle
(c) Dairy (d) Mixed crop/stock
(e) Other animal (f) Orchard/fruit
(g) Vegetables (h) Ornamental/flowers
(0
AccountantG)
Agric/hort consultant(k) Computer distributor (I) Software consultant
(m) Teacherllecturer (n) Other (specify)
105. If you are a fanner/horticulturist please indicate
-(a) the number of fanns serviced by your computer
and (b)
and (c)
(to the nearest $25,000) the approximate total gross income (before any expenses are deducted) of all your fanning enterprises.
(Ignore this question if you do not want to answer for any reason. It is designed to see whether computer users tend to have larger enterprises than the average.)
how many equivalent full-time labour units are employed (exclude the manager).
106. Ifyou are an accountant/consultant or bureau operator. please indicate the number of producers for whom you keep records, (otherwise enter N/A).