University of Pennsylvania
ScholarlyCommons
Publicly Accessible Penn Dissertations
1-1-2014
Social Determinants and International
Comparisons of Health and Mortality
Andrew Currier Stokes
University of Pennsylvania, astokes@sas.upenn.edu
Follow this and additional works at:http://repository.upenn.edu/edissertations
Part of theDemography, Population, and Ecology Commons, and theEpidemiology Commons
This paper is posted at ScholarlyCommons.http://repository.upenn.edu/edissertations/1458 For more information, please contactlibraryrepository@pobox.upenn.edu.
Recommended Citation
Stokes, Andrew Currier, "Social Determinants and International Comparisons of Health and Mortality" (2014).Publicly Accessible Penn Dissertations. 1458.
Social Determinants and International Comparisons of Health and
Mortality
Abstract
Despite substantial gains in population health over recent decades, the US faces a growing epidemic of obesity that threatens continued progress. This dissertation seeks a better understanding of this dire challenge through three chapters that explore obesity from distinct vantage points. The first chapter quantifies the extent to which greater obesity in the US contributes to its low life expectancy ranking with respect to 15 other developed countries. The principal finding is that the higher prevalence of overweight and obesity in the US may contribute between a fifth and a third of the longevity gap above age 50. The second chapter is an investigation of the mortality risks and population impact of obesity in the older adult population of the US. I propose an innovative measurement strategy using weight histories. My findings indicate that the prior literature may substantially underestimate the mortality risks of obesity by failing to fully account for confounding by illness. The third and final chapter investigates the social context of obesity through an examination of eating behaviors of adults in the US. I find that participation in the family dinner is associated with a significantly lower probability of being obese and that the association is robust to adjustment for multiple dimensions of socioeconomic status.
Degree Type
Dissertation
Degree Name
Doctor of Philosophy (PhD)
Graduate Group
Demography
First Advisor
Samuel H. Preston
Second Advisor
Irma T. Elo
Keywords
body mass index, family dinner, life expectancy, mortality, obesity, population attributable fraction
Subject Categories
SOCIAL DETERMINANTS AND INTERNATIONAL COMPARISONS
OF HEALTH AND MORTALITY
Andrew Currier Stokes
A DISSERTATION
in
Demography and Sociology
Presented to the Faculties of the University of Pennsylvania
in
Partial Fulfillment of the Requirements for the
Degree of Doctor of Philosophy
2014
Supervisor of Dissertation Co-Supervisor of Dissertation
__________________________________ ______________________________
Irma T. Elo Samuel H. Preston
Professor of Sociology Professor of Sociology
Graduate Group Chairperson, Demography
__________________________________
Michel Guillot
Associate Professor of Sociology
Graduate Group Chairperson, Sociology
_________________________________ Emily Hannum
Associate Professor of Sociology and Education
Dissertation Committee:
SOCIAL DETERMINANTS AND INTERNATIONAL COMPARISONS OF HEALTH AND MORTALITY
COPYRIGHT
2014
Andrew Currier Stokes
This work is licensed under the Creative Commons Attribution- NonCommercial-ShareAlike 3.0 License
To view a copy of this license, visit
In memory of my grandparents, Dr. Charles A. Stokes, Constance C. Stokes
ACKNOWLEDGEMENTS
I owe deep gratitude to my PhD supervisor, Samuel H. Preston, for extraordinary
mentorship for five-years and counting. Sam dedicated immense time and energy to
advising me and never hesitated to roll up his sleeves and get involved in the details of
my research. He inspired me to work hard and challenged me to pursue difficult and
innovative ideas. During difficult and frustrating times, he was there to help me
overcome the obstacles and finish what I had started. Above all Sam made research
stimulating and fun, which drove me to achieve more than I ever imagined I could. I am
also deeply grateful to Irma T. Elo for giving me insightful feedback on numerous of my
projects. I appreciate her critical lens and for often helping me to distill complex ideas
into simple and concise information that can be effectively conveyed to others. Moreover,
she contributed significantly to helping me define the overall direction and priorities of
my research. Michel Guillot was another constant source of support through the years. I
would like to thank him for detailed feedback on numerous papers and for giving me
several key insights on Chapter 2 of my dissertation. The Population Studies Center at the
University of Pennsylvania has been a truly incredible environment for carrying out
research. Reflecting this fact, I have many of its members to thank for their generous
input over the years: Jere Behrman, Doug Ewbank, Emily Hannum, Kristen Harknett,
Hans-Peter Kohler, John MacDonald, Emilio Parrado, Jason Schnittker and Herb Smith. I
also learned a lot from my peers in the PhD program, particularly during the second-year
of the program when we were asked to provide regular and detailed feedback on one
another’s work. These individuals include Ameed Saabneh, Emily Vala-Haynes, Theresa
thanks to my friends and family for looking after my health and wellness during graduate
school as well as helping me to keep my head up high and maintain perspective. I would
never have made it this far without the love, companionship and counsel of my partner
and best friend Lucia Tiererova. She has been with me every step of the way, keeping my
spirits high with her energy and enthusiasm for life as well as her wit and intellect. She
also recognized that life can and never should be put on hold. Thus, she insisted on
regularly carving out time for fun and many of my fondest memories from this period—
the hikes, bike rides, camping trips and skiing would never have happened without her. I
would also like to thank my family, including my mother (Lisa), father (Harry), sister
(Corinne), brother (Colin) and uncle (Christopher). I have been so fortunate for their
support over the years and for encouraging me in each and every pursuit I ever decided to
take on. Finally, I would like to thank members of Gregory College House for providing
such a wonderful community for me to come home to at the end of the day. It was truly a
ABSTRACT
SOCIAL DETERMINANTS AND INTERNATIONAL COMPARISONS OF HEALTH
AND MORTALITY
Andrew Stokes
Samuel H. Preston
Irma T. Elo
Despite substantial gains in population health over recent decades, the US faces a
growing epidemic of obesity that threatens continued progress. This dissertation seeks a
better understanding of this dire challenge through three chapters that explore obesity
from distinct vantage points. The first chapter quantifies the extent to which greater
obesity in the US contributes to its low life expectancy ranking with respect to 15 other
developed countries. The principal finding is that the higher prevalence of overweight
and obesity in the US may contribute between a fifth and a third of the longevity gap
above age 50. The second chapter is an investigation of the mortality risks and population
impact of obesity in the older adult population of the US. I propose an innovative
measurement strategy using weight histories. My findings indicate that the prior literature
may substantially underestimate the mortality risks of obesity by failing to fully account
for confounding by illness. The third and final chapter investigates the social context of
obesity through an examination of eating behaviors of adults in the US. I find that
participation in the family dinner is associated with a significantly lower probability of
being obese and that the association is robust to adjustment for multiple dimensions of
TABLE OF CONTENTS
Dedication...iii
Acknowledgements...iv
Abstract...vi
List of Tables...ix
List of Figures...x
List of Appendices...x
Introduction...xi
Chapter 1: Contribution of Obesity to International Differences in Life Expectancy...1
1.1 Introduction...1
1.2 Methods...3
1.2.1 Data...3
1.2.2 Analytic Approach...4
1.3 Results...8
1.3.1 Cross-National Comparison of Obesity Rates...8
1.3.2 Effects of Obesity on Longevity...8
1.3.3 Sensitivity of Results to Alternative Risks...10
1.3.4 Effects of Misreporting of Height and Weight...11
1.4 Discussion...12
1.5 Conclusion...15
Chapter 2: Using Maximum Weight to Redefine Body Mass Index Categories in Studies of the Mortality Risks of Obesity...23
2.1 Introduction...23
2.2 Methods...24
2.2.1 Data...24
2.2.2 Measures...25
2.2.3 Analytic Approach...26
2.3 Results...27
2.3.1 Descriptive Statistics...27
2.3.2 Analysis...28
2.4 Discussion...31
Chapter 3: The Family Dinner and Obesity among US Adults: A Time-Use Study...43
3.1 Introduction...43
3.2 Background...46
3.2.1 Informalization...46
3.2.2 Eating Patterns and Health...48
3.2.3 Mechanisms...51
3.2.4 Potential Effect Modifiers...56
3.3.1 Data...57
3.3.2 Measures...59
3.3.3 Analytic Approach...62
3.4 Results...63
3.4.1 Descriptive Statistics...63
3.4.2 Analysis...65
3.4.3 Sensitivity Analysis…...67
3.4 Discussion...68
LIST OF TABLES
Table 1.1: Cumulative prevalence of overweight and obesity by country, adults
50-89 based on self-report [95% Confidence Intervals]……….18 Table 1.2: Estimated proportion of all-cause mortality attributable to obesity by
country, age and sex [95% Confidence Intervals]………...…...……….19 Table 1.3: Life expectancy at age 50 (e50) in 2006 in the presence and absence
of all-cause mortality attributable to obesity by country and sex
(in years) [95% Confidence Intervals] ……..……..……..……..……..…….20 Table 1.4: US shortfall in life expectancy at age 50 relative to higher life
expectancy countries, and change in that shortfall produced by
eliminating obesity (in years) [95% Confidence Intervals] ..……..……..…..21 Table 1.5: Estimated gain in life expectancy at age 50 in 2006 from
hypothetically redistributing obese to optimal BMI categories, using
two sets of risk factors (in years) [95% Confidence Intervals]..…...………...22
Table 2.1: Characteristics of US never-smoking adults ages 50-84……….37 Table 2.2: Hazard ratios for mortality from all causes according to body mass index at time of survey and body mass index at maximum………...…..39 Table 2.3: Age-standardized all-cause mortality rates (per 1,000 person-years) and hazard ratios for mortality from all causes according to
combinations of body mass index at time of survey and body mass index at maximum…………..…………..…………..…………..………40
Table 2.4: Population attributable fractions estimated using body mass index at time of survey and body mass index at maximum……..……..……..…….42
Table 3.1: Distribution of social and demographic covariates by family dinner status, US adults 25-49………73 Table 3.2: Odds ratios and 95% CI from logistic regression models relating
family dinner to obesity, US adults 25-49………...75 Table 3.3: Odds ratios and 95% CI from logistic regression models relating
family dinner to obesity by poverty status, US adults 25-49………...76 Table 3.4: Odds ratios and 95% CI from logistic regression models relating
family dinner to obesity by number of children < 18 in the household,
LIST OF FIGURES
Figure 1.1: Smoothed frequency distributions of body mass index by sex, ages
50-89...17 Figure 2.1: Distribution of body mass index at time of survey and at maximum among US never-smoking adults ages 50-84...34 Figure 2.2: Kaplan Meier curves for categories of BMI at time of survey and at
maximum...35
LIST OF APPENDICES
Table A.3.1: Odds ratios and 95% CI from logistic regression models relating
dinner alone and family dinner to obesity, US adults 25-49…...………….78 Table A.3.2: Odds ratios and 95% CI from logistic regression models relating
family dinner to obesity with adjustment for family income, US
adults 25-49………...80 Table A.3.3: Coefficients and 95% CI from OLS regression models relating family dinner to BMI, US adults 25-49………81 Table A.3.4: Coefficients and 95% CI from OLS regression models relating family dinner to BMI by poverty status, US adults 25-49………..……….83 Table A.3.5: Coefficients and 95% CI from OLS regression models relating
INTRODUCTION
The US has achieved substantial gains in population health over recent decades. Heart
disease rates have more than halved between 1980 and 2000 as a result of improved
medical management and impressive reductions in major risk factors (Ford et al. 2007).
Smoking rates have declined dramatically since the Surgeon General’s report of 1964. A
major exception to these favorable trends is obesity, which has risen dramatically in
recent decades both in the US and internationally (Flegal et al. 2010; Finucane et al.
2011; Hossain, Kawar, and Nahas 2007).
It is to the epidemic of obesity that this dissertation is addressed. Each study
examines obesity from a different perspective. The first chapter (co-authored with
Samuel H. Preston) assesses the contribution of obesity to international differences in
longevity. The paper finds higher obesity prevalence at younger ages and higher
prevalence of morbid obesity at all ages in the US compared to countries in Western
Europe. As a result, the findings indicate that obesity may explain between a fifth and a
third of the gap in life expectancy between the US and comparison countries.
In the second chapter, I investigate the mortality risks and population impact of
obesity in the older adult population of the United States using an innovative approach
that is robust to the biasing effects of illness-induced weight loss. Instead of using the
body mass index (BMI) at time of survey, I employ a measure of maximum lifetime BMI
to measure the mortality risks of obesity. The advantage of maximum BMI is that it better
captures the total physiological damage caused by obesity and is not susceptible to
fluctuations related to weight loss. I find that use of maximum BMI leads to
maximum BMI reveals that previous findings of weak associations between obesity and
mortality in older adults may be due to the fact that the normal BMI category combines
low-risk stable-weight individuals with high-risk individuals that have experienced
weight loss. Use of maximum BMI results in an estimate of the contribution of obesity to
mortality for older adults in the US that is substantially higher than that estimated using
BMI at time of survey. This implies that our estimates of the contribution of obesity to
the US longevity disadvantage in Chapter 1 may be conservative.
The third chapter examines sociological dimensions of obesity through a study of
social rituals of eating in the US. I focus one particular eating ritual that has been
emphasized in the prior literature: the family dinner. Using data from the American Time
Use Survey, I investigate the association between family dinner participation and obesity
in adults ages 25-49. The extensive detail in the time-use data allows for a more
meaningful definition of the family dinner than has been possible in prior studies. The
definition incorporates information on the timing, location and duration of the meal,
whether it was reported as the primary (e.g. main) activity being carried out and with
whom it occurred. My findings indicate that participation in the family dinner is
associated with a significantly lower probability of being obese and that the association is
robust to multiple controls for socio-economic status. This finding suggests that changing
CHAPTER 1
Contribution of Obesity to International Differences in Life Expectancy1
1.1 Introduction
Life expectancy in the United States (US) has fallen below that of most other
industrialized countries and ranked 32nd in the world in 2008 (World Health
Organization 2010). As President Obama has noted (2009), the relatively low level of life
expectancy in the US coexists with the highest per capita expenditure on health care in
the world. Explanations of the low US ranking range from a history of high levels of
cigarette smoking to low levels of physical activity, a poorly performing health care
sector, high levels of income inequality, and high levels of obesity (Crimmins, Preston,
and Cohen 2010). Identifying the responsible factors would help to clarify the critical
public health domains where the US has fallen furthest behind its peers.
The purpose of this paper is to estimate the extent to which the high level of
obesity in the US is contributing to its poor longevity performance. According to World
Health Organization estimates, men and women in the US had a higher prevalence of
obesity in 2005—defined as having a body mass index (BMI) (the ratio of weight in
kilograms to the square of height in meters) of 30.00 or higher—than any other country in
Europe, North America, or East Asia (World Health Organization 2005). Because many
studies demonstrate that obese individuals suffer an elevated risk of death (Prospective
Studies Collaboration 2009), it is reasonable to suppose that the high level of obesity in
the US is contributing to its comparatively low life expectancy.
1
The years of life lost by an individual as a result of his or her obesity have been
estimated in several studies (Fontaine et al. 2003; Prospective Studies Collaboration
2009). In this paper, we are asking a question about population health rather than
individual health: how many years of life are forfeited, on average, by members of a
population as a result of the level of obesity in that population. Answering this question
involves combining the prevalence of obesity in a population with the risks of mortality
for people in a particular BMI category in order to estimate the effects of obesity on
age-specific mortality rates. Estimates of the impact of obesity on a population’s level of life
expectancy are uncommon; an exception is Olshansky et al., whose effort was limited to
the US (Olshansky et al. 2005). Yet, these estimates are important as they provide a basis
for conducting cross-national comparisons, which can be used to determine why some
countries achieve better health outcomes than others.
We estimate the fraction of deaths attributable to obesity by age and sex for 16
countries including the US. We focus on ages above 50 since 94% of newborns survive to
age 50 in the current US life table and variation in life expectancy at birth is dominated
by variation in mortality above this age (Arias, Rostron, and Tejada-Vera 2010; Ho and
Preston 2009). We recalculate life tables for each country after removing deaths
attributable to obesity in order to estimate the extent of international variation in life
expectancy that is attributable to differences in BMI distributions. We explore the
sensitivity of results to the assumed set of risks associated with obesity and to
1.2 Methods
1.2.1 Data
We use BMI as our basic indicator of obesity. Flegal and Graubard have shown that the
proportion of deaths attributable to obesity does not vary significantly with the indicator
chosen (Flegal and Graubard 2009). In our baseline analysis, we assume that the relative
mortality risks in various BMI categories by age and sex that were recorded in a synthesis
of 57 prospective studies are applicable to all countries considered (Prospective Studies
Collaboration 2009). The Prospective Studies Collaboration (PSC) study is the largest
and most detailed of several large compilations of data on obesity and mortality (Allison
et al. 1999).The synthesis includes data on 895,000 participants, of whom 63% were
from Europe and Israel, 29% were from the US and Australia, and 8% were from Japan.
Results of this investigation have been presented by sex, age group (35-59, 60-69, 70-79,
80-89), and detailed BMI categories (2.5 unit intervals within the range 15.00-34.99 and
a single interval for 35.00-49.99).
Estimates of the population distribution of BMI were obtained from nationally
representative survey data. Height and weight data for estimating an individual's BMI are
based on self-reports obtained through in-person interviews except in Canada and
England where measured height and weight were used. In the US, both self-reported and
measured values are available and used.
Data for European countries excluding England were taken from the Survey of
Health, Ageing and Retirement in Europe (SHARE). We include individuals interviewed
in Wave 1 (2004) as well as a refresher sample from Wave 2 (2006-2007). Data for
Ageing (ELSA). US data come from the National Health and Nutrition Examination
Survey (NHANES) cycles 2003-2004, 2005-2006 and 2007-2008. Previous research has
found no significant national trend in obesity for either sex during this period in the US
(Flegal et al. 2010). Data for Canada were derived from cycle 3.1 (2005) of the Canadian
Community Health Survey (CCHS). .
Data for constructing period life tables, including deaths and population, were
obtained by country, age and sex in single-year age-intervals for 2006 from the Human
Mortality Database (HMD) (Wilmoth and Shkolnikov 2010).
1.2.2 Analytic Approach
To identify the proportion of deaths in a particular country/age/sex category that are
attributable to obesity, we hypothetically redistribute the population above the optimal
BMI category (i.e., the lowest-mortality category) in that group to the optimal category
and calculate the proportional reduction in mortality that would occur under this
redistribution. This is quantified using the population attributable fraction (PAF). We
construct estimates of BMI prevalence in the same age-sex-BMI groupings used by the
Prospective Studies Collaboration, with the exception that we apply the PSC mortality
values for ages 35-59 to ages 50-59. In the PSC, the lowest-risk BMI category is
22.50-24.99 except for males aged 80-89, for whom it is 20.00-22.49, and for females aged
70-79, for whom it is 25.00-27.49. We use the term obesity to refer to all weight categories
above the optimal, including those who are overweight (BMI between 25.00 and 30.00).
We do not change the proportion of persons below the optimal BMI category because our
to be zero above age 90 throughout our analysis. The PAF for population i (where i is an
indicator for each country, age and sex combination) is estimated as,
=
∑ − ∗
∑( ) (1)
where,
Cij = proportion of population i in BMI category j
Msj = death rate in BMI category j in the standard drawn from PSC data
C*ij = proportion of population i in BMI category j if all individuals above the
optimal BMI were redistributed to the optimal category
Equation 1 would give the same value of the PAF if the death rates were in the form of
relative risks, e.g., if numerator and denominator were divided by the death rate in the
optimal category.
The country, age and sex specific PAFs are applied to death rates in the HMD in
single-year age intervals to estimate what these rates would be if no one were obese. Life
expectancy at age 50 is then calculated using the modified death rates. Conventional
methods of calculating life tables were used (Preston, Heuveline, and Guillot 2001).
Hypothetical life expectancies obtained in this manner are then compared to the actual
values, also computed from the HMD, by country and sex. To identify the extent to
which the US shortfall in life expectancy is attributable to obesity, differences in actual
life expectancy between the US and each country are compared to the differences that
would be expected in the absence of obesity. When Canada and England are compared to
Analysis of uncertainty was conducted for PAFs and life expectancy estimates
using a bootstrapping procedure (Efron and Tibshirani 1986). Uncertainty estimates from
two sources are combined: uncertainty in the BMI data resulting from sampling
variability and uncertainty in estimation of the relative risks. For each country, age and
sex combination, BMI values are sampled randomly with replacement as many times as
there are non-missing observations on BMI in that country/age/sex category. To
incorporate uncertainty from the relative risks, vectors of the underlying effect
parameters of relative risks of length corresponding to the number of BMI intervals are
drawn from independent normal distributions with age and sex-specific standard errors
provided to us by the Prospective Studies Collaboration. The resulting vectors of risks are
applied to the simulated BMI distribution data to obtain country, age and sex specific
PAFs. These steps are repeated to obtain 500 estimates of each country, age and sex
specific attributable fraction, from which the 2.5th and 97.5th percentile values are
extracted as 95% confidence intervals.
We explore the sensitivity of results to the assumed set of risks associated with
obesity and to misreporting of height and weight. Flegal et al. have suggested that the
relative risks of death associated with obesity have declined in the US (Flegal et al.
2005). In order to investigate the effect of a possible reduction in obesity risks on
international comparisons, we introduce an alternative set of risk factors adapted from
Adams et al.that applies to a more recent period (Adams et al. 2006). These are derived
from a large study of 527,000 enrollees in the NIH-AARP Diet and Health Study that was
conducted in six US states and two cities. Enrollees were followed from enrollment in
relative risks are adjusted for smoking. In contrast to PSC procedure, relative risks in
Adams et al. are also adjusted for social status and physical activity.
We use the published results of this study to estimate relative risks in the age
categories that were employed in the baseline analysis reported above. To do so, we fit a
linear age-trend using weighted least-squares to risks that were originally reported in age
intervals 50-65, 56-70, 61-75, and 66-81. From primary data, we re-calculate the
proportions in various BMI intervals in each country to align with the categories used by
Adams et al. Standard errors for uncertainty estimation are approximated because of the
smoothing procedure we employed to obtain risks for the relevant ages.
Analysis of NHANES data shows that American women tend to underestimate
their weight, while both men and women tend to overestimate height at older ages (Ezzati
et al. 2006). To explore whether our results are sensitive to error in self-reports of height
and weight, we replicate all analyses after correcting self-reported height and weight for
misreporting using an approach similar to that which has been applied elsewhere
(Burkhauser and Cawley 2008). Using data on adults ages 50 and above from NHANES
2003-2008, we estimate linear regression models for each sex of measured height
(weight) versus self-reported height (weight), age and the square of age.
Analyses were conducted using STATA 10.1 (Stata Corp, College Station, Texas)
1.3 Results
1.3.1 Cross-National Comparison of Obesity Rates
Table 1.1 presents sample sizes in each country and the proportion of persons who are in
or above the standard BMI categories of overweight (BMI 25-29:99), obese class I (BMI
30-34:99), obese class II (BMI 35-39:99) and obese class III (BMI ≥ 40). The proportion
of individuals exceeding thresholds for class I, II and III obesity is higher in the US than
in any comparison country for both males and females. The proportionate difference
between the US and other countries grows larger as BMI increases. In Canada and
England, prevalence rates for obese class I and above exceed rates found in other
countries, yet remain consistently lower than in the US. The difference is most
pronounced for severe obesity with the prevalence of class III obesity in Canada and
England being about half of the level found in the US.
[TABLE 1.1 HERE]
Figure 1.1 shows smoothed frequency distributions of BMI by sex based on self-reports
for the US and a set of countries selected to show the range of variation present in the
sample. The US distribution has larger variance and is markedly right-skewed with
respect to the comparison countries.
[FIGURE 1.1 HERE]
1.3.2 Effects of Obesity on Longevity
Fractions of all-cause mortality attributable to obesity (PAF) by country, age and sex are
presented in Table 1.2. Confidence intervals for PAFs reflect sampling uncertainty in
than self-reported values of height and weight in the US leads to PAFs that are higher by
approximately 3%. The discrepancy between the PAFs in the US and other countries is
typically greatest for both men and women at ages 50-59, reflecting the unusually large
proportion of individuals obese in the US in those ages. Using self-reported data, the
fraction of deaths attributable to obesity for US women aged 50-59 is 0.20 (95% CI
0.17-0.27) compared to an average of 0.10 (0.08-0.15) in comparison countries. Mortality
attributable to obesity declines significantly with age for both males and females. For
females, the greatest effects are found in the age-group 60-69 while for males, the impact
of obesity is highest at ages 50-59. After reaching these levels, the effects of obesity on
mortality decline by about two-thirds across the age-range in both sexes.
[TABLE 1.2 HERE]
Table 1.3 presents life expectancy impacts implied by the estimates of deaths attributable
to obesity presented in Table 1.2. Reallocating individuals with higher-than-optimal BMI
to the lowest-risk BMI for their age and sex would increase life expectancy at age 50 in
the US by an estimated 1.28 years (1.14-1.70) for women and by 1.61 years (1.44-1.82)
for men when self-reported BMI data are used. In other countries with self-reported data,
female life expectancy would improve by an average of 0.73 years (0.63-1.13) and male
life expectancy would improve by an average of 0.98 years (0.86-1.16) if obesity were
eliminated. When measured BMI is used, the estimated gains in life expectancy in the US
are greater by an additional 0.24-0.26 years. No other country is estimated to gain as
much from the elimination of obesity as the US.
Table 1.4 presents the US shortfall in life expectancy at age 50 and the estimated change
in that shortfall if obesity were eliminated. The comparisons are made only to countries
with higher life expectancies. Since life expectancy at age 50 in the US would increase
substantially more than in other countries through the hypothetical elimination of obesity,
the US shortfall would be reduced and in some cases eliminated. US life expectancy for
women is 1.37 years lower than the mean of the 12 other countries. It would be an
estimated 0.80 years (0.70-0.87) lower without obesity, so that obesity accounts for an
average of 42% (36-48) of the gap. For men, the equivalent fraction of the difference in
life expectancy accounted for by obesity, relative to 10 higher life expectancy countries,
is 67% (57-76). For females, after the elimination of obesity the difference in life
expectancy between the US and England, Germany and Israel becomes statistically
indistinguishable from zero and US life expectancy surpasses that of the Netherlands. For
males, the difference in life expectancy between the US and France is eliminated and US
life expectancy surpasses that of Austria and the Netherlands. These estimates suggest
that obesity is contributing very substantially to the low US ranking in longevity.
[TABLE 1.4 HERE]
1.3.3 Sensitivity of Results to Alternative Risks
Results of using the alternative risk factors are presented in Table 1.5. In every country
for both sexes, the use of the alternative risk factors reduces the estimated gain in life
expectancy from eliminating obesity. For countries other than the US using self-reported
data, women's mean gain in life expectancy is only 42% as large using Adams et al. risk
smaller in the US than in other countries because a much higher fraction of the US
population resides in obesity classes II or III, where risks remain considerable even under
the alternative sets of risks.
Confining comparisons in Table 1.5 to countries with higher life expectancies
than the US, as in Table 1.4, we recalculate the proportion of the life expectancy gap that
is explained by obesity. Obesity accounts for 29% of the US shortfall for women and
32% for men using Adams’ risks. Obesity continues to account for a substantial part of
the US shortfall in life expectancy even when lower risks are assumed.
[TABLE 1.5 HERE]
We also applied a second alternative set of risk factors derived from NHANES III (Mehta
and Chang 2011). A national probability sample of 4375 individuals enrolled at ages
50-69 between 1988 and 1994 were followed into the National Death Index through 2006.
Advantages of the study include recent data, a probability sample of the US population,
and a relatively long follow-up period. Relative risks were adjusted for smoking and
socioeconomic status. The results (not shown) are very similar to those produced using
the Adams et al. risks: obesity accounts for 22% of the shortfall in life expectancy for US
women and 29% for men.
1.3.4 Effects of Misreporting of Height and Weight
After adjusting self-reported height and weight data for misreporting, the difference
between actual life expectancy at age 50 and life expectancy if obesity were eliminated
increases by 0.23 years for US females and by 0.20 for US males (results not shown).
less than in the US. As a result, correcting for misreporting positively affects the
magnitude of the life expectancy gap attributable to obesity between the US and other
countries. The greatest difference occurs between the US and Spain, amounting to 0.10
years for women and 0.17 for men. No other differences in the table reach a level of a
tenth of a year of life expectancy. We conclude that errors in self-reported BMI have
produced underestimates of the impact of obesity on life expectancy, and that the
underestimate is somewhat greater in the US than in most other countries. In this sense,
obesity explains more of the gap in life expectancy between the US and other countries
than is indicated by self-reports. However, the bias is modest, amounting in only one case
to a value larger than 0.10 of the life expectancy gap between US and other countries.
1.4 Discussion
In our analysis of the effects of obesity on longevity in 16 countries, we have shown that
obesity reduced longevity in all countries, ranging from half a year for females in
Switzerland to more than a year and a half for US males. These effects have been more
severe in the US than in other countries. Two key features of the US BMI distribution
that distinguish it from comparison countries include an unusually high rate of obesity in
younger age-groups and significantly higher rates of severe obesity. Comparing the US to
the two countries with the next highest rates of obesity – Canada and England-- gains to
life expectancy by hypothetically eliminating obesity are still 25-40% higher in the US.
As a result of its greater impact there, obesity has contributed substantially to the US
longevity disadvantage, which would be significantly reduced and in some cases
Olshansky et al. have also produced estimates of the effect of obesity on US life
expectancy using NHANES III risk factors (Olshansky et al. 2005).They do not use the
full BMI distribution but rather experiment with various binary specifications of risk,
producing estimated effects on US life expectancy that range widely from 0.28 years to
0.88 years. Our estimates in Table 1.5 are at the high end of that range when Adams’ risk
factors are used and far above it when risks from the Prospective Studies Collaboration
are used.
It is clear that the estimated effect of obesity on levels of life expectancy is
sensitive to the set of obesity risk factors that is used. The risk factors derived from the
studies of Adams et al. have the advantage of pertaining to a period closer to the time
when the levels of both obesity and mortality are recorded in the various countries and
when the PAFs are modeled. This study also controls social class in its analyses, an
important confounding factor of the relationship between obesity and mortality (Mehta
and Chang 2009).
The choice of the proper set of risk factors probably depends most heavily on
whether the mortality risks of obesity have declined. A large study begun in 1982 by the
American Cancer Society with follow-up of healthy non-smokers through 2002 found no
decline in the mortality risk from obesity (Calle, Teras, and Thun 2005). However, such a
decline has been found using successive waves of NHANES (Flegal et al. 2005). A
reduction in obesity risks in the US was also identified by Mehta and Chang in three
different data sets including NHANES, the Framingham study, and a National Health
A decline in the mortality risks of obesity may have occurred for a number of
reasons. Gregg et al. note that the use of lipid-lowering and antihypertensive medications
increased rapidly from 1988-94 to 1999-2000, with the largest gains among obese
individuals (Gregg, Cheng, and Cadwell 2010).Also, deaths from cardiovascular disease
are a diminishing proportion of all mortality (Beltrán-Sánchez, Preston, and
Canudas-Romo 2010).Combined with greater obesity risks from cardiovascular diseases than from
the aggregate of other causes of death, such a decline also implies that the all-cause
mortality risk from obesity should be declining.
An additional factor that may have reduced relative risks among the obese is the
rapid inflow of people into the obese category. A rapid increase such as occurred in the
US (Flegal et al. 2010) may produce a decline in the average duration of obesity for an
obese person. To the extent that there are duration effects of obesity—risks that cumulate
with length of time spent in the state—the risk of obesity per se may have declined when
duration is not accounted for in the research design. The fact that childhood or early
adulthood obesity is highly predictive of adult mortality implies that duration effects may
be important for obesity (Franks et al. 2010; Gavrilova and Gavrilov 2010).
If there were a clear-cut trend in the mortality risk of obesity, there would be a
strong reason to prefer estimates derived from the two most recent studies. But evidence
of a trend is suggestive rather than definitive, since it has not appeared in all analyses
where its presence has been investigated and it has not always been statistically
significant when it has appeared. As a result, we believe that our results should be
interpreted as providing a plausible range of estimates of the impact of obesity on the
Our analysis has a number of strengths. We used nationally representative data
from 16 countries to measure distributions of BMI, which together capture a large
fraction of the variation in obesity rates among high-income countries. We incorporated
detailed information on the mortality risks of obesity, differentiated by age, sex and fine
BMI intervals using high-quality data from a large meta-analysis of prospective cohort
studies. We characterized uncertainty in our estimates from multiple sources and
conducted numerous analyses of the sensitivity of our results to alternative procedures.
Our analysis is also subject to limitations. We assumed that the same set of
individual-level mortality risks of obesity was applicable to all countries, although these
risks may differ somewhat across contexts. Our analysis would have been strengthened
by the availability of measured BMI data in all sample countries and inclusion of data
from high-income countries outside North America and Europe, such as Japan and
Australia, where conditions may differ from those included in the sample. While the risk
factors that we used were adjusted for smoking behavior, they were not adjusted for all
other factors with which obesity may be correlated.
1.5 Conclusion
Based on our results, the high prevalence of obesity in the US has reduced life
expectancy at age 50 by 0.52 to 1.61 years for males and by 0.70 to 1.29 years for
females. In order to study the impact of obesity on international differences in longevity,
we have also estimated the effects of obesity on longevity in 15 other countries. We
conclude that, even when relatively low mortality risks associated with obesity are used,
- to the inferior level of longevity in the US. If the risk factors from the Prospective
Studies Collaboration are used, the impact of obesity is substantially larger, accounting
for 42% of the longevity shortfall for US women and 67% for US men.
High levels of obesity in the US appear to be strongly implicated in its inferior
level of longevity. We believe that this demonstration should add urgency to public
Figure 1.1 Smoothed frequency distributions of body mass index by sex, ages 50-89.
This Figure shows population distributions of BMI for the US and comparison countries.
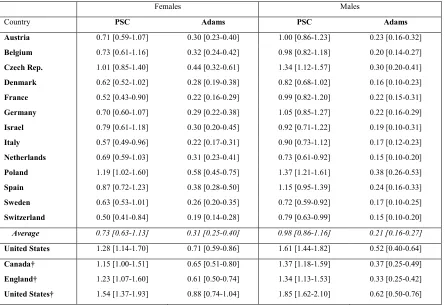
Table 1.1 Cumulative prevalence of overweight and obesity by country, adults 50-89
based on self-report [95% Confidence Intervals]
Percentages, Adults Aged 50-89 [95 % CI]
Females Males
Country Sample Size
BMI ≥ 25 BMI ≥ 30 BMI ≥ 35 BMI ≥ 40
BMI ≥ 25 BMI ≥ 30 BMI ≥ 35 BMI ≥ 40 Austria 1,840 57.0
[53.8-60.2] 21.0 [18.5-23.8] 4.7 [3.5-6.3] 1.5 [0.9-2.6] 69.2 [65.5-72.6] 19.3 [16.4-22.6] 3.9 [2.6-5.8] 1.1 [0.5-2.5]
Belgium 2,933 53.2 [50.6-55.8] 17.7 [15.8-19.7] 4.1 [3.2-5.2] 0.8 [0.4-1.3] 63.8 [61.2-66.4] 17.4 [15.5-19.6] 2.9 [2.1-3.9] 0.5 [0.2-1.1] Czech Rep.
1,768 67.7 [63.4-71.7] 22.8 [19.2-26.7] 4.6 [3.1-6.9] 1.0 [0.5-2.1] 75.9 [71.6-79.7] 21.8 [18.3-25.8] 2.7 [1.7-4.2] 0.8 [0.3-1.9]
Denmark 1,756 43.7 [40.4-47.1] 13.0 [10.9-15.5] 3.0 [2.1-4.3] 0.6 [0.3-1.3] 59.0 [55.4-62.5] 13.2 [10.9-15.8] 1.9 [1.1-3.0] 0.4 [0.1-1.3]
France 2,774 46.0 [42.7-49.3] 15.5 [13.0-18.4] 3.2 [2.3-4.6] 1.2 [0.6-2.3] 61.6 [57.8-65.4] 16.5 [13.8-19.7] 3.0 [1.7-5.1] 0.3 [0.1-1.8]
Germany 2,885 54.8 [51.9-57.6] 15.8 [13.8-17.9] 4.4 [3.4-5.7] 1.4 [0.8-2.2] 67.9 [64.9-70.7] 16.4 [14.3-18.9] 3.8 [2.8-5.3] 0.8 [0.4-1.7]
Israel 2,146 57.9 [48.7-66.6] 19.0 [13.9-25.4] 3.5 [2.0-6.2] 1.0 [0.3-2.7] 64.3 [57.5-70.5] 14.0 [10.1-19.1] 3.3 [1.3-7.9] 0.6 [0.1-2.7]
Italy 2,751 53.2 [50.0-56.4] 15.9 [13.8-18.3] 3.1 [2.2-4.2] 0.6 [0.3-1.1] 67.3 [63.9-70.5] 14.9 [12.6-17.5] 3.1 [2.1-4.6] 0.2 [0.1-0.5] Netherla nds
2,812 52.7 [49.8-55.6] 15.9 [14.0-18.1] 4.3 [3.3-5.7] 1.5 [0.9-2.4] 62.5 [59.1-65.8] 12.7 [10.9-14.9] 2.4 [1.7-3.5] 0.4 [0.2-0.9]
Poland 1,681 68.3 [64.9-71.6] 27.3 [24.4-30.5] 6.2 [4.8-8.1] 1.1 [0.6-1.9] 64.5 [60.7-68.1] 20.1 [17.3-23.3] 4.0 [2.7-5.8] 0.8 [0.3-1.9]
Spain 1,994 66.5 [63.2-69.6] 23.9 [21.2-26.8] 7.5 [6.0-9.4] 1.9 [1.1-3.1] 71.9 [68.4-75.1] 20.6 [17.8-23.7] 3.7 [2.4-5.4] 0.3 [0.1-1.0]
Sweden 2,966 52.1 [49.1-55.0] 16.4 [13.8-19.2] 3.3 [2.4-4.4] 0.9 [0.5-1.7] 56.7 [52.6-60.6] 13.9 [10.4-18.3] 4.2 [1.6-10.3] 0.5 [0.2-1.2] Switzerla nd
1,615 41.4 [38.0-44.9] 12.5 [10.4-15.0] 3.1 [2.1-4.6] 0.7 [0.3-1.6] 61.8 [58.2-65.4] 14.2 [11.7-17.1] 2.5 [1.6-4.1] 0.0 [0.0-0.0] Average
2,302 55.0 [54.0-56.2] 18.2 [17.5-19.1] 4.2 [3.9-4.7] 1.1 [0.9-1.3] 65.1 [64.0-66.1] 16.5 [15.7-17.3] 3.2 [2.7-3.7] 0.5 [0.4-0.7] United States
7,526 61.9 [59.7-64.0] 31.0 [29.1-32.9] 12.3 [11.6-13.2] 5.1 [4.3-6.0] 73.3 [71.3-75.2] 30.9 [28.6-33.2] 8.8 [7.5-10.3] 2.5 [1.9-3.3]
Canada† 1,979 65.5 [60.9-69.9] 28.6 [24.9-32.7] 11.8 [9.2-15.1] 3.2 [2.0-5.3] 79.3 [75.0-83.0] 32.9 [27.9-38.4] 5.9 [4.1-8.4] 1.7 [0.8-3.7]
England† 7,153 69.6 [68.1-71.1] 31.0 [29.5-32.6] 9.8 [8.9-10.9] 3.0 [2.5-3.6] 75.9 [74.3-77.4] 27.2 [25.5-28.9] 6.0 [5.1-6.9] 1.0 [0.7-1.5] United States†
6,511 67.4 [65.2-69.4] 36.3 [34.0-38.6] 16.5 [15.0-18.1] 7.0 [6.0-8.1] 76.9 [75.2-78.5] 34.6 [32.5-36.9] 11.7 [10.2-13.3] 3.3 [2.6-4.2]
This table presents data on the cumulative distribution of overweight and obesity based
on various thresholds of BMI. Prevalence rates are age-standardized to the US 2000
Census population using age-groups 50-59, 60-69, 70-79 and 80-89. Sampling weights
were used to adjust BMI estimates for unequal selection probabilities and standard errors
were adjusted for cluster design and stratification where this information was available.
Table 1.2 Estimated proportion of all-cause mortality attributable to obesity by
country, age and sex [95% Confidence Intervals]
Population Attributable Fractions, Adults Aged 50-89 [95% CI]
Females Males
Country 50-59 60-69 70-79 80-89 50-59 60-69 70-79 80-89 Austria 0.13
[0.10-0.19] 0.18 [0.13-0.23] 0.08 [0.06-0.14] 0.06 [0.02-0.16] 0.19 [0.15-0.23] 0.13 [0.10-0.16] 0.10 [0.07-0.13] 0.05 [0.00-0.12]
Belgium 0.09 [0.07-0.15] 0.16 [0.11-0.20] 0.10 [0.08-0.15] 0.06 [0.02-0.17] 0.16 [0.13-0.20] 0.12 [0.09-0.15] 0.10 [0.07-0.13] 0.07 [0.00-0.14] Czech Rep. 0.10 [0.07-0.17] 0.19 [0.13-0.25] 0.14 [0.10-0.21] 0.07 [0.02-0.18] 0.18 [0.14-0.22] 0.16 [0.12-0.20] 0.12 [0.08-0.15] 0.09 [0.00-0.17]
Denmark 0.08 [0.06-0.13] 0.11 [0.06-0.14] 0.09 [0.07-0.15] 0.03 [0.01-0.14] 0.13 [0.10-0.17] 0.11 [0.08-0.14] 0.07 [0.05-0.10] 0.06 [0.00-0.13]
France 0.08 [0.06-0.14] 0.12 [0.08-0.17] 0.08 [0.06-0.14] 0.04 [0.01-0.15] 0.15 [0.11-0.19] 0.13 [0.09-0.17] 0.10 [0.07-0.13] 0.06 [0.00-0.13]
Germany 0.09 [0.08-0.15] 0.16 [0.11-0.21] 0.11 [0.09-0.17] 0.05 [0.01-0.15] 0.15 [0.12-0.19] 0.13 [0.11-0.16] 0.11 [0.08-0.14] 0.08 [0.00-0.15]
Israel 0.10 [0.06-0.18] 0.14 [0.09-0.19] 0.15 [0.10-0.22] 0.05 [0.00-0.15] 0.15 [0.10-0.21] 0.13 [0.09-0.18] 0.11 [0.06-0.17] 0.05 [0.00-0.12]
Italy 0.09 [0.07-0.15] 0.14 [0.10-0.19] 0.09 [0.07-0.15] 0.05 [0.01-0.16] 0.14 [0.11-0.18] 0.13 [0.10-0.16] 0.10 [0.07-0.13] 0.07 [0.00-0.14] Netherlan ds 0.10 [0.08-0.16] 0.13 [0.08-0.18] 0.11 [0.08-0.17] 0.05 [0.01-0.14] 0.13 [0.10-0.16] 0.13 [0.10-0.15] 0.07 [0.05-0.10] 0.04 [0.00-0.11]
Poland 0.14 [0.11-0.21] 0.22 [0.16-0.27] 0.16 [0.13-0.22] 0.06 [0.02-0.17] 0.16 [0.13-0.21] 0.16 [0.13-0.20] 0.10 [0.08-0.13] 0.06 [0.00-0.12]
Spain 0.12 [0.10-0.19] 0.21 [0.15-0.27] 0.14 [0.11-0.20] 0.09 [0.03-0.18] 0.18 [0.14-0.23] 0.15 [0.12-0.18] 0.11 [0.08-0.14] 0.09 [0.00-0.16]
Sweden 0.09 [0.07-0.16] 0.13 [0.08-0.17] 0.10 [0.08-0.16] 0.05 [0.02-0.16] 0.16 [0.10-0.24] 0.11 [0.09-0.14] 0.08 [0.06-0.10] 0.04 [0.00-0.10] Switzerla nd 0.06 [0.04-0.10] 0.11 [0.07-0.16] 0.09 [0.06-0.14] 0.05 [0.01-0.14] 0.14 [0.11-0.18] 0.11 [0.08-0.15] 0.09 [0.06-0.13] 0.06 [0.00-0.13]
Average 0.10 [0.08-0.15] 0.15 [0.11-0.20] 0.11 [0.09-0.17] 0.05 [0.02-0.16] 0.16 [0.13-0.19] 0.13 [0.11-0.16] 0.10 [0.07-0.12] 0.06 [0.00-0.12] United States 0.20 [0.17-0.27] 0.23 [0.18-0.28] 0.14 [0.12-0.19] 0.06 [0.03-0.16] 0.24 [0.21-0.29] 0.21 [0.18-0.24] 0.14 [0.11-0.17] 0.07 [0.00-0.13]
Canada† 0.15 [0.12-0.22] 0.26 [0.20-0.33] 0.14 [0.11-0.20] 0.09 [0.04-0.19] 0.23 [0.19-0.28] 0.22 [0.18-0.26] 0.14 [0.10-0.17] 0.07 [0.00-0.14]
England† 0.17 [0.14-0.23] 0.22 [0.17-0.27] 0.17 [0.15-0.22] 0.09 [0.04-0.19] 0.22 [0.19-0.26] 0.18 [0.15-0.21] 0.13 [0.10-0.15] 0.11 [0.00-0.17] United States† 0.22 [0.20-0.30] 0.26 [0.20-0.31] 0.18 [0.15-0.23] 0.09 [0.04-0.19] 0.26 [0.22-0.31] 0.23 [0.20-0.26] 0.17 [0.13-0.20] 0.10 [0.00-0.16]
Source of relative risks: Prospective Studies Collaboration. †BMI calculated using
measured height and weight. 95% confidence intervals for PAFs incorporate sampling
uncertainty in estimates of the distribution of BMI and estimation uncertainty in relative
Table 1.3 Life expectancy at age 50 (e50) in 2006 in the presence and absence of
all-cause mortality attributable to obesity by country and sex (in years) [95%
Confidence Intervals]
Females Males
Country e50 Actual e50 without Obesity Difference e50 Actual e50 without Obesity Difference
Austria 33.96 34.67 0.71 [0.59-1.07] 29.39 30.39 1.00 [0.86-1.23]
Belgium 33.70 34.42 0.73 [0.61-1.16] 29.03 30.01 0.98 [0.82-1.18]
Czech Rep. 31.24 32.25 1.01 [0.85-1.40] 26.04 27.38 1.34 [1.12-1.57]
Denmark 31.90 32.52 0.62 [0.52-1.02] 28.22 29.05 0.82 [0.68-1.02]
France 35.68 36.20 0.52 [0.43-0.90] 29.86 30.85 0.99 [0.82-1.20]
Germany 33.60 34.31 0.70 [0.60-1.07] 29.07 30.12 1.05 [0.85-1.27]
Israel 33.61 34.40 0.79 [0.61-1.18] 30.64 31.56 0.92 [0.71-1.22]
Italy 35.24 35.81 0.57 [0.49-0.96] 30.57 31.47 0.90 [0.73-1.12]
Netherlands 33.31 34.00 0.69 [0.59-1.03] 29.45 30.18 0.73 [0.61-0.92]
Poland 31.39 32.58 1.19 [1.02-1.60] 24.73 26.09 1.37 [1.21-1.61]
Spain 35.40 36.27 0.87 [0.72-1.23] 29.94 31.09 1.15 [0.95-1.39]
Sweden 34.10 34.73 0.63 [0.53-1.01] 30.45 31.17 0.72 [0.59-0.92]
Switzerland 35.33 35.83 0.50 [0.41-0.84] 31.14 31.93 0.79 [0.63-0.99]
Average 33.73 34.46 0.73 [0.63-1.13] 29.12 30.10 0.98 [0.86-1.16]
United States 32.95 34.23 1.28 [1.14-1.70] 29.20 30.81 1.61 [1.44-1.82]
Canada† 34.50 35.66 1.15 [1.00-1.51] 30.72 32.09 1.37 [1.18-1.59]
England† 33.31 34.54 1.23 [1.07-1.60] 29.84 31.18 1.34 [1.13-1.53]
United States† 32.95 34.49 1.54 [1.37-1.93] 29.20 31.05 1.85 [1.62-2.10]
Table 1.4 US shortfall in life expectancy at age 50 relative to higher life expectancy
countries, and change in that shortfall produced by eliminating obesity (in years)
[95% Confidence Intervals]
Females Males
Country Gap in e50
(Actual)
Gap in e50 without
obesity
Fraction of actual gap attributable to
obesity*
Gap in e50
(Actual)
Gap in e50 without
obesity
Fraction of actual gap attributable to
obesity*
Austria 1.01 0.44 [0.31:0.54] 0.56 0.19 -0.42 [-0.55:-0.28] >1.00
Belgium 0.75 0.19 [0.07:0.27] 0.74 - - - -
Canada† 1.56 1.17 [0.99:1.32] 0.25 1.52 1.04 [0.89:1.21] 0.31
England† 0.36 0.05 [-0.07:0.13] 0.86 0.65 0.13 [0.02:0.26] 0.79
France 2.73 1.97 [1.83:2.08] 0.28 0.66 0.04 [-0.10:0.19] 0.94
Germany 0.66 0.08 [-0.04:0.18] 0.89 - - - -
Israel 0.67 0.17 [-0.07:0.34] 0.75 1.44 0.75 [0.52:0.96] 0.48
Italy 2.29 1.58 [1.45:1.70] 0.31 1.37 0.66 [0.52:0.79] 0.52
Netherlands 0.37 -0.23 [-0.36:-0.12] >1.00 0.25 -0.63 [-0.77:-0.50] >1.00
Spain 2.46 2.04 [1.90:2.17] 0.17 0.74 0.27 [0.12:0.44] 0.63
Sweden 1.15 0.50 [0.37:0.60] 0.57 1.25 0.36 [0.21:0.49] 0.71
Switzerland 2.38 1.60 [1.44:1.71] 0.33 1.94 1.12 [0.96:1.24] 0.42
Average 1.37 0.80 [0.70:0.87] 0.42 [0.36:0.48] 1.00 0.33 [0.24:0.43] 0.67 [0.57:0.76]
Shortfalls in life expectancy for countries with self-reported height and weight data are
calculated in respect to self-reported BMI values for the US. †Estimates are based on
measured values of height and weight and are compared to US measured data. Dashed
cells indicate a lower life expectancy at age 50 in that country and sex compared to the
US. *The average value in this column is based on the average gap with and without
obesity.
Table 1.5 Estimated gain in life expectancy at age 50 in 2006 from hypothetically
redistributing obese to optimal BMI categories, using two sets of risk factors (in
years) [95% Confidence Intervals].
Females Males
Country PSC Adams PSC Adams
Austria 0.71 [0.59-1.07] 0.30 [0.23-0.40] 1.00 [0.86-1.23] 0.23 [0.16-0.32]
Belgium 0.73 [0.61-1.16] 0.32 [0.24-0.42] 0.98 [0.82-1.18] 0.20 [0.14-0.27]
Czech Rep. 1.01 [0.85-1.40] 0.44 [0.32-0.61] 1.34 [1.12-1.57] 0.30 [0.20-0.41]
Denmark 0.62 [0.52-1.02] 0.28 [0.19-0.38] 0.82 [0.68-1.02] 0.16 [0.10-0.23]
France 0.52 [0.43-0.90] 0.22 [0.16-0.29] 0.99 [0.82-1.20] 0.22 [0.15-0.31]
Germany 0.70 [0.60-1.07] 0.29 [0.22-0.38] 1.05 [0.85-1.27] 0.22 [0.16-0.29]
Israel 0.79 [0.61-1.18] 0.30 [0.20-0.45] 0.92 [0.71-1.22] 0.19 [0.10-0.31]
Italy 0.57 [0.49-0.96] 0.22 [0.17-0.31] 0.90 [0.73-1.12] 0.17 [0.12-0.23]
Netherlands 0.69 [0.59-1.03] 0.31 [0.23-0.41] 0.73 [0.61-0.92] 0.15 [0.10-0.20]
Poland 1.19 [1.02-1.60] 0.58 [0.45-0.75] 1.37 [1.21-1.61] 0.38 [0.26-0.53]
Spain 0.87 [0.72-1.23] 0.38 [0.28-0.50] 1.15 [0.95-1.39] 0.24 [0.16-0.33]
Sweden 0.63 [0.53-1.01] 0.26 [0.20-0.35] 0.72 [0.59-0.92] 0.17 [0.10-0.25]
Switzerland 0.50 [0.41-0.84] 0.19 [0.14-0.28] 0.79 [0.63-0.99] 0.15 [0.10-0.20]
Average 0.73 [0.63-1.13] 0.31 [0.25-0.40] 0.98 [0.86-1.16] 0.21 [0.16-0.27]
United States 1.28 [1.14-1.70] 0.71 [0.59-0.86] 1.61 [1.44-1.82] 0.52 [0.40-0.64]
Canada† 1.15 [1.00-1.51] 0.65 [0.51-0.80] 1.37 [1.18-1.59] 0.37 [0.25-0.49]
England† 1.23 [1.07-1.60] 0.61 [0.50-0.74] 1.34 [1.13-1.53] 0.33 [0.25-0.42]
United States† 1.54 [1.37-1.93] 0.88 [0.74-1.04] 1.85 [1.62-2.10] 0.62 [0.50-0.76]
The two sets of risk factors used in the calculations are drawn from the Prospective
Studies Collaboration and Adams et al. †Estimates are based on measured values of
CHAPTER 2
Using Maximum Weight to Redefine Body Mass Index Categories in Studies of the Mortality Risks of Obesity2
2.1 Introduction
Many studies of body mass index (BMI, measured in kg/m2) and mortality in older adults
find weak or even inverse associations between excess BMI and mortality (Corrada et al.
2006; Flegal et al. 2013; Oreopoulos et al. 2009; Stevens et al. 1998). Several physiologic
and behavioral explanations for the paradoxical findings have been proposed (Flegal and
Kalantar-Zadeh 2013). A statistical explanation for the weak or inverse associations
identified in prior research is confounding by illness-induced weight loss—also referred
to as reverse causality (Hu 2008; Wannamethee, Shaper, and Walker 2001; Willett, Dietz,
and Colditz 1999).
Consistent with the statistical explanation, numerous studies find significantly
stronger mortality risks of obesity after implementing measures aimed at reducing reverse
causality, such as restricting samples to “healthy” participants and delaying onset of risk
for several years after the time of the survey (Adams et al. 2006; De Gonzalez et al.
2010). These strategies, however, have been criticized on several grounds: the exclusions
lead to eliminating a large proportion of deaths among respondents, thereby reducing the
generalizability of findings (Flegal et al. 2007). Also, pre-existing illness is identified on
the basis of respondent self-reports, meaning that individuals with undiagnosed illnesses
cannot be excluded. Finally, delaying onset of risk for several years may not be effective
2
A slightly modified version of this chapter is published as: Stokes, A (2014). “Using Maximum Weight to
at addressing reverse causality, as illness-induced weight loss can begin many years
before death (Alley et al. 2010).
In this study, I investigate the mortality risks of obesity among older adults in the
US using an approach that incorporates individual weight histories and is robust to
reverse causality. Unlike other methods of addressing reverse causality, the present
approach does not require excluding participants or delaying onset of risk. Instead of
using BMI at time of survey, I employ a measure of maximum lifetime BMI. The
advantage of the latter is that it is not susceptible to fluctuations in BMI related to illness.
I also calculate the population attributable fractions for overweight and obesity for US
adults implied by the estimated mortality risks.
2.2 Methods
2.2.1 Data
The National Health and Nutrition Examination Surveys (NHANES) provide nationally
representative data on health for the US noninstitutional population. I used data from
NHANES 3 (1988-1994) and continuous NHANES (1999-2004) to construct the cohort
and obtained information on mortality status through the end of 2006 from the National
Death Index (National Center for Health Statistics. Office of Analysis and Epidemiology.
2009). The sample was restricted to never-smoking adults ages 50-84. The exclusion of
ever-smokers was carried out because smoking is a powerful confounder of the
association between BMI and mortality (Hu 2008; Mehta and Chang 2011; Prospective
Studies Collaboration 2009). After these exclusions and further eliminating those with
consisted of 5,566 individuals. A total of 928 deaths occurred during follow-up in 42,815
person-years.
2.2.2 Measures
Demographic variables (gender, race/ethnicity, and educational attainment) and
maximum weight were determined by interview. To ascertain maximum weight,
NHANES respondents were asked, “Up to the present time, what is the most you have
ever weighed?” Respondents were instructed not to include weight during pregnancy.
Weight and height at the time of survey were measured by trained personnel in mobile
examination clinics and used to calculate BMI at the time of survey. Maximum weight
was combined with height measured at the time of survey to calculate maximum BMI.
Categories of BMI at time of survey and at maximum were constructed on the basis of
the continuous measures. For both variables, I used the standard WHO categories: normal
(18.5-25 kg/m2), overweight (25.0-30.0 kg/m2), obese class 1 (30.0-35.0 kg/m2), and
obese class 2 (35.0 kg/m2 and above). Respondents were also categorized into ten
different weight trajectories (normal-normal, over-normal, obese 1-normal, obese
2-normal, over-over, obese 1-over, obese 2-over, obese 1-obese 1, obese 2-obese 1, obese
2-obese 2) on the basis of their maximum BMI and BMI at time of survey. For example,
an individual who was in the obese class 2 category at their maximum and in the normal
2.2.3 Analytic Approach
Mortality rates were calculated as the ratio of the number of deaths to person-years and
standardized to the US population in 2000 using five-year age groups between 50-54 and
80-84. Rates were calculated separately based on BMI at maximum and at time of survey
as well as for each of 10 weight trajectories defined on the basis of both variables. Cox
proportional hazards models with age as the underlying time scale were used to examine
the hazard ratios associated with each BMI category relative to the reference category of
normal BMI. Hazard ratios were also estimated for each of the 10 weight trajectories
using normal BMI at maximum and at time of survey as the reference group. All models
were adjusted for gender, race/ethnicity, and educational attainment.
I used the hazard ratios obtained above to estimate population attributable
fractions (PAF). These provide an estimate of the percentage of mortality at the
population level that is attributable to the combination of overweight and obesity. I use
the following formula to estimate PAFs:
−
=
k k k k
HR HR pd
PAF 1 (1)
Equation 1 is the appropriate formula for use with hazard ratios adjusted for confounding
(Rockhill, Newman, and Weinberg 1988). In this equation, PAFk denotes the PAF for the
kth level of the risk factor, pdk denotes exposure to risk at level k among deceased
individuals, and HRk is the hazard ratio associated with exposure level k. The exposure
categories for which PAFk is estimated include overweight, obese class 1, and obese class
2. The total PAF is obtained by summing the PAFs across exposure categories.
All estimates incorporated sampling weights that capture unequal probabilities of
NHANES. Analyses were carried out using STATA 12 (StataCorp, Texas, USA).
Variances were estimated with the SVY routine, which uses Taylor series linearization.
2.3 Results
2.3.1 Descriptive Statistics
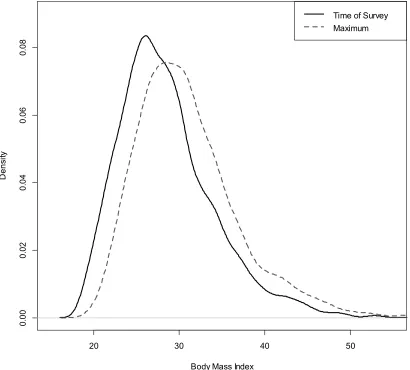
Figure 2.1 presents a comparison of the population distributions of BMI measured using
time of survey and maximum values. Comparison of the two distributions reveals a
greater density at higher BMI values using maximum values.
[FIGURE 2.1 HERE]
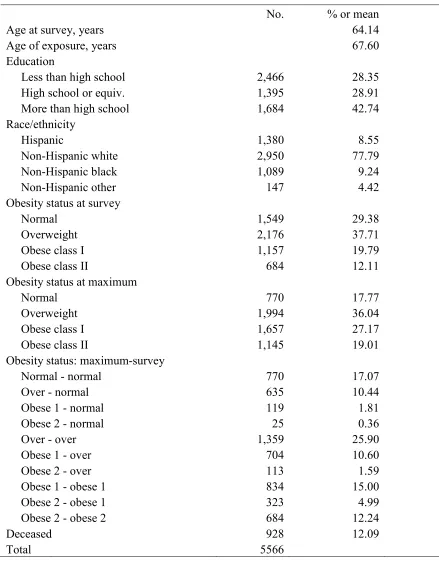
Descriptive statistics of the study sample, consisting of US adults ages 50-84 who never
smoked, are presented in Table 2.1. Mean age at survey was slightly over 64 years. At the
time of the survey, 20% and 12% of adults were in the obese class 1 and obese class 2
categories, respectively. When obesity status was assessed using maximum BMI, the
percent obese class 1 and obese class 2 climbed to 27% and 19%.
[TABLE 2.1 HERE]
Table 2.1 also shows the population distribution across 10 categories defined using
information on BMI at maximum and at time of survey. The majority of individuals
(70%) were at their maximum BMI at the time of survey; 17% of individuals were in the
normal BMI category both at time of survey and at their maximum BMI, and 26%, 15%,
and 12% were overweight, obese class 1, and obese class 2 at both values. The remaining
30% of the population lost weight between their BMI at maximum and time of survey.
The majority of individuals in this subpopulation transited between the overweight and
the population experienced more significant weight loss, with about 2% of individuals
going from obese class 2 to normal or overweight and another 2% going from obese class
1 to the normal category.
2.3.2 Analysis
Cox proportional hazards models predicting mortality for each of the two categorical
measures of BMI are presented in Table 2.2. The results show a much stronger
relationship using maximum values. In the specification using BMI at time of survey, the
hazard ratios for obese class 1 and obese class 2 were only moderately associated with
mortality and were not significant (obese class 1: 1.18 [95% confidence interval (CI),
0.91-1.54); obese class 2: 1.31 [95% CI, 0.95-1.81]). However, in the model using
maximum BMI, both categories of obesity were strongly and significantly related to
mortality (obese class 1: 1.67 [95% CI, 1.15-2.40]; obese class 2: 2.15 [95% CI,
1.47-3.14]).
[TABLE 2.2 HERE]
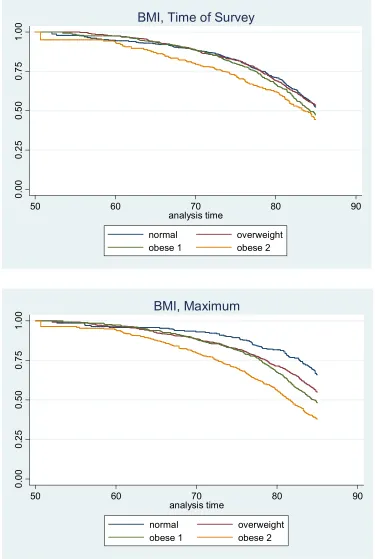
Kaplan Meier survival curves by category of BMI also reveal more substantial
differences in survival across BMI categories using maximum values (Figure 2.2). A
notable difference between the two sets of results is the improved survival of individuals
in the normal BMI category when maximum values are used.
[FIGURE 2.2 HERE]
Table 2.3 again shows the hazard ratios for BMI at maximum and at time of survey (these
results appear in the first row and column of the table). However, Table 2.3 has two
deaths per 1,000 person-years) associated with categories of BMI at maximum and at
time of survey. Second, it shows age-standardized mortality rates and hazard ratios for
each combination of BMI at maximum and time of survey. This information is arrayed in
a matrix with the rows identifying categories of BMI at time of survey and columns
identifying BMI at maximum. Cells below the diagonal are empty because BMI at time
of survey is always equal to or less than BMI at maximum.
[TABLE 2.3 HERE]
The lowest mortality rates are generally along the diagonal of the matrix corresponding to
persons with stable or increasing weight. Those with the lowest mortality rates were
individuals of normal weight at their maximum and survey values (7.17 [95% CI,
4.58-9.76]) (measured by deaths per 1,000 person-years), followed by individuals who were
overweight (8.02 [95% CI, 6.23-9.81]) or obese class 1 (12.52 [95% CI, 8.10-16.95]) at
both their maximum and survey values. Mortality rates were consistently higher in
subgroups above the diagonal of the matrix—individuals who lost weight between their
BMI at maximum and time of survey. The population subgroups with the highest
mortality rates were those that exhibited the most weight loss, including those that went
from obese class 2 to normal and overweight and individuals that went from obese class 1
to normal weight. Although the mortality rates were very large in the groups that lost the
most weight, the proportion of the population in these groups was small. Only about 2%
of individuals transited from obese class 2 to normal or overweight between
measurements (Table 2.1).
Table 2.3 also shows that the mortality rate for normal weight individuals was