Registries: The Impact of Newborn Screening
WHAT’S KNOWN ON THIS SUBJECT: Registries have been established in a number of countries to monitor the health of patients with cysticfibrosis. Few international comparisons have been made between registries. International data registry comparisons may be useful for informing best practice and benchmarking.
WHAT THIS STUDY ADDS: Registry comparisons are feasible but are limited by factors such as nonstandardization of data collection. Lung function was lower in Australian children with cysticfibrosis compared with their US counterparts after adjusting for the benefits of diagnosis after newborn screening.
abstract
BACKGROUND AND OBJECTIVES:National data registries for cysticfi -brosis (CF) enable comparison of health statistics between countries. We examined the US and Australian CF data registries to compare de-mographics, clinical practice and outcome measures.
METHODS:We compared the 2003 US and Australian registries. Differ-ences in pulmonary and growth outcomes were assessed by creating models controlling for differences in age, gender, genotype, and diag-nosis after newborn screening.
RESULTS:Data on 12 994 US and 1220 Australian patients aged#18 years were analyzed. A significant difference was noted in the pro-portion who had been diagnosed after newborn screening (Australian 65.8% vs United States 7.2%;P, .001). Australian children had sig-nificantly greater mean height percentile (41.0 vs 32.6;P,.001) and weight percentile (43.5 vs 36.1; P = .028) than US children. Mean forced expiratory volume in 1 second (FEV1) percent predicted ad-justed for age, gender, and genotype was similar in the 2 countries (P
= .80). Patients diagnosed after newborn screening had higher mean FEV1 (5.3 [95% confidence interval (CI): 3.6–7.0]) percent predicted and BMI (0.26 [95% CI: 0.09–0.43]). Mean FEV1 of Australian patients diagnosed after newborn screening was lower by 5.2 (95% CI: 2.8–7.6) percent predicted compared with US children.
CONCLUSIONS:Children diagnosed with CF after newborn screening benefited from better lung function and BMI than those diagnosed clin-ically. The benefit of newborn screening on lung function was signif-icantly less in Australian children compared with US children. Statistical comparisons between CF registries are feasible and can contribute to benchmarking and improvements in care. Pediatrics
2012;129:e348–e355
AUTHORS:Bradley Martin, FRACP,a,bMichael S. Schechter, MD, MPH,cAdam Jaffe, MD,a,bPeter Cooper, MD,d Scott C. Bell, MD,e,f,gand Sarath Ranganathan, PhDh,i,j,k
aDepartment of Respiratory Medicine, Sydney Children’s Hospital,
Randwick, New South Wales, Australia;bUniversity of New South
Wales, New South Wales, Australia;cEmory University School of
Medicine and Children’s Healthcare of Atlanta, Atlanta, Georgia;
dDepartment of Respiratory Medicine Children’s Hospital at
Westmead, Westmead, New South Wales, Australia;eThe Prince
Charles Hospital, Chermside, Queensland, Australia;fSchool of
Medicine, University of Queensland, Chermside, Queenslands, Australia;gQueensland Children’s Medical Research Institute,
Herston, Queensland, Australia;hDepartment of Respiratory
Medicine, Royal Children’s Hospital Melbourne, Parkville, Victoria, Australia;iBrighton and Sussex Medical School, Brighton, United
Kingdom;jInfection, Immunity and Environment, Murdoch
Children’s Research Unit, Parkville, Victoria, Australia; and
kDepartment of Paediatrics, University of Melbourne, Parkville,
Victoria, Australia
KEY WORDS
cysticfibrosis, lung function, newborn screening
ABBREVIATIONS
CDC—Centers for Disease Control and Prevention CF—cysticfibrosis
FEV1—forced expiratory volume in 1 second
All listed authors have made substantial contributions to the conception and design of the study and the analysis and interpretation of data. All authors have contributed to drafting of the article and revising it critically for intellectual content. All authors have approved thefinal version of the manuscript.
www.pediatrics.org/cgi/doi/10.1542/peds.2011-0567
doi:10.1542/peds.2011-0567
Accepted for publication Jul 20, 2011
Address correspondence to Associate Professor Sarath Ranganathan, PhD, Department of Respiratory Medicine, Royal Children’s Hospital Melbourne, Flemington Road, Parkville, VIC Australia 3052. E-mail: sarath.ranganathan@rch.org.au
PEDIATRICS (ISSN Numbers: Print, 0031-4005; Online, 1098-4275).
Although cysticfibrosis (CF) is the most common life-limiting inherited condition affecting white populations, it remains a relatively rare disease, affecting ap-proximately 1 in 3000 people of Euro-pean descent.1CF care is coordinated in
specialized multidisciplinary clinics, but the number of patients attending each clinic is limited, which curtails oppor-tunities for research. Over the last few decades, registries have been insti-tuted in a number of countries for the purpose of monitoring the health and management of patients with CF. These registries also provide valuable oppor-tunities for benchmarking, quality im-provement, and research by collating data on a large number of patients.
The US Cystic Fibrosis Foundation Pa-tient Registry was created.40 years ago to monitor the health of people with CF across the United States. The Australasian CF Data Registry is a more recent development, collecting data from 1998. Data were submitted to the Australasian registry from CF treatment centers in Australia and New Zealand until 2002, but from 2003 onward only Austra-lian data have been submitted. Currently, health information for .26 000 US pa-tients and.2300 Australian patients is collected by the respective registries each year.2,3The information collected includes
sociodemographic, clinical, and thera-peutic data and has expanded consider-ably over a period of years to cover.180
fields. In 2003, the US registry moved to PortCF, a Web-based portal, allowing entry of encounter-based clinical data. At that time, data for the Australian registry were collected annually but the registry has since moved toward more regular encounter-based data entry.
As well as allowing for longitudinal mon-itoring of each nation’s population and comparisons between treatment centers within each country, national registries also enable comparison of health statis-tics between countries. To date, however, few international comparisons have been
made. Such evaluations are potentially of great interest because they broaden the perspective on CF care and provide the opportunity to compare processes and outcomes across national boundaries, allowing CF clinicians and researchers to transcend local approaches and dis-cover best practices at an international level. Although the US and Australian registries are based on different tem-plates, similar health information is recorded in each registry, enabling the comparison of important measures such as weight, height, pulmonary func-tion, and respiratory tract microbiology.
One important aspect of practice that has differed historically between the 2 countries is newborn screening. New-born screening for CF was introduced in Australia in 19814 and was adopted
nationwide by 20035; at this time, it was
available in only 10 states in the United States and was further limited to only certain hospitals in several of these states.6 We surmised that any signifi
-cant differences in outcome measures between the 2 populations may at least be partly attributable to differences in newborn screening practices.
In this study, we examined the US and Australian CF registries to compare demographic characteristics, process measures reflecting clinical practice, and outcome measures between the 2 countries, limiting our analysis to pe-diatric patients.
METHODS
We used de-identified data from the 2003 US and Australian registries for patients aged#18 years on December 31, 2003. We selected this year because the 2003 dataset was the most com-plete in Australia at the time data were obtained (there was a slight decline in data submission for subsequent years due to a change to Web-based sub-mission). Also, as discussed here, these data provided the opportunity to exam-ine the effect of newborn screening on
outcome measures due to the differ-ence in newborn screening availability between the 2 countries before 2003. US and Australian patients were compared with regard to parameters common to both registries. Further details of which data were considered and prepared for comparison are provided in the Supple-mental Information. Ethical approval for the study was obtained from the US Cystic Fibrosis Foundation Patient Registry and the Australian Cystic Fibrosis Data Registry’s nominated institutional ethics committee.
Statistical Analysis
For health outcome parameters (height, weight, and lung function), we used absolute values then calculated height and weight percentiles for the Australian data using 2000 Centers for Disease Control and Prevention (CDC) reference equations7to facilitate comparison with
data held in the US registry. Similarly, lung function percent predicted was calculated using the reference equations of Knudson et al8to ensure consistency
between the registries. Although the best lung function for each quarter in the year had been recorded in the US reg-istry, the Australian registry recorded only the year’s best value so each US patient’s best lung function for the year was used for this analysis. Parameters were compared withx2tests for cate-gorical variables andttests for normally distributed continuous variables using SPSS 18 (SPSS Inc, Chicago, IL). Data with highly skewed distributions were cate-gorized and analyzed using x2 tests. Linear regression was used to evaluate the impact of confounding, effect
modi-fication, and explanatory variables on differences in mean forced expiratory volume in 1 second (FEV1) and body mass index (BMI). We constructed models to investigate the association between country and outcomes after adjusting for differences in age, gender, and genotype. We then investigated confounding by di-agnosis after newborn screening on the
constructed a third, limited model to investigate if the effect of diagnosis af-ter newborn screening on outcomes was modified according to country.
RESULTS
Demographic Characteristics and Mode of Diagnosis
The demographic data of the patients are shown in Table 1. The proportion male and proportion homozygous for the DF508 mutation were similar. Chil-dren in the Australian database were on average slightly younger and more likely to have been genotyped. The Australian patients were significantly more likely (65.8% vs 7.2%;P,.001) to have been diagnosed after newborn screening and therefore diagnosed at a younger age than their US counter-parts. US children were more likely to have been diagnosed due to respiratory symptoms (44.3% vs 14.1%;P,.001) or failure to thrive (40.9% vs 6.2%; P ,
.001). Children who had been diagnosed after newborn screening in Australia were on average older than US children who had been diagnosed with this method (8.2 vs 6.8 years;P,.001) due to the longer history of newborn screening in Australia. Those who had been diag-nosed clinically in Australia were also slightly older on average (10.9 vs 9.8 years;P,.001) in the 2003 registries. However, because a far greater pro-portion of children were diagnosed by newborn screening in Australia, and these children were generally younger than children diagnosed clinically, the mean age of children in the Australian registry was slightly lower (Table 1).
Process Measures and Treatment
Australian patients were more likely to have been reviewed as outpatients on
$4 occasions in the preceding year and were hospitalized more often (Table 2). FIGURE 1
When adjusted for FEV1 percent pre-dicted and pulmonary microbiology, Australian patients averaged 1.35 (95% confidence interval [CI]: 1.14–1.56) ad-ditional outpatient visits and 0.52 (95% CI: 0.42–0.62) additional hospitalizations per year (Supplemental Tables 6 and 7, respectively). A larger proportion of Australian children had no airway mi-crobiologic cultures recorded (26.2% vs 5.2%; P, .001), but there was no dif-ference in the proportion who had fre-quent (at least 3) cultures recorded (49.4% vs 46.9%; P = .09) (Table 2). Bronchoalveolar lavage was performed more often in Australian children com-pared with US children (9.2% vs 4.0%;
P , .001). Pseudomonas aeruginosa
andBurkholderia cepaciaspecies were identified in similar proportions of cul-tures. Stenotrophomonas maltophilia, Staphylococcus aureus, methicillin-resistant S aureus, and Haemophilus influenzae were identified more fre-quently in US children andAspergillus
species more frequently in Australian children. Significantly more US children were treated with pancreatic enzymes, dornase alfa, and supplemental feeding regimens. Of those homozygous for the DF508 mutation, 98.1% of US patients and 96.0% of Australian patients were treated with pancreatic enzymes, whereas significantly fewer children heterozygous for this mutation (89.9% vs 74.4%;P,.001) were treated with pancreatic enzymes in Australia.
Outcome Measures
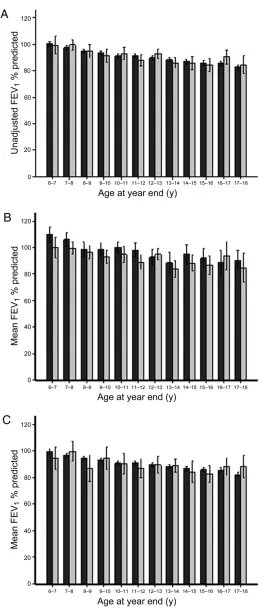
Unadjusted average height and weight percentile were both significantly greater in Australian patients whereas mean FEV1 percent predicted and BMI appeared similar in the 2 countries (Figures 1 and 2 and Table 1).
There remained no significant difference between the 2 countries in FEV1percent predicted when adjusted for age, gender, and DF508 genotype (Table 3). The impact of diagnosis after newborn screening FIGURE 2
Unadjusted FEV1percent predicted versus year-end age for patients with CF in the US (black bars) and Australian (grey bars) 2003 data registries for A, whole population, B, children diagnosed following newborn screening, and C, children diagnosed clinically with CF. Box and whiskers represent mean6 2 SE.
was explored in further detail. The ad-dition of newborn screening as a cova-riate to the model demonstrated that diagnosis after this procedure was a confounder on the association between country and FEV1(Table 4). Mean (95%
CI) FEV1 was greater by 5.3 (3.6–7.0) percent predicted in all patients di-agnosed after newborn screening. After adjustment for this mode of diagnosis, FEV1 percent predicted for children in Australia was lower than those in the
constructed a limited model in only those diagnosed after newborn screen-ing to investigate whether the effect of diagnosis by newborn screening on FEV1 percent predicted was modified ac-cording to country. This model showed that, on average, FEV1percent predicted was lower by 5.2 (95% CI: 2.8–7.6;P,
.001) percent predicted in Australian children diagnosed after newborn screening compared with their US coun-terparts (Table 5). Therefore, the advan-tage conferred by newborn screening seemed to be greater in the United States than in Australia. In summary, these models revealed that mean FEV1 was similar between the 2 countries but after adjustment for diagnosis after newborn screening, children in Australia had slightly lower lung function than chil-dren in the US. Furthermore, newborn screening seems to confer a greater advantage on lung function in US chil-dren than in Australian chilchil-dren.
Similar models were constructed to in-vestigate influences of country and newborn screening on BMI (Table 5, Supplemental Tables 8 and 9). On aver-age, children in Australia had signifi -cantly greater BMI after adjustment for age, gender, and genotype (Supplemental Table 8), but this difference was no lon-ger evident after adjusting for diagnosis after newborn screening (Supplemental Table 9). Children diagnosed after new-born screening demonstrated mean BMI 0.26 (95% CI: 0.09–0.43;P= .003) greater than children diagnosed clinically. The limited model (Table 5) revealed that there was no significant modifying effect of country (P= .97) on the benefit con-ferred by newborn screening on BMI.
DISCUSSION
We identified demographic differences and differences in process measures between US and Australian patients with CF. At a population level, we identified
Characteristic Australia (n= 1220)
United States (n= 12 994)
P
Male 633 (51.9) 6657 (51.2) .66
Age, mean6SD, y 9.365.1 9.665.0 .04
Genotype performed 1134 (96.8) 11 498 (88.5) ,.001 Homozygous for DF508 570 (50.7) 6029 (52.4) .27
No DF508 78 (6.9) 1328 (11.5) ,.001
Diagnosis age
,2 mo 757 (69.4) 4392 (33.8) ,.001
,6 mo 944 (86.6) 8151 (62.7) ,.001
,12 mo 971 (89.1) 9416 (72.5) ,.001
Diagnosis method
Newborn screening 786 (65.8) 932 (7.2) ,.001 Meconium ileus 184 (15.4) 3021 (23.2) ,.001 Respiratory symptoms 169 (14.1) 5758 (44.3) ,.001 Failure to thrive 74 (6.2) 5319 (40.9) ,.001 CDC height percentile, mean (SD) 41.0629.1 32.6626.9 ,.001 CDC weight percentile, mean (SD) 43.5628.8 36.1627.8 .028 BMI, mean6SD, kg/m2 17.462.8 17.563.1 .086 FEV1predicted, mean (SD) 90.7619.0 90.5621.1 .866
Values are given as number (%), unless otherwise noted. Percentages calculated from patients for whom data were recorded. More than 1 mode of diagnosis recorded for some patients.
TABLE 2 Process Measures and Therapy Use Recorded in the Australian and US CF Data Registries
Measure Australia United States P
Hospital admissions
No admissions in past year 575 (52.8) 8915 (68.6) ,.001 At least 1 admission in past year 280 (25.7) 2520 (19.4) ,.001 At least 2 admissions in past year 119 (10.9) 844 (6.5) ,.001 At least 3 admissions in past year 116 (10.6) 715 (5.5) ,.001 Outpatient visits
At least 3 outpatient visits in past year 901 (82.0) 10 712 (82.4) .70 At least 4 outpatient visits in past year 776 (70.6) 8072 (62.1) ,.001 Airway cultures
No culture recorded in past year 320 (26.2) 674 (5.2) ,.001 At least 3 cultures in past year 603 (49.4) 6094 (46.9) .09 Bronchoalveolar lavage in past year 113 (9.2) 493 (4.0) ,.001 Airway microbiologya
P aeruginosa 379 (42.8) 5517 (44.8) .26
B cepacia 20 (2.3) 214 (1.7) .26
S maltophilia 47 (5.3) 1442 (11.7) ,.001
S aureus 330 (37.3) 7163 (58.1) ,.001 Methicillin-resistantS aureus 18 (2.0) 1384 (11.2) ,.001
H influenzae 111 (12.5) 2754 (22.1) ,.001
Aspergillussp 199 (22.5) 1205 (9.8) ,.001 Use of therapies
Pancreatic enzymes 1022 (85.7) 12 118 (93.3) ,.001
Dornase alfa 273 (25.2) 7432 (57.6) ,.001
Supplemental feeding 190 (17.5) 6534 (50.2) ,.001
Values are given as number (%).
significantly better indices of nutritional status in Australia but similar lung function in the 2 countries. In evaluating possible explanations for this difference, we found that diagnosis by newborn screening was associated with signifi -cantly better lung function and BMI in both populations, and that our initial
findings were strongly influenced by differences in the proportion of patients in each region diagnosed after newborn screening.
The difference in a number of care processes between the 2 countries is interesting. It seems that more aggres-sive treatment of pulmonary exacer-bations was being delivered in Australia, a factor widely considered to contribute to better clinical outcomes.9,10 It is
dif-ficult to discern, however, whether the difference in admission rates may have been due to differences in thresholds for more intensive treatment, differences
in definitions of exacerbations between countries, or true differences in fre-quency and severity of exacerbations. Children in Australia were generally reviewed more frequently as outpatients and were hospitalized more often despite having fewer positive cultures for CF pathogens. Microbiologic cultures, how-ever, were undertaken far less frequently in Australia, which might at least partly explain the lower detected prevalence of several microorganisms in the airways.
Pancreatic enzymes were prescribed less frequently in Australia. It is unclear whether a greater proportion of milder gene mutations, which are associ-ated with pancreatic sufficiency, were detected as a consequence of newborn screening in Australia. Because only a limited number of specific mutations were recorded in the Australian regis-try, we were unable to assess this possibility further, but the fact that the
difference in enzyme use was mainly noted in DF508 heterozygotes rather than in homozygotes supports this possiblefinding. It is also possible that children were being undertreated with pancreatic enzymes in Australia. The lower rate of dornase alfa use in Australia is likely to be due to strict qualification criteria for government subsidization of this expensive medication, which in 2003 limited ongoing use to those who had demonstrated an improvement in FEV1of at least 10% within a month of initiating treatment.11
Our finding that newborn screening seems to have a less advantageous effect on lung function in Australian children compared with US children is puzzling, and its explanation is likely to be complex. For example, there may have been underlying unmeasured differences in genetic modifiers, envi-ronmental factors, and socioeconomic status.12It is also possible that certain
aspects of early CF care may be less aggressive in Australia. Although more outpatient visits and hospitalizations were noted in Australia overall, there may be more visits related to illness in the United States or hospitalizations might be more prolonged; these con-siderations could not be compared in our analysis. There may also be less aggressive use of chronic therapies in Australia, as exemplified by the less frequent use of dornase alfa. Finally, it is possible that adjustment for new-born screening biases the US data somewhat, in view of the limited num-ber of US states that performed screening of infants for CF before 2003. There may have been unrecorded characteristics of the patients or their care in these states independent of newborn screening contributing to im-proved outcomes. For example, states that adopted newborn screening earlier may also have been more proactive with the provision of other social services that could improve outcomes or centers
TABLE 3 Association Between Country and FEV1Percent Predicted After Adjusting for Differences in Gender, Age, and Genotype
Variable b(95% CI) P
Constant 106.54 (103.80–109.27) ,.001
Age at year end, y 21.31 (–1.44 to–1.18) ,.001
Gender (female) 0.26 (–0.61 to 1.13) .557
Homozygous for DF508 20.40 (–1.27 to 0.47) .361 Country (Australia) 0.21 (–1.41 to 1.82) .802
TABLE 4 Association Between Country and FEV1Percent Predicted After Adjusting for Differences in Gender, Age, Genotype, and Diagnosis After Newborn Screening
Variable b(95% CI) P
Constant 109.00 (106.16–111.84) ,.001
Age at year end, y 21.28 (–1.40 to–1.15) ,.001
Gender (female) 0.26 (–0.60 to 1.13) .55
Homozygous for DF508 20.44 (–1.31 to 0.42) .32 Country (Australia) 22.91 (–4.81 to–1.02) .003 Diagnosis by newborn screening 5.33 (3.62–7.03) ,.001
TABLE 5 Limited Model Exploring Effect of Country on FEV1Percent Predicted and BMI in Children Diagnosed With CF After Newborn Screening, After Adjustment for Differences in Gender, Age, and Genotype
Variable FEV1Percent Predicted BMI
b(95% CI) P b(95% CI) P
Constant 116.42 (109.74–123.1) ,.001 14.88 (14.31–15.44) ,.001 Gender (female) 2.13 (–0.28 to 4.54) .084 20.06 (–0.29 to 0.17) .619 Age at year end (years) 21.48 (–1.84 to–1.11) ,.001 0.30 (0.27–0.32) ,.001 Homozygous for DF508 1.22 (–1.19 to 3.64) .320 20.28 (–0.51 to–0.04) .019 Country (Australia) 25.21 (–7.62 to–2.80) ,.001 0.05 (–0.23 to 0.24) .967
outcomes. Because overall health care provision to the general population in Australia may be better than in the United States, as illustrated by lower infant mortality and longer lifespans for the non-CF population in Australia,13
the greater advantage of newborn screening in the United States is likely to be due to differences that are spe-cific to CF.
Previous analyses of data from the US and Canadian registries have provided important information about the epi-demiology and management of CF that has contributed to a better under-standing of predictors of disease out-come and therapeutic approaches to modify it. For example, these registry analyses have shown that demographic indicators, genotype,14 and
socioeco-nomic status15,16 are associated with
important clinical outcomes, as are mi-crobiology17 and clinical management
approaches.8,9 Few other international
data comparisons, however, have been undertaken. One study used published registry reports to compare outcomes between the UK, US, French, and Aus-tralasian registries.18A recent
compari-son of demographic characteristics between European Union and non– European Union countries identified a lower proportion of patients with CF in non–European Union countries, presum-ably as a consequence of underdiagnosis or premature childhood mortality.19,20
This present study takes these com-parisons a step further by using de-identified individual patient data to compare specific disease outcomes and some potential explanatory factors.
In the course of making these com-parisons between 2 national databases,
data are housed in different software portals with reasonable, but still lim-ited, standardization of data. There are systematic differences in data capture that render data comparisons difficult and time-consuming, and future com-parisons would benefit from using common portals and parameters. Some global oversight is required for such an initiative, commencing with an effort to standardize data collection.18,21
Although there seems to have been some improvement recently, recom-mendations for urgent standardization of data collection have been published previously,18and a proposal for an
in-ternational CF data resource Web site is being developed.22Adequate funding
is also essential to maximize data col-lection, input handling, and maintenance of registries. Second, the respective databases are incomplete with esti-mates that details of∼5% to 10% of all patients in the 2 regions are not recorded in the registries. Third, it is clear that the databases contain errors and improbable outliers so significant and time-consuming data cleansing is required before conducting formal comparisons. Finally, the registries are not comparable with regard to certain demographic variables such as race and socioeconomic status and logistic factors such as availability of treat-ments, which would allow a fully valid and case mix2adjusted comparison of treatments and disease outcomes. Nevertheless, we believe our findings are useful as a first step, opening the discussion of international comparisons and potentially facilitating improvement of treatment and outcomes for patients with CF.
agement approaches between coun-tries that might correlate with disease outcomes. For example, mandatory CF newborn screening, which was nation-wide in Australia but had only been adopted by 10 states in the United States in 2003, is now universal in the United States as well. Conversely, Australia has already seen a trend toward much more aggressive evaluation and management of infants diagnosed after newborn screen-ing.23These factors, as well as others that
have evolved over recent years, are likely to yield further differences in outcomes between the 2 countries.
Thus, there appear to be benefits as-sociated with newborn screening for CF at a population level, but significant differences between countries in health outcome measures exist. We confirm that international comparisons of data from national CF registries are feasible and have identified important differences in demographic characteristics, process measures, and clinical outcomes recor-ded in these databases. Efforts should be made to accelerate international com-patibility of CF data registries to facilitate ongoing comparisons.
ACKNOWLEDGMENTS
The authors are grateful to Geoff Sims for providing advice regarding the Austra-lian Cystic Fibrosis Data Registry, Profes-sor Jenny Peat for assistance with initial statistical analysis, Monica Brooks and Bruce Marshall of the Cystic Fibrosis Foundation and the Cystic Fibrosis Foun-dation Patient Registry Committee for providing the CF Foundation Registry Data. We also appreciate the comments of the journal reviewers, which greatly improved the manuscript.
REFERENCES
1. Davies JC, Alton EWFW and Bush A. Cystic
Fibrosis.BMJ. 2007;335:1255–1259
2. Cystic Fibrosis Foundation Patient Registry
Annual Data Report 2009. Cystic Fibrosis
Foundation 2011. Available at: www.cff.org/
PatientRegistry/. Accessed February 4, 2011
3. Australian Cystic Fibrosis Data Registry. Cystic Fibrosis in Australia: Annual Report of the Australian Cystic Fibrosis Data Registry 2009. North Ryde, New South Wales, Australia: Cystic Fibrosis Australia; 2011
4. Wilcken B, Brown AR, Urwin R, Brown DA. Cystic fibrosis screening by dried blood spot trypsin assay: results in 75,000 new-born infants.J Pediatr. 1983;102(3):383–387
5. Massie J, Clements B; Australian Paediatric Respiratory Group. Diagnosis of cysticfi -brosis after newborn screening: the Aus-tralasian experience—twenty years and five million babies later: a consensus statement from the Australasian Paediatric Respiratory Group.Pediatr Pulmonol. 2005; 39(5):440–446
6. Grosse SD, Boyle CA, Botkin JR, et al; CDC. Newborn screening for cystic fibrosis: evaluation of benefits and risks and rec-ommendations for state newborn screen-ing programs. MMWR Recomm Rep. 2004; 53(RR-13):1–36
7. Kuczmarski RJ, Ogden CL, Grummer-Strawn LM, et al. CDC growth charts: United States. Adv Data. 2000;(314):1–27
8. Knudson RJ, Lebowitz MD, Holberg CJ, Burrows B. Changes in the normal maximal expiratoryflow-volume curve with growth and aging.Am Rev Respir Dis. 1983;127(6): 725–734
9. Padman R, McColley SA, Miller DP, et al; Investigators and Coordinators of the
Epidemiologic Study of Cystic Fibrosis. In-fant care patterns at epidemiologic study of cystic fibrosis sites that achieve supe-rior childhood lung function. Pediatrics. 2007;119(3). Available at: www.pediatrics. org/cgi/content/full/119/3/e531
10. Johnson C, Butler SM, Konstan MW, Morgan W, Wohl ME. Factors influencing outcomes in cysticfibrosis: a center-based analysis. Chest. 2003;123(1):20–27
11. Australian Government Department of Health and Ageing Pharmaceutical Benefits Scheme. Available at: www.pbs.gov.au/ medicine/item/5704F-6120D. Accessed De-cember 21, 2011
12. Schechter MS. Non-genetic influences on cystic fibrosis lung disease: the role of sociodemographic characteristics, environ-mental exposures, and healthcare interven-tions.Semin Respir Crit Care Med. 2003;24 (6):639–652
13. United Nations Demographic and Social Statistics. Available at: http://unstats.un.org/ unsd/demographic/products/socind/health. htm
14. McKone EF, Goss CH, Aitken ML. CFTR ge-notype as a predictor of prognosis in cystic fibrosis.Chest. 2006;130(5):1441–1447 15. Schechter MS, Shelton BJ, Margolis PA,
Fitzsimmons SC. The association of socio-economic status with outcomes in cysticfi -brosis patients in the United States.Am J Respir Crit Care Med. 2001;163(6):1331–1337
16. O’Connor GT, Quinton HB, Kneeland T, et al. Median household income and mortality rate in cysticfibrosis.Pediatrics. 2003;111
(4 pt 1). Available at: www.pediatrics.org/ cgi/content/full/111/4/SE1/e333
17. Emerson J, Rosenfeld M, McNamara S, Ramsey B, Gibson RL. Pseudomonas aeruginosa and other predictors of mortality and morbidity in young children with cystic fibrosis.Pediatr Pulmonol. 2002;34(2):91–100
18. McCormick J, Sims EJ, Green MW, Mehta G, Culross F, Mehta A. Comparative analysis of Cystic Fibrosis Registry data from the UK with USA, France and Australasia. J Cyst Fibros. 2005;4(2):115–122
19. McCormick J, Mehta G, Olesen HV, Viviani L, Macek M, Jr;Mehta A European Registry Working Group. Comparative demographics of the European cysticfibrosis population: a cross-sectional database analysis.Lancet. 2010;375(9719):1007–1013
20. Mehta G, Jr;Macek M, Jr;Mehta A European Registry Working Group. Cystic fibrosis across Europe: EuroCareCF analysis of de-mographic data from 35 countries.J Cyst Fibros. 2010;9(suppl 2):S5–S21
21. Stern M, Lindblad A, Viviani L, Ravilly S, Olesen H. ECFS Registry Definition Consensus Meeting—Århus 2007. Available at: www.ecfs. eu/files/webfm/webfiles/File/ecfs_registry/ ecfs_registry_definition_consensus_meeting. pdf. Accessed December 21, 2011
22. Sims G. International benchmarking from centre-level cystic fibrosis data. Pediatr Pulmonol. 2010;45(S33):410
23. Brennan S, Gangell C, Wainwright C, Sly PD. Disease surveillance using bronchoalveo-lar lavage.Paediatr Respir Rev. 2008;9(3): 151–159
DOI: 10.1542/peds.2011-0567 originally published online January 16, 2012;
2012;129;e348
Pediatrics
Sarath Ranganathan
Services
Updated Information &
http://pediatrics.aappublications.org/content/129/2/e348 including high resolution figures, can be found at:
References
http://pediatrics.aappublications.org/content/129/2/e348#BIBL This article cites 17 articles, 1 of which you can access for free at:
Subspecialty Collections
http://www.aappublications.org/cgi/collection/respiratory_tract_sub Respiratory Tract
http://www.aappublications.org/cgi/collection/pulmonology_sub Pulmonology
following collection(s):
This article, along with others on similar topics, appears in the
Permissions & Licensing
http://www.aappublications.org/site/misc/Permissions.xhtml in its entirety can be found online at:
Information about reproducing this article in parts (figures, tables) or
Reprints
DOI: 10.1542/peds.2011-0567 originally published online January 16, 2012;
2012;129;e348
Pediatrics
Sarath Ranganathan
Bradley Martin, Michael S. Schechter, Adam Jaffe, Peter Cooper, Scott C. Bell and
Newborn Screening
Comparison of the US and Australian Cystic Fibrosis Registries: The Impact of
http://pediatrics.aappublications.org/content/129/2/e348
located on the World Wide Web at:
The online version of this article, along with updated information and services, is
http://pediatrics.aappublications.org/content/suppl/2012/01/25/peds.2011-0567.DCSupplemental Data Supplement at:
by the American Academy of Pediatrics. All rights reserved. Print ISSN: 1073-0397.