Experimental Investigation of Gas Flow Rate
Effect on Mild Steel Plates for Weld Porosity
Prevention at GTAW Process using Interactive
Factor Plots
Omoyibo – Kingsley, Queeneth .A.#1 , Osarenmwinda .J.O. .#2
Ph.D Student in the Production Engineering Department #1
University of Benin (UNIBEN), P.M.B. 1154, Benin City, Edo State, Nigeria.
Professor of Manufacturing Engineering #2
Department of Production Engineering, Faculty of Engineering University of Benin (UNIBEN), Benin City, Edo State, Nigeria
ABSTRACT
The optimization of gas flow rate , using Models, was used to obtain optimized values of other input process parameters for preventing porosity defect at Gas Tungsten Arc Welding (GTAW) process. Interactive factor plots (IFP) were used to show the main effects of importance and interactive effect that affect the model most with a reference line drawn on the interaction plot indicating any effect that exceeds the line as a potential important effect to the model. Interactions occur when the level of a factor is dependent on the effect of a factor. using equations to obtain values of percentage dilution (%D), the values were greatly impacted by the interaction of gas flow rate which has been cross referenced by standard error and produced optimal outcome .In this study, Gas flow rate was dependent upon percentage dilution (solidification rate) of a weld pool, Gas flow rate protects the weld pool from contamination which can cause porosity in welds,Hence,this study is aimed at optimizing gas flow rate in order to establish a correct shielding gas flow rate that will be designed to provide the most efficient gas coverage and prevent gas wastage and in turn improve weld quality and prevent porosity. Interactive Factor Plots (IFP)of gas flow rate and the main effects of gas flow rate,, showed the optimum values of gas flow rate to be 16 lit/min at a minimized percentage dilution value of 45.95% which was established in this study.
Key words – Gas Tungsten Arc welding (GTAW), Gas flow rate (F), porosity defect, percentage dilution (%D) interactive factor plots (IFP).
1. INTRODUCTION
Porosity defect in welds appear due to gas pocket presence in the welded base metal, which results in small holes in the welded joint produced and this
could lead to design failure and weld rejection after visually inspecting the welds produced. Porosity welds do not meet standards in non destructive testing (NDT) exercises. To achieve a porosity free welded joint, a percentage dilution quantity that is defined, that will provide sufficient dilution for a controlled solidification of molten metal during welding operation, is required.
Arc welding process like GTAW offers a wide spectrum for steady gas flow, protects the weld pool from contamination that may lead to porosity defect, produces a good arc start, good control of bead contour and produces a good weld penetration area. Some of the root causes of weld porosity are, ineffective weld pool, gas escape during welding and drastic increases in speed due to a super rapid cooling rate. There is a need to optimize the gas flow rate in a systematic way in order to achieve the response: percentage dilution (%D), by using the interactive factor plot model to determine the performance measures. Hence, the basis for this research.
2. EXPERIMENTAL DETAILS
Data was efficiently analyzed using the interactive factor plots and conclusions were meaningfully drawn from the analysis. The aim of the analyses is to show the statistical significance of a main effect (Gas flow rate) on the response (percentage dilution) of interest and the optimum setting for the different factors that affect the response was also determined.
3. MAIN EFFECT (GAS FLOW RATE)
horizontally, indicated that there is no presence of main effect. In the same way, each level of the factor affects the response (percentage dilution), hence the mean level of the response (percentage dilution) is the same with all the factor levels. When the line is not drawn horizontally, then, the main effect is present, indicating that different levels of the factor (Gas flow rate) affect the response (percentage dilution). The magnitude of the main effect is great when the slope is steep. 4. INTERACTION EFFECTS
Interactions between gas flow rate and other factors showed the factor, gas flow rate, is at different levels of interaction with other factors and the effect of one factor is different from the effect of the other. A first order is an interaction with two factors (gas flow rate and any other factor)
5. MATERIALS
The material used is a 10mm thick mild steel plate (low carbon) measuring 150mm by 100mm by 10mm as shown in figure 1.
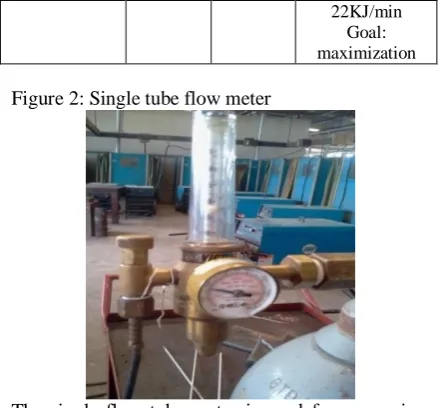
A single flow tube meter attached to a 100% argon shielding gas cylinder was used to record the gas flow rate( F) and records were taken as shown in Table 1.
Figure 1: Mild steel plates
6 . EXPERIMENTAL PROCEDURE
The experiment was carried out with four factors at two levels each as presented in Table 1.
TABLE 1: FACTORS (INPUT PROCESS PARAMETERS) AND THEIR LEVELS
S/n Input process
parameters
Unit Symbol Levels
1 A –welding
current
Amp I 130 190
2 B –welding
voltage
Volts V 15 19
3 C –welding
speed
mm/min S 80 120
4 D –shielding
gas flow rate
Lit/min F 14 18
TABLE 2: RESPONSES
Responses Unit Symbol Range
Percentage dilution
% %D 40% - 47%
Goal: minimization
Heat Input KJ/min H.I.R 18KJ/min –
22KJ/min Goal: maximization
Figure 2: Single tube flow meter
The single flow tube meter is used for measuring the gas flow rate. A 100% Argon gas, is the shielding gas used to protect the weld pool from contamination from air which can lead to the presence of gas pockets in the welds and this leads to weld porosity. The profile projector was used to trace and record the weld bead profile such as reinforcement area and weld penetration area. Planimeter readings recorded the weld penetration area as well as the reinforcement area. Percentage dilution results for reinforcement area were measurements taken from the profile projector and the digital planimeter readings were recorded as presented in Table 3.
TABLE 3: REINFORCEMENT,
PERCENTAGE DILUTION AND WELD PENETRATION AREA
s/n Reinforcement
area (RA) (mm2)
Weld penetration
area (WPA)
(mm2)
Total weldment
area (TWA)
(mm2)
Percentage dilution (%D)(calculated)
1 24.75 20.85 45.60 45.70
2 25.00 21.40 46.40 46.09
3 24.03 20.57 46.60 46.08
4 25.40 21.19 46.00 44.93
5 24.40 20.48 44.40 46.08
6 23.65 20.34 44.20 46.06
7 26.51 22.59 49.10 46.03
8 27.95 20.45 44.40 46.04
9 24.55 20.54 45.00 45.66
10 24.80 21.60 45.80 45.86
11 25.33 21.64 47.00 45.00
12 25.25 20.65 45.90 44.95
13 23.92 20.38 44.30 45.99
14 24.05 20.35 44.40 45.81
15 26.60 21.70 48.30 44.91
16 23.29 20.51 44.80 45.88
100
%
%
2 22
mm
WP
mm
R
mm
WP
D
A A
A
(1) Where : WPA = weld penetration area
(mm2)
RA = Reinforcement area (mm2) TWA = RA + WPA =
[Reinforcement area + weld penetration area] (2)
7. PRESENTATION OF RESULTS,DISCUSSIONS AND FINDINGS.
TABLE 4: ANALYSIS OF VARIANCE
(ANOVA) FOR PERCENTAGE
DILUTION (%D)
Input Process parameters
Des igna tion
d f
Adj SS Adj MS
F-value
P-value
Welding current
I 1 3.1863 3.1863 29.57 0
Welding voltage
V 1 0.0839 0.0839 0.78 0.392
Welding speed
S 1 0.0995 0.0995 0.92 0.353
Gas flow
rate
F 1 0.0756 0.0756 0.7 0.416
2
way/interac tion
Welding current *welding voltage
IV 1 0.0005 0.0005 0 0.947
Welding current *welding speed
IS 1 0.0651 0.0651 0.6 0.45
Welding current
*gas flow
rate
IF 1 0.1038 0.1038 0.96 *0.343
Welding voltage *welding speed
VS 1 0.6211 0.6211 5.76 0.031
Welding voltage
*gas flow
rate
VF 1 0.0078 0.0078 0.07 0.791
Welding speed * gas flow rate
SF 1 0.2715 0.2715 2.52 *0.135
Error 1
0
1.5085 0.1077
Pure error 0.1714 0.0343
Lack of fit 1.3370 0.1485 4.33 0.061
Total 6.4740 -
R-Sq = 86. 70 %
Table 4, shows that percentage dilution have more influence on porosity and gas flow rate interactions
i.e: Current and gas flow rate( IF), voltage and gas flow rate(VF), Speed and gas flow rate (SF) and Current and gas flow rate(IF) displayed significant factor values for Adj SS of 0.1038, 0.0078, 0.2715 and 0.0756 respectively. The values of Adj SS were same with that of values of Adj MS. The F-values are larger than the F-values. The smallest P-value or the significant factor which is current gives a more significant effect on the response parameter, dilution. The P-value of 0.135 for interaction between gas flow rate and speed (SF), and the P-value of 0.343 for the interaction between current and gas flow rate (IF) are significant and they affect percentage dilution greatly.
This research claims that, percentage dilution strongly depends on the gas flow rate and can be controlled with a correct shielding gas flow rate that can provide on efficient gas coverage devoid of gas wastage at a Gas Tungsten Arc Welding (GTAW) process.
Determination of main and interaction for Percentage Dilution (%D) (%)
The plot of current versus percentage dilution as presented in fig 3, shows the effect of medium current on percentage dilution. Percentage dilution is minimized with medium current. It is minimized when current is at medium level with a value of 160amp and optimal parameter settings that will yield minimum percentage dilution is achieved at a medium current.
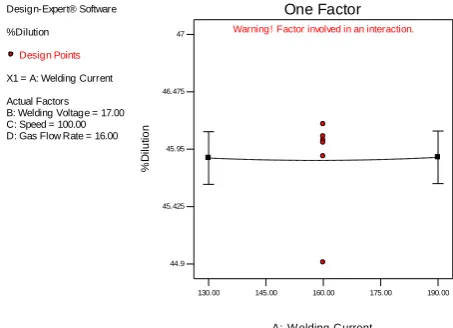
Fig. 3: Effects of Current Vs Percentage Dilution The plot of gas flow rate versus percentage dilution as presented in fig 4, shows the effect of medium gas flow rate on percentage dilution. Percentage dilution is minimized with a high gas flow rate value of 16lit/min and optimal parameter settings that will yield minimum percentage dilution is achieved at a high gas flow rate.
Design-Expert® Software
%Dilution
Design Points
X1 = A: Welding Current
Actual Factors B: Welding Voltage = 17.00 C: Speed = 100.00 D: Gas Flow Rate = 16.00
130.00 145.00 160.00 175.00 190.00 44.9
45.425 45.95 46.475 47
A: W elding Current
%
D
il
u
ti
o
n
One Factor
Fig. 4: Effects of gas flow rate Vs Percentage Dilution.
Effects of voltage and speed Vs percentage dilution yielded a minimized optimal value of percentage dilution of 45.67% with a high gas flow rate of 16lit/min and a current of 160amperes.
The effect of welding voltage on percentage dilution (%D) depends on the level of speed, represented by two lines on the graph. On the lower line, there is no overlap in the Interactive factor plot (IFP) bars at left versus right indicating a low speed. On the top line on the graph where speed is set at its highest level (+C), the IFP bars overlap indicating that the effect of voltage is significant. medium voltage and low speed results in a value of 45.9% for percentage dilution. Therefore, for a multi response optimization for the weld percentage dilution, the best settings are medium speed, medium voltage.
Fig 5: Effects of voltage and speed (VS) Vs Percentage Dilution
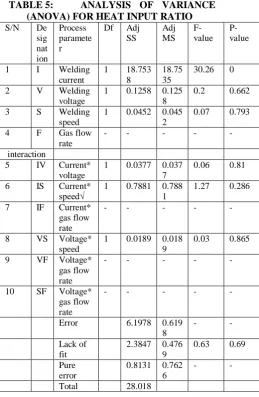
TABLE 5: ANALYSIS OF VARIANCE (ANOVA) FOR HEAT INPUT RATIO
S/N De
sig nat ion
Process paramete r
Df Adj
SS
Adj MS
F-value
P-value
1 I Welding
current
1 18.753
8
18.75 35
30.26 0
2 V Welding
voltage
1 0.1258 0.125
8
0.2 0.662
3 S Welding
speed
1 0.0452 0.045
2
0.07 0.793
4 F Gas flow
rate
- - - - -
interaction
5 IV Current*
voltage
1 0.0377 0.037
7
0.06 0.81
6 IS Current*
speed√
1 0.7881 0.788
1
1.27 0.286
7 IF Current*
gas flow rate
- - - - -
8 VS Voltage*
speed
1 0.0189 0.018
9
0.03 0.865
9 VF Voltage*
gas flow rate
- - - - -
10 SF Voltage*
gas flow rate
- - - - -
Error 6.1978 0.619
8
- -
Lack of fit
2.3847 0.476
9
0.63 0.69
Pure error
0.8131 0.762
6
- -
Total 28.018
From Table 5, the smallest P-value of Zero ( 0 ) for current, indicates that current has the most significant effect on heat input with voltage, as both voltage and current are directly proportional to heat input ratio. As current and voltage increases, heat input ratio increases as well as, an increase in Heat Input decreases the welding speed.The other factor such as gas flow is insignificant.
Determination of main and interactive effect of H.IR
The Interactive Factor (IFP) plot of current versus heat input ratio as presented in fig 6 , shows the effect of high current on heat input ratio. Heat input ratio increase with increase in current. H.I.R. is maximum when current is at a high level and optimal parameter settings that will yield maximum heat input ratio (HIR) is achieved at a high current.
Design-Expert® Software
%Dilution
Design Points
X1 = D: Gas Flow Rate
Actual Factors A: Welding Current = 160.00 B: Welding Voltage = 17.00 C: Speed = 100.00
14.00 15.00 16.00 17.00 18.00
44.9 45.425 45.95 46.475 47
D: Gas Flow Rate
%
D
il
u
ti
o
n
One Factor
Warning! Factor involved in an interaction.
Design-Expert® Software
%Dilution
Design Points
C- 80.000 C+ 120.000
X1 = B: Welding Voltage X2 = C: Speed
Actual Factors A: Welding Current = 160.00 D: Gas Flow Rate = 16.00
C: Speed
15.00 16.00 17.00 18.00 19.00
Interaction
B: W elding Voltage
%
D
il
u
ti
o
n
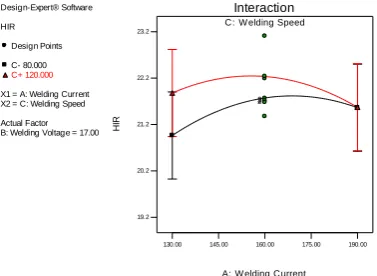
Fig. 6: Effects of current Vs Heat Input Ratio Effects of current and speed on heat input ratio: Heat input is significant when speed is low at a value of 80mm/min, current is high at a value of 189amperes with a voltage of 17volts. Hence, current is inversely proportional to speed.
Fig 7: Effects of Current and Speed (IS) Vs Heat Input Ratio
TABLE 6: FACTORS WITH OPTIMUM LEVELS FOR PERCENTAGE (%D) DILUTION AND HEAT INPUT RATIO (H.I.R)
Process parameter
Optimum value for
%D
Optimum value for H.I.R
Optimum level for
% D
Optimum level for H.I.R
Welding current (Ampere)
45.94% 21.2kJ/min High
current
High current Welding voltage
(volts)
45.71% 21.9KJ/min Medium
voltage
Medium Voltage Welding speed
(mm/min)
45.95% 21.5KJ/min Medium
speed
Low speed
Gas flow rate (Lit/min)
45.95% 21.5KJ/min High gas
flow rate
High gas flow rate
Optimal value for %D 45.98%
Optimal value for HIR 21.53KJ/min Optimal value for Gas flow rate 16lit/min .
8. CONCLUSIONS
1. The optimum condition for percentage dilution and gas flow rate is shown in table 6
2. The optimal condition for gas flow rate for a porosity – free weld is 16lit/min, current is 160 Amp, voltage is 17volts and speed is 100 mm/min
3. The main effect of importance is the gas flow rate and the interactive effect that affect the model the most ,is speed and gas flow rate(SF).
4. For percentage dilution, gas flow rate and speed are the most significant factors with a low P-value of 0.135.
5. Interactive Factor Plot (IFP) method of optimization is suitable to optimize the gas flow rate and the percentage dilution as adopted in the present study.
6. Gas Flow rate not too high, speed at a medium quantity, increased current and a medium quantity of voltage ,will reduce gas wastage at a GTAW process and eradicate porosity in the welds produced..
7. Porosity defect is eliminated in the weld produced with optimized parameter setting of Current I = 160Amperes
Voltage V = 17volts Speed S = 100mm/min Gas flow rate F = 16 lit/min .
8. Percentage dilution optimal value is 45.9% and heat input ratio optimal value is 21.53kJ/min.
9. CONTRIBUTION TO KNOWLEDGE
1. A New Model has been developed. 2. A defined optimal value of 45.9 % of
percentage dilution to be used at a GTAW process to prevent weld porosity. has been established.
3. A defined optimal value of 21.5 kJ/min for Heat Input ratio to be used at a gas tungsten arc welding process to prevent weld porosity , has been established.
4. A data bank for the welding industry has been created for the optimal values to be used at a GTAW process for :gas flow rate 16 lit /min , welding current 160 amperes ,welding speed 100 mm/min and welding voltage value of 17 volts.
5. Weld porosity is eliminated visiting the Data bank of this research.
10. ACKNOWLEDGEMENT
This is to first and foremost acknowledge my university, The university of Benin ,UNIBEN ,Benin city, Edo state Nigeria, for creating this research plat form for me. I Thank the Management of Petroleum Training Institute (PTI)
Design-Expert® Software
HIR
Design Points
X1 = A: Welding Current
Actual Factors B: Welding Voltage = 17.00 C: Welding Speed = 100.00
130.00 145.00 160.00 175.00 190.00 19.2
20.2 21.2 22.2 23.2
A: W elding Current
H
IR
One Factor
Warning! Factor involved in an interaction.
3 2 2
Design-Expert® Software
HIR
Design Points
C- 80.000
C+ 120.000
X1 = A: Welding Current X2 = C: Welding Speed
Actual Factor B: Welding Voltage = 17.00
C: W elding Speed
130.00 145.00 160.00 175.00 190.00
Interaction
A: W elding Current
H
IR
19.2 20.2 21.2 22.2 23.2
for allowing me to use the GTAW Equipments in the hot shop of the Institute. To my supervisors: Prof J.I. Achebo and Prof J.O.Osarenmwinda, I say Thank you and to my Husband, for financially equipping me ,GOD bless you sir and to all PhD students in the field of welding, Hard work pays.
11. REFERENCES
[1]. Kaladhar .M. , Subbaiah .V. and Rao K.N. (2010)
Optimization of process parameters in turning of
AISI 202 Austenitic stainless steel. ARPN.
International Journal of Engineering and Applied Sciences 5(9): 79 – 87
[2]. Dinesh Kumar Shukla et al (2012) Dilution control
by Advanced submerged Arc welding (SAW) ISSN: 1662 – 8985 488(1): pp 1737 – 1741(c) Trans tech publication Switzerland.
[3]. Mereno, Preto., welding defects (1st edition),
Alaince ISBN 978 – 88 – 548 – 5854 – 1 (2013)
[4]. Nagesh. D.S., and Datta G.L. (2010) Genetic
Algorithm for optimization of welding variables for height to width ratio and application of ANN for prediction of bead geometry for TIG welding
process. Applied Soft Computing Journal 10 (3):
897 – 907
[5]. Sudhakaran R. et al (2011) Effect of welding process
parameters on weld bead geometry and optimization of process parameters to maximize depth to width ratio for stainless steel gas tungsten Arc welded
plates using genetic algorithm “European Journal of
Scientific Research 62 (1): 76 – 94
[6]. Dhas .E. R and Kumanan .S. (2011) Optimization of
parameters of submerged arc weld using non
conventional techniques Applied Soft Computing
Journal, 2(8):5198 – 5204
[7]. Sreeraj .P. and Kannan, T. (2012) modeling and
prediction of stainless steel clad bead geometry deposited by GMAW using regression and artificial
neural network models. Advances in Mechanical
Engineering, vol. 2012 article ID 2373 79, 12 pages.
[8]. Chandel R.S., Cheong F. L et al., Effect of increasing
deposition rate on the bead geometry of submerged
arc welds. Journal of materials processing
technology, 72 (1): 124 – 128.
First author – Omoyibo – Kingsley, Queeneth was born 5th of July and is a member of the Nigeria society of Engineers (MNSE) 2016 and a registered member of the council for the regulation of Engineering practices in Nigeria (COREN). she earned her undergraduate degree (B.Eng) in Petroleum Engineering in 2006 from the University of Benin, UNIBEN, Benin City, Edo State, Nigeria. She has a post graduate Masters degree (M.Eng) in Industrial Engineering from the Department of Production Engineering from the same University in 2012. She is a doctoral student (PhD), in the Department of Production Engineering (Industrial Engineering option) for
2014/2015 session till date, as @2017 from the same University. Her research interest are in the areas of Production Engineering with specific interest in metal joining process, weld parameter optimization, defects avoidance, weld quality enhancement, Gas wastage reduction/eradication, scheduling and Engineering mathematics.
Second author – Prof. J.O. Osarenmwinda is currently working as a professor and a lecturer. He is my PhD co-supervisor and a professor of Manufacturing Engineering, in the Department of Production Engineering, University of Benin, ( UNIBEN) Benin City, Edo state Nigeria. He has widely published research papers in conferences National/International journals as well as in local journals.