DOI: 10.14738/abr.73.2.6360.
Uruakpa, P. C. (2019). Insurance Premium And Economic Performance In Nigeria: A Variance Decomposition Approach. Archives of Business Research, 7(SP), 16-33.
Insurance Premium And Economic Performance In Nigeria: A
Variance Decomposition Approach
Peter C. Uruakpa
Department of Banking & Finance, Abia State University, Uturu, Nigeria
ABSTRACT
This study assessed insurance premium and Nigeria’s economic performance. It aimed at finding out the relationship insurance premium, investment and assets have with Nigeria’s GDP. Descriptive statistics, Augmented Dickey Fuller Unit Root Test, Johansen cointegration, OLS regression, variance decomposition and granger causality tests were adopted. Findings revealed that all the series are significant and but not normally distributed. The correlation matrix shows that there is high and positive correlation between the independent variables. The results of the unit root tests using Augmented Dickey-Fuller test show that all the variables do not have unit roots (that is, are stationary) at 5% in their first differences. The Johansen co-integration result confirms that there is long run relationship between insurance activities and economic growth in Nigeria. The OLS result suggests that 93.11 percent of the total variation found in GDP is explained by the presence of total assets, investments and premium of the insurance industry sector while the F-Statistics has a value of 163.1080 which is highly significant at 5% confidence level implying that insurance industry play significant role in development of the Nigerian economy. The Variance Decomposition for 10 period indicates that Insurance sector investment is more significant than premium for most of the periods. However, since premium represents revenue for the insurance industry it has positive impact on GDP for all the periods while GDP responds positively. This granger causality result shows that there is granger causality relationship between insurance premium, investment and assets have granger causality with GDP. From the findings, it recommends that insurance business authorities should review its reform policy and ensure that policies that will strengthen premium mobilization in Nigeria are put in place. Insurance companies need to invest more of their funds in productive sectors of the economy.
Keywords: Insurance, Insurance premium, Risk, GDP, Investment
INTRODUCTION
Augustine and Nwanneka, 2011; Gollier, 2003). This group, known as insurance company, must increase its hold on the premium and widen its profit margin to cope with the demand of their customer. Insurance premium is the fixed amount of money paid by the insured to the insurance company regularly. Insurance company collects premium to provide security for the purpose.
It has been argued by Pandey (2003) that while the main sources of working capital for commercial banks remain customer deposits and the major outlet is loans and advances, Solomon (2018) suggested that the main source of working capital for insurance companies is premium and major outlet is investment of such premium in long term investments. Insurance companies are the second biggest financial institutions in the mobilization of savings after banking institutions. The savings they mobilize through premium are invested in various financial instruments and businesses to make returns which are then used to compensate the insured’s loss when it arises. Insurance companies are the basic components of financial institution, which encourages and mobilizes savings and channel savings into productive investment because of their numerous offices. Hence, insurance companies hold assets in government securities, stock, shares and bonds, mortgages and loans, cash and bills receivable and miscellaneous items (Aderibigbe, 2004). The investment objectives of insurance companies are mainly safety, liquidity and growth. Akpan and Joseph (2017) noted that these objectives which form the framework of investment portfolio structure of these firms are based on the nature of liabilities of the insurance firms, their operational focus and guidelines of the industry regulators which vary from one country to another and the stages of development in the various countries. In view of the investment practices and of portfolio insurance companies, Ahmed (2012) describes them as creator of wealth and mobilizer of funds for economic growth.
Modern insurance in Nigeria dates back to the 1960’s and since then more insurance companies have sprung up. Insurance company’s strength lies in the fact that huge amounts come by way of premiums. Every premium represents a risk that is covered by that premium, in effect, therefore, these vast amounts represent pooling of risks, the funds are collected and held in trust for the benefit of the policy holders. The management of Insurance companies is required to keep this aspect in mind and make all it decision in ways that benefit the community. This applies also to its investment. This is why successful insurance companies would not be found investing in speculative ventured as their investment benefit the society it large (Anchanvinay, 2010). According to Nigerian Insurance Report (2010), recapitalization of the insurance industry in Nigeria has no doubt recorded a huge volume of business, for instance, the sector was able to pull an aggregate gross premium income of ₦90,000 million in 2007, over 18% more than was obtained in 2005. Growth in premium maintained an upward trend of 25% in 2008 and 30% in 2009. Insurance density stood at 6.9%, industry global ranking was 61 and the gross premium income was ₦180,000 million in 2008 (NAICOM, 2010). A recent CBN (2017) report shows the industry delivered ₦ 1,837,822.4 million in Gross Premium in 2016 and ₦ 2129810.5536 million in 2017. This represented increased insurance penetration from 6% in 2008 to 56% in 2017, growth in insurance contribution to GDP from 0.7% in 2008 to 1.6% and 1.87% in 2016 and 2017 respectively, and growth in insurance density from ₦1,200 per individual in 2008 to about ₦9,400 in 2017. Thus a further assessment into the insurance premium and economic performance provides the thrust for this study.
Statement of the Problem
indemnity to loss thus leading to loss of confidence on the part of the customers on the industry. Furthermore, premium mobilized are invested in non-productive sector such as the stock market while less are invested in the preferred sectors such agriculture, manufacturing, mining etc. Empirical studies on the contribution of insurance premium to Nigeria’s economic growth have provided mix results. Studies by Oke, 2012; Solomon (2018); Ukpong & Acha (2017) indicate a positive relationship while Akpan and Joseph (2017); Torbira & Ogbulu (2013) provided a contrary report. It is pertinent therefore, to determine the true effect of insurance premium on Nigeria economy using current data.
Objectives of the Study
The aim of this study is to assess insurance premium and economic performance in Nigeria. Other specific objectives are:
1. To assess the impact of the insurance premium on Nigeria’s GDP.
2. To determine the relationship between investment of insurance industry and Nigeria’s GDP.
3. To evaluate the depth of impact insurance assets on GDP in Nigeria.
Research Hypotheses
The following research hypotheses have been constructed to provide a bearing for the study.
Ho1: Insurance premium has no significant impact on Nigeria’s GDP.
Ho2: There is no significant relationship between investment of insurance industry and
Nigeria’s GDP.
Ho3: There is no positive and significant level of depth in insurance industry’s asset to impact
on GDP in Nigeria
REVIEW OF RELATED LITERATURE
Insurance: Dickson (1960) in Oke (2012) opined that insurance is designed to protect the financial wellbeing of an individual, company or other entity in case of unexpected loss. According to him, some forms of insurance are required by law; while others are optional. Agreeing to the terms of an insurance policy creates a contract between the insurer and the insured. Gollier (2003) argued that insurance involved the transfer of risk from one individual to another, sharing losses on an equitable basis by all members of the group. The group, known as insurance company, must increase its hold on the premium and widen its profit margin to cope with the demand of their customer.
Insurance Premium: Insurance is designed to protect the financial well-being of an individual, company or other entity in the case of unexpected loss. In exchange for payments from the insured (called premiums), the insurer agrees to pay the policy holder a sum of money upon the occurrence of a specific event. In most cases, the policy holder pays part of the loss (called the deductible), and the insurer pays the rest (Victor, 2013). Brainard (2008) see insurance premium as the indemnification and risk pooling properties of insurance to facilitate commercial transactions and the provision of credit by mitigating losses as well as the measurement and management of non diversifiable risk more generally. Typically insurance contracts involve small periodic payments in return for protection against uncertain, but potentially severe losses. Among other things, this income smoothing effect helps to avoid excessive and costly bankruptcies and facilitates lending to businesses.
Functions of Insurance
i. A Risk Transfer and Loss Sharing Mechanism: In this regard, the function of insurance is in two fold. One is that it is a mechanism for transferring a risk from one individual to a group. The other is sharing losses on some recognized equitable basis by all the members of the group. It is an economic device that creates a subsidy by the many who are subject to a certain risk, to the few, who are affected by the occurrence of the risk. It makes the financial consequences of the risk fall lightly on many than falling heavily on few.
ii. A Social and Welfare Device: By compensating a victim of an accidental misfortune, the insurance industry is promoting individual and corporate happiness and a healthy society.
iii. Encourages Business Pursuit and Stability: Insurance has been described as the “handmaiden of commerce and industry” and the only business which exist in order to ensure the survival of all other business. Purchase of insurance product promotes confidence and eliminates insecurity and fear of loss. Without the protection offered by insurance to other businesses, the modern economic system, which we operate today, would almost certainly grind to a halt; reduction of the risk of business venture ensures a better psychological frame of mind to enable the entrepreneur concentrate and devote his skill to the improvement of his business for the benefit of the whole economy.
iv. Insurance Offers Indemnification against Unexpected Loss: Insurance stands as a guaranteed source of funds when the availability of other sources fail as a result of the loss. Adequately protected, business need not to face the grim prospects of liquidation, following a loss. Also a business entity can be continued without interruption even though the key person or sole proprietor dies.
v. Insurance Helps to Mobilize Idle Capital for Investment in the Economy: On the fear of losing their investment, many investors tie up a substantial amount of capital in idle reserve. The effect of insurance in this regard is to mobilize these funds and release them for the development of trade and industry which would probably not have place in the absence of insurance.
Insurance and Premium
result of war or loss of life due to suicide). Hazards are conditions that increase the probability or expected magnitude of a loss. Examples include smoking when considering losses due to fires, or a California residence when considering earthquake damage. In summary, an insurance contract covers a policy holder for economic loss caused by a peril named in the policy. The policy holder pays a known premium to have the insurer guarantee payment for the unknown loss. This manner, the policy holder transfers the economic risk to the insurance company. Risk which can be insured by private companies typically share seven common characteristics:
Since insurance operates through pooling resources, the majority of insurance policies are provided for individual members of large classes allowing insurers to benefit from the law of large numbers in which predicted losses are similar to the actual losses. Exceptional includes. Lloyd’s of London which is famous for insuring the life or health of actors, sports, figures and other famous individuals. However, all exposures will have particular differences, which may lead to different premium rates. Definite loss- The loss takes place at a known time, in a known place and from a known cause. The classic example is death of an insured person in a life insurance policy. Ideally the time, place and cause of a loss should be clear enough that a reasonable person, with sufficient information could objectively verify all the three elements.
Accident loss- The event that constitutes the trigger of a claim should be fortuitous or at least outside the control of the beneficiary of the insurance. The loss should be pure in the sense that it results from an event for which there is only the opportunity for loss. Large loss-The size of the loss must be meaningful from the perspective of the insured. Insurance premiums need to cover both the expected cost of losses, plus the cost of issuing and administrating the policy, adjusting losses, and supplying the capital need to reasonably assure that the insurer will be able to pay claims for small losses; those latter costs may be several times the size of the expected cost of losses. There is hardly any point in paying such costs unless the protection offered has really value to a buyer. Calculable Loss- There are two elements that must be at least estimable, if not formally calculable the probability of loss and the attendant cost. Probability of loss is generally an empirical exercise, while cost has more to-do with the ability of a reasonable person in possession of a copy of the insurance policy and a proof of loss associated with acclaim presented under that policy to make a reasonably definite and objective evaluation of the amount of the loss recoverable as a result of the claim. Affordable Premiums- If the likelihood of an insured event is too high, or the cost of the event is so large that the resulting premium is large relative to the amount of protection offered, it is not likely that the insurance will be purchased, even if on offer. Further as the accounting standards, the premium cannot be so large that there is not a reasonable chance of a significant loss to the insurer if there is no such insurance, but not the substance.
THEORETICAL FRAMEWORK
citizens. Further, they enhance the government’s accumulation of productive capital, which is primarily invested in long term investment instruments that can be used for infrastructural development. As the dominant segment in the insurance market, the sustainability of the life insurance business is crucial for developing nations. They play active role as the country’s protection and repair system (Sambasivam & Ayele 2013). Literature have thus reported that five possible relationships could exist between insurance and economic growth: negative (Zouhaier, 2014), demand following (Ching, Kogid, & Furuoka, 2010), supply leading (Ward & Zurbruegg, 2000), interdependence (Ghosh, 2013) and no relationship at all (Haiss & Sumegi, 2008; Omoke, 2012). This theory thus provides us the foundation to find out how insurance has contributed to Nigeria’s economic growth since they are the second largest financial institution after banks in Nigeria.
Review of Empirical Studies
Adamu, Okorafor and Adeyemi (2011) studied the influence of economic factors on business operations of some randomly selected Insurance Companies. The deposit base of five selected Insurance Companies was used as a measure of business performance. The impact of economic factors such as Average exchange rate movement, average minimum rediscount rate, rate of growth of GDP and average inflation rate on deposit base of five Insurance Companies was examined. Multivariate regression and ANOVA were used to analyze the data collected and test the hypothesis formulated. It was discovered that economic environment significantly affects the performance of Insurance Companies.
Mojekwu, Agwuegbo and Olowokudejo (2011) examined the impact of insurance contributions on economic growth in Nigeria over a twenty seven year period, between 1981 and 2008 using a dynamic factor model. The technique described a number of methods designed to analyze a functional relationship between the volume of insurance contribution and economic growth in terms of underlying but unobservable random quantities called factors. The factor loadings indicate which common trend is related to which set of time series. The result obtained through this approach shows that the functional relationship between the volume of insurance contribution and economic growth in Nigeria is a first order vector autoregressive model.
Oke (2012) used fixed effect model and co-integration analysis to determine the short-run and long-run relationship between insurance sector growth and economic development in Nigeria. The study spanned from the period 1986 to 2009. The result reveals that insurance sector growth and development positively and significantly affects economic growth. The result of the granger causality test indicates that the extent of influence the insurance sector growth had on economic growth was limited and not direct because of some cultural, attitudinal traits and values in the economy.
Eze and Okoye (2013) explored the impact of insurance practice on the growth of Nigerian economy. Insurance premium income, total insurance investment and income of insurance development was used as determinants of insurance practice. They employed unit root tests, Johansen co-integration test and error correction model in data analysis and to determine the short and long run effect of the model. The study observed that the insurance premium capital has significantly impacted on economic growth in Nigeria; that the level of total insurance investment has significantly effected on economic growth in Nigeria; and that there is causal relationship between insurance sector development and economic growth in Nigeria. The implication of these findings is that insurance industry would contribute meaningful to the growth of Nigeria economy in long run. The study concludes that there is a significant positive effect of insurance practice on the growth of Nigerian economy.
Victor (2013) focused on the “Impact of Insurance on Economic Growth In Nigeria”. To achieve this, models were formulated and data for the period 1998-2007 were collated while the co-integration and Error Correction model were employed for analysis. The findings towed the direction of the alternate hypotheses which state that; there is a significant relationship between insurance premium and economic growth. Based on the study, it is recommended that policy efforts should be directed by government at growing the insurance industry in the country; and through such means enhances investment as well as production and employment creation.
Chang, Lee, and Chang (2014) again examined the relationship between insurance and economic growth for 10 OECD. They apply bootstrapping Granger causality model over a period of 1979–2006. They revealed that one-way Granger causality running from all insurance activities to economic growth for France, Japan, Netherlands, Switzerland and the UK. Furthermore, economic growth Granger causes insurance activities in Canada (for life insurance), Italy (for total and life insurance) and the US (for total and non-life insurance). There is a two-way Granger causality between life insurance activity and economic growth in the US, while no causality between insurance activities and economic growth is found in Belgium (for all insurance), Canada (for total and non-life insurance), Italy (for non-life insurance) and Sweden (for life insurance).
Din, Abu-Bakar and Regupathi (2017) carried out a study to answer the question on whether insurance promote economic growth. It aimed at examining the relationship between insurance and economic growth in 20 countries for the period 2006–2015. The Hausman statistics confirmed that fixed effect model is appropriate for this data-set. This study found a positive and a significant relationship between life insurance, measured through net written premiums and density, and economic growth for developed countries while the same is true for developing countries when insurance is measured through penetration proxy. The results also reveal that non-life insurance has statistically significant, for all three proxies, relationship with economic growth for developing countries whereas, in case of developed countries, the results are only significant when insurance density is used as a proxy for insurance. Moreover, the role of non-life insurance is more significant for developing countries as compared to developed countries.
adopted in the study. The findings were that there is a positive but no significant relationship between government securities, stock of bond, real estate and mortgage, policy and other loans, cash deposits, bills of exchange of insurance companies and economic growth in Nigeria. This implies that investment portfolios of insurance companies do not contribute significantly to economic growth in Nigeria within the period under study. Also, there is a significant relationship between ordinary shares, preference shares, debentures, subsidiaries, other investments, total investments of commercial banks and economic growth in Nigeria. This implies that investment portfolios of commercial banks do contribute significantly to economic growth in Nigeria within the period under study.
A recent study by Din, Angappan, & Baker (2017) investigated the relationship between insurance and economic growth for USA, UK, China, India, Malaysia and Pakistan using Pooled Mean Group (PMG/ARDL). They reported a positive and significant relationship between aggregate insurance, measured by net premiums and economic growth for all six countries. In addition, at disaggregate level; non-life insurance is also significantly associated with economic growth for all six countries. However, life insurance is only promoting economic growth for UK, India and Pakistan while the reverse is true for USA, China and Malaysia.
Ukpong and Acha (2017) evaluated the co-integration and causal relationship between insurance and economic development in Nigeria using time series data from 1990 – 2013. Gross domestic product (GDP) is adopted as a proxy for the level of economic development, while total life insurance premiums (TPL), total non-life insurance premiums (TPNL) and total insurance investment (TII) are used in measuring growth in the insurance sector. Data is operationalized through the stationarity test, co-integration test, regression analysis and granger causality tests. The stationarity test reveals that all-time series data are stationary at the 1%, 5% and 10% levels of significance. The test for integration shows that all co-integrate when GDP is the endogenous variable. The granger causality test reveals that there is a bidirectional relationship existing between GDP and total non-life insurance premiums while a unidirectional relationship exists between GDP and total life insurance premiums with no causal relationship existing between GDP and total insurance investments. It concluded that insurance not only contributes to economic development but also has a long term equilibrium relationship.
Solomon (2018) empirically studied the impact of insurance premium and investment on economic performance in Nigeria. The study covers the period 1981-2017. It made use of data collected from CBN Statistical Bulletin while regression statistical tool was applied. It was found that insurance premium and asset have positive and significant relationship with GDP. The result showed that there is negative relationship between investment of insurance industry and GDP.
RESEARCH METHODOLOGY Research Design and Sources of Data
The study will make use of quasi experimental research design. This is used because the study is based on time series events and also intends to investigate the strength of relationship between two or more economic factors on which design is based. The study relied heavily on CBN Statistical Bulletin. The data sourced include: Gross Domestic Product (GDP), insurance companies’ premium, investment, shareholder capital and assets from 1986 to 2017.
Model Specification
The variables
GDP = F (PREM, INVT, and ASST)………. (1)
Where:
GDP = Gross Domestic Product PRE = Insurance premium INV= Investment
CAP = Capital AST = Asset
GDPt = b0 + b1 PREMt + b2 INVTt + b3 ASSTt + U1t … ….. (2)
Where:
b1, b2, b3, and b4, are parameter estimates for PREM, INVT and ASST respectively.
U1t = Error terms
b0 = intercept of GDPt model
t = number of years
Method of Data Analysis
This study will adopt the unit root test, ordinary least square, co-integration and variance decomposition techniques to estimate the models.
DATA ANALYSIS AND INTERPRETATION
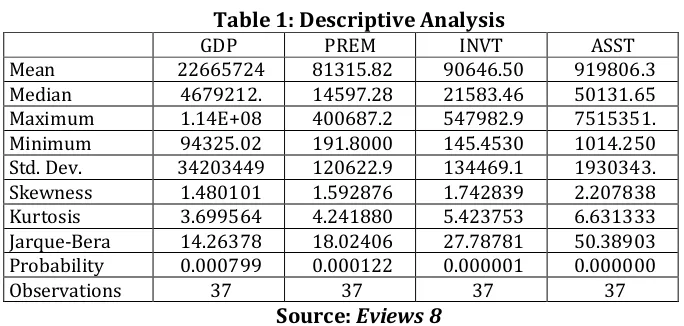
Table 1: Descriptive Analysis
GDP PREM INVT ASST
Mean 22665724 81315.82 90646.50 919806.3
Median 4679212. 14597.28 21583.46 50131.65
Maximum 1.14E+08 400687.2 547982.9 7515351.
Minimum 94325.02 191.8000 145.4530 1014.250
Std. Dev. 34203449 120622.9 134469.1 1930343.
Skewness 1.480101 1.592876 1.742839 2.207838
Kurtosis 3.699564 4.241880 5.423753 6.631333
Jarque-Bera 14.26378 18.02406 27.78781 50.38903
Probability 0.000799 0.000122 0.000001 0.000000
Observations 37 37 37 37
Source: Eviews 8
Table 2: Correlation Matrix
GDP PREM INVT ASST
GDP 1.000000 0.950762 0.787278 0.934555
PREM 0.950762 1.000000 0.812826 0.900200
INVT 0.787278 0.812826 1.000000 0.787328
ASST 0.934555 0.900200 0.787328 1.000000
Source: Eviews
The correlation matrix depicted in table 2 shows that the least collinearity value is 0.787278 while the highest collinearity value is 0.950762. This indicates there is high and positive correlation between the variables.
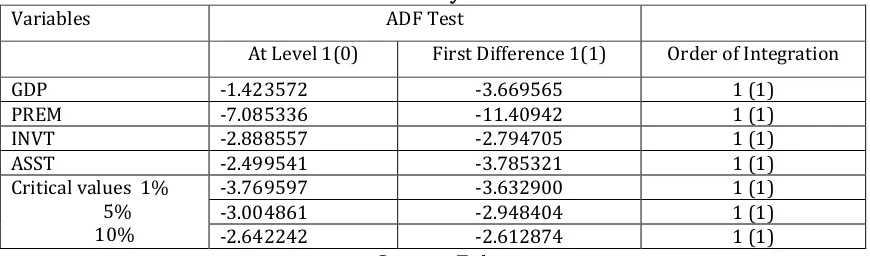
Table 3: Stationarity Test for Variables
Variables ADF Test
At Level 1(0) First Difference 1(1) Order of Integration
GDP -1.423572 -3.669565 1 (1)
PREM -7.085336 -11.40942 1 (1)
INVT -2.888557 -2.794705 1 (1)
ASST -2.499541 -3.785321 1 (1)
Critical values 1% 5% 10%
-3.769597 -3.632900 1 (1)
-3.004861 -2.948404 1 (1)
-2.642242 -2.612874 1 (1)
Source: Eviews
The results of the unit root tests using Augmented Dickey-Fuller test to determine whether they are stationary or non-stationary series. The two tests are employed to reinforce one another, to ensure their robustness and boost confidence in their reliability. The results shows that all the variables do not have unit roots (that is, are stationary) at 5% in their first differences. Thus, variables are said to be integrated in the order of 1(1). Moreover, having observed that all the variables for the study is stationary, we, therefore, proceed to test for actual number of cointegration equations that exist among the series.
Table 4: Johansen Co-integration
Trend assumption: Linear deterministic trend Series: GDP PREM INVT ASST
Unrestricted Cointegration Rank Test (Trace)
Hypothesized Trace 0.05
No. of CE(s) Eigenvalue Statistic Critical Value Prob.**
None 0.979659 236.4897 47.85613 0.0001
At most 1 * 0.862921 100.1606 29.79707 0.0001
At most 2 0.516385 30.60854 15.49471 0.0001
At most 3 0.137624 5.182226 3.841466 0.5000
Trace test indicates 4 cointegrating eqn(s) at the 0.05 level * denotes rejection of the hypothesis at the 0.05 level
Unrestricted Cointegration Rank Test (Maximum Eigenvalue)
Hypothesized Max-Eigen 0.05
No. of CE(s) Eigenvalue Statistic Critical Value Prob.**
None 0.979659 136.3291 47.85613 0.0001
At most 1 0.862921 69.55203 29.79707 0.0001
At most 2 0.516385 25.42632 15.49471 0.0001
At most 3 0.137624 5.182226 3.841466 0.5000
Max-eigenvalue test indicates 4 cointegrating eqn(s) at the 0.05 level * denotes rejection of the hypothesis at the 0.05 level
The Johansen co-integration result in Table 4 used to test the existence of long run relationship among the variables showed that for the Unrestricted Co-integration Rank Test, there is four cointegrating equation which suggests that insurance premium, asset and investment have long run relationship with GDP. The Maximum Eigenvalue indicates that there are four co-integrating equations among the variables in the model. This confirms that there is long run relationship between insurance activities and economic growth in Nigeria.
Table 5 OLS Regression Analysis
Dependent Variable: GDP Method: Least Squares Date: 08/21/18 Time: 08:28 Sample: 1981 2017
Included observations: 37
Variable Coefficient Std. Error t-Statistic Prob.
C 2742942. 1893452. 1.448646 0.1569
PREM 167.8374 30.90739 5.430334 0.0000
INVT -6.774952 19.58286 -0.345963 0.7316
ASST 7.489695 1.824739 4.104528 0.0002
R-squared 0.936821
Adjusted R-squared 0.931077
Durbin-Watson stat 1.943354
F-statistic 163.1080
Prob(F-statistic) 0.000000
Source: Eviews 8
The model shows a coefficient of determination (R2) is 93.68%. This indicates a goodness of fit
on the regression line, that is, the variables are strongly fitted. The adjusted coefficient of correlation (R-2) found to be 93.11%. It implies that 93.11 percent of the total variation found
in GDP is explained by the presence of total assets, investments and premium of the insurance industry sector.
From the model, the result showed that there is positive relationship between insurance premium and GDP. That is, the higher the insurance premium, the higher the GDP which conforms to expectation. It suggests that a unit rise in premium leads to 167.8374units rise in GDP. Given the t-Statistics value of 5.430334 and a prob value of 0.0000< 0.05 confidence level, Insurance premium has significant impact on Nigeria’s GDP.
The result showed that there is negative relationship between investment of insurance industry and GDP. That is, the higher the insurance premium, the lower the GDP which does not conform to expectation. It suggests that a unit rise in investment of insurance industry leads to 6.774952units decrease in GDP.
There is positive relationship between insurance industry’s asset and GDP. That is, the higher the insurance industry’s asset, the higher the GDP which conforms to expectation. It suggests that a unit rise in investment of insurance industry leads to 7.489695 units increase in GDP.
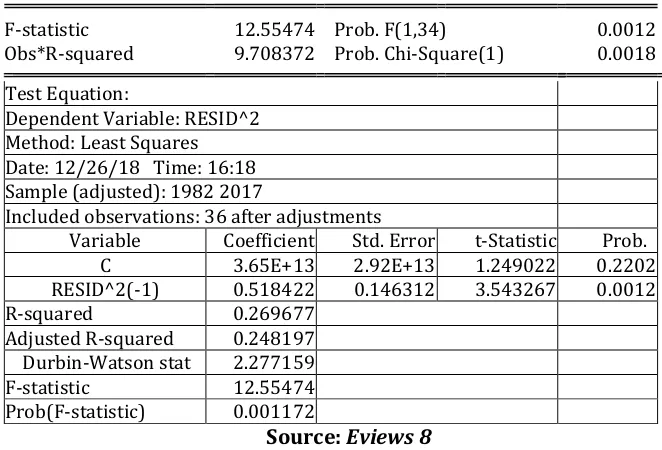
Table 6 Autoregressive Conditional Heteroskedasticity Analysis
Heteroskedasticity Test: ARCH
F-statistic 12.55474 Prob. F(1,34) 0.0012
Obs*R-squared 9.708372 Prob. Chi-Square(1) 0.0018
Test Equation:
Dependent Variable: RESID^2 Method: Least Squares Date: 12/26/18 Time: 16:18 Sample (adjusted): 1982 2017
Included observations: 36 after adjustments
Variable Coefficient Std. Error t-Statistic Prob.
C 3.65E+13 2.92E+13 1.249022 0.2202
RESID^2(-1) 0.518422 0.146312 3.543267 0.0012
R-squared 0.269677
Adjusted R-squared 0.248197
Durbin-Watson stat 2.277159
F-statistic 12.55474
Prob(F-statistic) 0.001172
Source: Eviews 8
Table 7a: Variance decomposition: Cholesky Ordering: GDP PREM INVT ASST
Variance Decomposition of GDP:
Period S.E. GDP PREM INVT ASST
1 2148971. 100.0000 0.000000 0.000000 0.000000
2 2503006. 73.72609 3.875494 5.676579 16.72183
3 3462720. 53.96602 13.06465 23.64930 9.320039
4 4310733. 63.72192 12.88267 15.48247 7.912939
5 5282299. 68.19282 9.847128 15.64675 6.313306
6 6842933. 45.53039 15.91025 30.85912 7.700244
7 8958031. 30.20403 21.37076 41.03231 7.392903
8 11271988 20.20768 25.94680 46.35312 7.492394
9 13406250 14.84025 28.69708 48.60632 7.856347
10 15254750 12.12779 30.01229 49.50584 8.354080
Variance Decomposition of PREM:
Period S.E. GDP PREM INVT ASST
1 17687.58 41.16169 58.83831 0.000000 0.000000
2 27081.34 29.50338 35.84520 17.64370 17.00772
3 34148.93 46.63513 23.50926 13.68717 16.16844
4 41991.85 46.33193 18.72351 15.50335 19.44122
5 46770.69 55.55544 15.09704 13.61588 15.73163
6 50167.17 48.58000 18.00105 18.70279 14.71616
7 54083.03 41.80959 20.65830 23.45385 14.07826
8 58057.18 37.39294 21.49920 27.73844 13.36942
9 62097.11 33.26483 23.45467 30.56299 12.71751
10 66223.83 29.47095 24.72371 33.04320 12.76214
Variance Decomposition of INVT:
Period S.E. GDP PREM INVT ASST
1 34466.74 19.58421 22.80422 57.61157 0.000000
2 63319.92 6.096511 30.07029 62.29342 1.539781
3 82882.46 6.331937 36.27445 55.35156 2.042060
4 91697.96 7.605736 36.03404 53.30489 3.055334
5 92920.97 7.422152 36.45202 52.96210 3.163730
6 93210.32 7.515450 36.41978 52.64155 3.423218
7 93620.35 7.788759 36.23732 52.46649 3.507432
8 94575.40 9.136113 35.72901 51.61185 3.523024
9 95530.80 10.71665 35.01855 50.61084 3.653961
10 97420.69 12.31593 33.99749 49.74056 3.946027
Variance Decomposition of ASST:
Period S.E. GDP PREM INVT ASST
1 206600.9 27.46610 27.06956 19.72563 25.73871
2 282900.0 44.75269 29.04803 12.15555 14.04373
3 301176.9 49.21765 26.54737 11.77480 12.46019
4 336509.4 39.82248 22.24128 27.94971 9.986532
5 408620.7 27.19734 26.96038 38.28162 7.560663
6 529575.4 34.57116 27.15333 33.70458 4.570933
7 563971.1 39.99635 25.21072 30.54787 4.245050
8 600256.5 43.20705 22.58170 29.37689 4.834368
9 686487.0 39.68255 21.52881 33.53889 5.249756
Table 7b: Variance decomposition Graphical Representation
-4,000,000 -2,000,000 0 2,000,000 4,000,000 6,000,000
1 2 3 4 5 6 7 8 9 10
Response of GDP to PREM
-4,000,000 -2,000,000 0 2,000,000 4,000,000 6,000,000
1 2 3 4 5 6 7 8 9 10
Res pons e of GDP to INVT
-4,000,000 -2,000,000 0 2,000,000 4,000,000 6,000,000
1 2 3 4 5 6 7 8 9 10
Res pons e of GDP to ASST
Response to Cholesky One S.D. Innovations
Table 7c: Impulse Response
-6,000,000 -4,000,000 -2,000,000 0 2,000,000 4,000,000 6,000,000
1985 1990 1995 2000 2005 2010 2015
GDP Residuals
-40,000 -20,000 0 20,000 40,000 60,000
1985 1990 1995 2000 2005 2010 2015
PREM Residuals
-100,000 -50,000 0 50,000 100,000
1985 1990 1995 2000 2005 2010 2015
INVT Residuals
-400,000 -200,000 0 200,000 400,000 600,000
1985 1990 1995 2000 2005 2010 2015
ASST Residuals
However, since PREMIUM represents revenue for the insurance industry it can be deduced that it has positive impact on GDP for all the periods as it rose from 0.00% in period 1 to 3.87% in period 2 before rising to 12.88% in period 4. There was further rise to 21.37% in period 7 and 30.01% in period 10. Moreover, INVESTMENT also responds positively to PREMIUM which implies that insurance companies rely on premium to stay in business. It can also be deduced that GDP does not respond significantly to the level of assets of insurance companies. It witnessed constant reduction from 16.72% in period 2 to 7.85% in period 9 before rising slightly to 8.35% in period 10.
Table 8: Granger Causality Result
Pairwise Granger Causality Tests Date: 08/21/18 Time: 09:23 Sample: 1981 2017
Lags: 2
Null Hypothesis: Obs F-Statistic Prob.
PREM does not Granger Cause GDP 35 6.75415 0.0038
GDP does not Granger Cause PREM 9.57550 0.0006
INVT does not Granger Cause GDP 35 32.1068 4.E-08
GDP does not Granger Cause INVT 6.24190 0.0054
ASST does not Granger Cause GDP 35 0.84583 0.4392
GDP does not Granger Cause ASST 23.5108 7.E-07
Source: Eviews 8
This granger causality was used test to determine the direction of influence on the variables. The result shows that there is granger causality relationship between insurance premium and GDP which implies that insurance premium influences the direction of economic growth in Nigeria while the growth of the economy also influences growth in insurance premium. From the foregoing, it can e stated that insurance industry relies on the productive capacity of the economy while the economy relies on insurance to keep up business growth. The result also shows that there is granger causality relationship between insurance investment and GDP, that is, a investment influences the outcome of GDP while increase in economic output raises investment decision of insurance companies. Furthermore, there is unidirectional causality relationship between insurance assets and GDP running from GDP to insurance assets.
DISCUSSION OF FINDINGS
From the analysis carried out, the model was linear in form. Investments of the Insurance industry were negatively related to GDP which does not conform to apriori expectation. This suggests that insurance companies are not investing in long term projects which was decried by NAICOM (2016) and Akpan and Joseph (2017) that insurance companies are into buying and selling like traders not like investors. It has been argued that most insurance industries like their deposit money banks counterparts result in trading of shares, foreign exchange and oil and these was exposed during the global financial crises and fall in oil price where most of their investments were whipped out.
growth and development positively and significantly affects economic growth. Eze and Okoye (2013) observed that the insurance premium capital significantly impacted on economic growth in Nigeria and also concluded that a significant positive effect of insurance practice on the growth of Nigerian economy. The implication is that insurance industry have great role to play in mobilizing savings such as premium payment by the insured and should be given more attention by authorities, such attention been given to deposit money banks in terms of regulation and reform.
There was also a positive but less impact of insurance assets and GDP. This supports the findings of Oke (2012) and Torbira & Ogbulu (2013) who showed that the influence of insurance sector growth had on economic growth was limited because of some cultural, attitudinal traits and values in the economy. Also, Omoke (2011) found a low insurance market activity in Nigeria and that Nigerians have not fully embrace the insurance industry despite its importance to the growth of the economy. It however supports the findings made by Solomon (2018); Ukpong and Acha (2017) whose studies showed a positive link between insurance assets and GDP. The implication is that increasing the assets growth of insurance industry allows them to engage in more investments and savings mobilization through premium. A strong asset based insurance industry can also easily cover claims and provide succour for losses made by the insured.
RECOMMENDATIONS
From the findings it is necessary for the insurance business authorities to review its reform policy and ensure that policies that will strengthen the functions in premium mobilization in Nigeria. In terms of investment, insurance industry seems to have a place in Nigeria. Insurance companies therefore need to invest more productive sectors of the economy.
References
Adamu, M. O., Okorafor, U. & Adeyemi, A. B. (2011). The impact of economic environment on insurance Companies in Nigeria. Journal of Sci. Res. Dev. 13, 11 – 18.
Aderibigbe, J. O. (2004). An overview of the Nigeria Financial System. CBN Bullion, 28 (1).
Adeyemi, M. (2005). An overview of the Insurance Act 2003.. In: O. C. Ezekiel, (Ed.), Issues in Merger and Acquisition for the Insurance Industry, 61-78. Proceeding of the NIA workshop on Insurance ACT 2003, Lagos: Nigeria Insurance Association, 2005.
Ahmed, K. R. (2012): Enhancing the value of insurance in Nigeria through paradigm shifts. Journal of Chartered Insurance Institute of Nigeria, 12(3), 16-19.
Ajayi, L. A. (2000), Element and Scope of Insurance, Akure: Hybrid Publishers Limited. ISBN: 978-2858-66-47 Akpan, I. T. & Joseph, E. M. (2017). Comparative analysis of insurance companies and commercials banks’
investment portfolios and economic growth in Nigeria. Arabian Journal of Business and Management Review, 4 (2), 6-25.
Anchanvinay, S. (2008). Insurance a basic need. Retrieved from www.blogRabking.com.
Anderson, F. J. & Brown, R. L. (2005). Risk and insurance. U.S.A: Society of Actuaries Publications. Aneke, J.I. (2004). Principles and practice of insurance. Enugu: Tochan Ventures.
Augustine, U. & Nwanneka, J. M. (2011). Repositioning insurance industry for operational efficiency: The Nigerian case. Journal of Applied Finance & Banking, vol.1, no.3, 2011, 15-32.
Bencivenga, V. R. & Smith, B. D. (1991). Financial intermediation and endogenous growth. Review of Economics Studies, 58(2), 195–209.
Brainard, L. (2008). What is the role of insurance in economic development? Retrieved from https://www.draudimas.com/allpics/What_is_the_role_of_economic_developement.pdf
Chikeze and Echekoba (2008) Insurance Business and Information Communication Technology; Nigeria Insurance Industry Experience.
Ching, K. S., Kogid, M., & Furuoka, F. (2010). Causal relation between life insurance funds and economic growth evidence from Malaysia. Asean Economic Bulletin, 27(2), 185–199.
Din, S. M., Abu-Bakar, A. & Regupathi, A. (2017). Does insurance promote economic growth: A comparative study of developed and emerging/developing economies. Cogent Economics & Finance (2017), 5:, 1-12.
Din, S. M. U., Angappan, R., & Baker, A. A. (2017). Insurance effect on economic growth-among economies in various phases of development. Review of International Businessand Strategy, 27(4), 409–427.
Eze, O. R. & Okoye, V. (2013). Analysis of insurance practices and economic growthin Nigeria: using Co-integration Test and errorCorrection Model. Global Advanced Research Journal of Management and Business Studies, 2(1), 063-070.
Fatula, O. (2007). The imperative of recapitalisation and consolidation in the Nigeria Insurance Industry. I (I&II), Ikeja Bar Review, p. 128.
Gollier, C. (2003). To insure or not to insure? An insurance puzzle. The Geneva Papers on Risk and Insurance Theory, 28: 5–24.
Goldsmith, R. W. (1969). Financial structure and development. New Haven: Yale University Press.
Greenwood, J., & Smith, B. (1997). Financial development, growth and the distribution of income. Journal of Political Economy, 98(5), 1076-1107.
Haiss, P., & Sumegi, K. (2008). The relationship between insurance and economic growth in Europe: A theoretical and empirical analysis. Empirica, 35(4), 405–431.
Irukwu, J. O. (1986). Insurance Year Book. Lagos, Nigeria: Nigerian Reinsurance Corporation.
Jegede, M. I. (2005). A comprehensive analysis of the Insurance Act 2003 and its implications on the insurance business environment - Issues in merger and acquisition for the insurance industry. In: O. C. Ezekiel (Ed.), Proceeding of the NIA Workshop on Insurance ACT 2003, Lagos: Nigerian Insurance Association, 2005, 61-78. McKinnon, R. I. (1973). Money and capital in economic development. Washington D.C.: Brookings Institution. Mishkin, F. S. (2010). The economics of money, banking & financial markets. [9th Edition]. United States: Addison
Wesley.
Mojekwu, J., Agwuwgbo, S. & Olowokudejo, F. (2011). The impact of insurance contributions on economic growth in Nigeria. Journal of Economics and International Finance, 3(7): 444-451.
National Insurance Commission (NAICOM), Nigeria, 2003. http://www.naicom.gov.ng/
NAICOM (2007) Guidelines for the Insurance Sector Reform and Consolidation, Published by National Insurance Commission, Sept. 30, 2005, zone 5, PMB 457, Garki Abuja.
Obaremi, N. (2007). Nigeria insurance special report: big is beautiful. African Business, 4, 51-62.
Obasi, N. (2010). Policies, challenges, reforms and Nigerian disposition to insurance contracts. The Fronteira Post, 1-6.
Oke, M. O. (2012). Insurance sector development and economic growth in Nigeria. African J. Business Management, 6(23), 7016-7023.
Omoke, P. C. (2012). Insurance market activity and economic growth: Evidence from Nigeria. Acta Universitatis DAanubius, 8(2), 34–47.
Osho, L.A, & Ademuyiwa, M.A. (2017). Insurance and Entrepreneurship Development: Focus on Nigeria. International Journal of Entrepreneurial Development, Education and Science Research, 4 (1), 46-57. Osunkunle, B. (2002). Impact of insurance in Nigeria. Ibadan: EvansBrothers Publishers.
Pandey, I.M. (2003). Financial management. New Delhi: McGraw Hill Publishers
Salvatore, D. (2013). International economics, (11th Ed.). United States: Fordham University.
Sambasivam, Y., & Ayele, A. G. (2013). A study on the performance of insurance companies in Ethiopia. International Journal of Marketing, Financial Services &Management Research, 2 (7), 138-150.
Shaw, E. S. (1973). Financial deepening in economic development. New York: Oxford University Press.
Solomon, O. (2018). Insurance premium and investment: what impact has it had on Nigeria’s economic growth? www.independent.academia.edu/kingsooloo.
Torbira, L. L. & Ogbulu, M. O. (2014). Fund mobilization by insurance companies and fixed capital formation: Evidence from the Nigerian economy. International Journal of Financial Research, 5 (2), 69-78.
Ukpong, M. S. & Acha, I. A. (2017). Insurance and economic development in Nigeria: Co-integration. Scholedge International Journal of Management & Development, 4 (4), 28-39.
Victor, O. C. (2013). Impact of insurance on economic growth in Nigeria. International Journal of Business and Management Invention, 2 (10), 19-31.
Ward, D., & Zurbruegg, R. (2000). Does insurance promote economic growth? Evidence from OECD countries. The Journal of Risk and Insurance, 67(4), 489–506.
Zouhaier, H. (2014). Insurance and economic growth. Journal ofEconomics and Sustainable Development, 5(12), 102–113.
Total Investment, assets and premium of the insurance industry and GDP Year GDP Total investment of Insurance
industry
Insurance Industry Premium
Total asset of Insurance industry
1981 94325.02 145.453 234.05 1014.25
1982 101011.23 190.389 248.77 1138.42
1983 110064.03 169.496 191.80 1106.13
1984 116272.18 199.519 205.69 1333.88
1985 134585.59 277.681 195.29 1934.48
1986 134603.32 290.626 254.16 2487.99
1987 193126.20 324.225 406.50 2651.50
1988 263294.46 326.049 486.65 4255.90
1989 382261.49 414.653 673.09 5290.83
1990 472648.75 498.160 1013.67 6333.74
1991 545672.41 987.437 1296.24 6628.38
1992 875342.52 5094.023 2445.69 10166.73
1993 1089679.72 2,078.444 4931.92 20329.96
1994 1399703.22 1817.680 14519.15 23220.86
1995 2907358.18 4232.125 13525.13 17155.20
1996 4032300.34 12379.46 11091.33 15276.92
1997 4189249.77 13613.08 10941.58 20079.63
1998 3989450.28 15656.88 11688.25 22578.89
1999 4679212.05 21583.46 14597.28 50131.65
2000 6713574.84 25192.64 22531.46 61600.00
2001 6895198.33 32157.27 28981.29 78060.48
2002 7795758.35 36940.87 37765.89 85255.73
2003 9913518.19 54642.84 43441.81 124267.37
2004 11411066.91 74590.75 50100.83 141222.03
2005 14610881.45 121844.22 67465.56 203113.12
2006 18564594.73 216359.91 81583.75 307542.61
2007 20657317.67 329247.93 89104.89 427497.16
2008 24296329.29 336491.38 126470.30 573154.46
2009 24794238.66 148083.88 153127.12 586459.54
2010 54204795.12 100239.95 157336.81 585015.79
2011 63258579.00 103573.1 175756.75 621095.14
2012 71186534.89 106384.456 366,657.8 3150089.60
2013 80222128.32 133915.194 119,652.4 4058087.31
2014 89043615.26 245002.634 288478.3 3840077.06
2015 94144960.45 266171.959 332664.1 5302879.35
2016 101489492.20 394819.591 377932.77 6158947.80
2017 113719048.23 547982.940 400687.22 7515351.41