DETERMINATION OF GEOMETRIC PARAMETERS OF GRADIENT STRUCTURES
FORMED IN OPTICAL GLASS BY THE ELECTRON BEAM METHOD
ВИЗНАЧЕННЯ ГЕОМЕТРИЧНИХ ПАРАМЕТРІВ ГРАДІЄНТНИХ СТРУКТУР, СФОРМОВАНИХ В
ОПТИЧНОМУ СКЛІ ЕЛЕКТРОННО-ПРОМЕНЕВИМ МЕТОДОМ
Grechana О.1
, Skoryna E.2, PhD Bondarenko I.2
Faculty of computer engineering technology and design1, Faculty of Electronically Technologies and Robotics2 Cherkassy State Technological University, Ukraine
Abstract
:
The results of experimental studies of the geometry of gradient structures formed in optical glass by the method of electron-beam modification of its surface are presented. The expediency of using the atomic force microscopy method for determining the geometrical parameters of microlayers formed in the surfaces of optical materials by the method of their electron-beam modification is substantiated. A new method for determining the basic geometric parameters (thickness of the gradient layer, topology of the interface "gradient layer - the basis of the material", surface microrelief, etc.) gradient structures, based on the method of atomic force microscopy is proposed. The proposed method is based on the principle of the complex application of various operating modes of an atomic-force microscope (the results of the instrument operation are considered, both in contact and in non-contact modes) in one measurement cycle. According to the proposed method, the dependencies between the change in the refractive index and the modes of electron-beam modification of the optical glass surface, as well as the dependence between the electron-beam effect modes and the geometric parameters of the gradient structure on the glass (thickness of the gradient structure, surface microrelief and interface between the layers and the base material ). The possibility of predicting the development of hidden microdefects at the interface “gradient layer - the basis of the material” is shown. Proved high reliability and adequacy of the proposed method by comparing the results obtained with the results of determining the geometric parameters obtained by other alternative methods.KEYWORDS: ELECTRON-BEAM METHOD, GRADIENT STRUCTURE, OPTICAL GLASS, GEOMETRIC PARAMETER, ATOMIC-FORCE MICROSCOPY
1.
Introduction
In modern instrumentation technology, gradient structures formed in optical glass are widely used. Such coatings have unique properties (high strength, reflective and refractive power, etc.) that can be used as functional elements in various areas of precision instrument making, micro-optics, integrated optics, etc. [1, 2].
As shown in the work [3], the microgeometry of the gradient structures formed in the surface of optical glass determines their performance characteristics depending on the method of preparation. Various methods for obtaining such structures are presented in the work [4, 5], the most popular among them is the electron-beam method [6], which allows forming various layers of the chemical composition and physical properties in the surface layer of the optical glass, which possess, among other things, the property of the gradient change of the refractive index in the thickness of the optical material.
The method of obtaining and the features of the surface microrelief determine the operational characteristics of optical elements (reflection and refraction coefficients, diffusion of the light flux) associated with the instability of their properties through the thickness of the optical material. As it was shown in the work [7], the reasons for such instability are size effects (uneven distribution of material density across the thickness of an optical product, surface structure) and the operating conditions of these elements (aggressiveness of the environment, time and temperature of operation, thermal and mechanical effects in contact with other elements of the product).
The issues of obtaining and studying gradient structures in optical materials were studied by domestic and foreign scientists, including: Dubrovskaya G.N., Kanashevich G.V., Kotelnikov D.I., Lisochenko N.I., Marjan N.I., Yurkovich N.V. and etc. 8-10.
At the same time, among the methods for studying gradient structures, the most promising are analytical methods of scanning probe microscopy. The atomic force microscopy method [11] has
significant advantages in studying the microrelief of gradient surfaces modified by electron flow, namely: high accuracy of fixed surface asperities (up to units of angstroms) and sensitivity of the measuring console (≈10-8
N), and the method itself refers to non-destructive research methods that do not require preliminary preparation of the research material and pretend on the expressivity of the research.
The aim of the work is to study the gradient structures formed by the electron beam effect on the surface of optical glass by atomic force microscopy, which allows determining with sufficient accuracy and reliability the geometric parameters of such structures.
2.
Experiment methodology
The objects under study were plane-parallel plates of circular shape (diameter 20 mm and thickness 2; 4; 6 mm) made of K8 optical glass (analog Schott Glass BK7) and a rectangular photographic plate (25201 mm).
Electron-beam modification was carried out on a special laboratory setup (ISTC «Micronanotechnologies and equipment», ChSTU, Cherkasy), containing the Pierce Electron Gun.
A plate made of optical glass (base), preheated to a temperature of 840 K (K8, photographic plate), was rotated in a vacuum chamber above an electron gun with the help of a rotational movement mechanism. The substrate moved nonstop above the electron gun. At the same time, the surface was affected by the low-energy ribbon-shaped electron flow (width 3.0 mm, length 60.0 mm). Electron beam exposure was carried out in the following modes: accelerating voltage 3,5…4,0 kV; electron flow current 175…200 mA; cathode heating current 14,5 А; electron flow rate 4,5…5,0 sm/s; the distance from the anode of the electron gun to the surface being processed is 40 mm; single pass treatment.
CSC12», by the system of micro-positioning and a Logitech integrated long-focusing optical microscope.
The method of determining the characteristics of the surface layer of materials allows determining and controlling the thickness of the gradient layer, the topology of the interface “gradient layer - the basis of the material”, surface microrelief, etc. and is unique in essence, since it allows to obtain high-precision results of microgeometry values and characteristics of the surface layer with a thickness of 10 nm to 6 μm. To determine the characteristics of a gradient layer that forms on the surface of optical glass, an experimental-calculation technique is used based on a certain degree of probe slippage over the sample (in fact, complex bending and torsional moments occurring in the cantilever) as a result of friction forces 11.
In general, the preparation of AFM and samples for the research of thin surface structures on them, as well as the scanning of the surface in dynamic and static modes, are carried out similarly to the steps carried out for the integrated control of the characteristics of optical materials 11. The main difference in the sample preparation procedure is that for gradient structures, the use of chemical-mechanical treatment is unacceptable because of the possibility of significant damage to surfaces 12.
In order to correctly select the parameters of load and delay in determining the mode of monitoring the characteristics at the first stage of research, it is necessary to establish the thickness of the gradient layer as accurately as possible 13.
For this, depending on the type of gradient layer (discrete or solid), you can apply two approaches. Determining the thickness of a discrete layer using the method of AFM is carried out in the following sequence.
after preparing the sample and installing it on the AFM stage, turning on the device and launching the "SurfaceScan" control program on the "Area" panel of the control program, select the scan area with a clearly defined feature of the applied coating;
departing from this boundary in the direction of the gradient at a distance of 1.5 – 2 microns, they automatically lead the probe to the surface in static mode by pressing the "Auto Z Approach" button on the "Main" panel;
fter the completion of the automatic summing process on the "Main" panel, pressing the manual up-down buttons with a minimum step of 0.2 nm reaches a value that is half the indications of the "Z" indicator on the "Indicators" panel;
conduct manual removal of the probe from the surface at 1000 steps (that is, at a distance of 0.2 μm);
moving the probe relative to the boundary of the applied coating towards the surface without a gradient layer (as in the previous case - at a distance of 1.5 - 2 microns from this boundary);
in manual mode, the probe is brought to the surface by 1000 steps (0.2 μm) and further, step by step, until the reading of the "Z" indicator on the "Indicators" panel changes its value (will correspond to the distance of the beginning of the action of the intermolecular interaction forces - the distance to the surface of the order of 0.5 –1 nm);
according to the formula: h = m.k, where h – thickness of the studied structure, nm; m – the number of steps taken in manual mode by the operator when leading the AFM probe to the surface; k – minimum distance at which the probe approaches the surface in one step (k = 0,2 nm); calculate the probable thickness of the gradient layer.
The absolute error of determining the thickness of the layer by this method does not exceed 1 nm.
In the case of a solid gradient layer, its thickness is determined by the AFM method as follows.
after preparing the sample and installing it on the AFM stage, turn on the device and run the "SurfaceScan" control program. In the "Area" panel of the control program, an area is selected and a point on it at which the determination of the layer thickness will be carried out;
the spectroscopy procedure is selected at the point on the "Main" panel;
the spectroscopy procedure is automatically performed at the point when the "Start" button is pressed on the "Main" panel;
after completion of the procedure and graphical construction of the static power spectroscopy function in the visualization window of the measured data "View spectroscopy data" (Fig.1), the AFM device automatically stops working. The data obtained in the graph can be saved on disk in text or graphic format using the file save dialog;
according to the graph (Fig.1) determine the possible thickness h of the researched gradient layer.
Fig.1. Visualization window of static power spectroscopy
The thickness of the coatings obtained is checked by the resonant-acoustic method [13] on the «ИТГП-1М» instrument, which confirms the high accuracy of the method for determining the thickness of the gradient layer in optical surfaces described in the work.
Determination of geometric parameters of gradient structures. To determine the geometrical parameters of the gradient structures, after sample preparation and AFM adjustment for operation, the surfaces to be examined are scanned to select the place of the tribological research. Further, by selecting the operation mode of the device “Tribological Line”, the line for conducting the study is determined - a homogeneous surface without inclusions and abrupt differences in relief. At the same time, increasing load should be
specified (0,3 – 1 mN), load time (1,5 –
6 ms) and the number of tribological lines (tracks) – from 3 to 5 15.
other hand, this is the ratio of multiplication of the wiping track width l by the probe load force P to the multiplication of its height h by the track surface area S and the effective Young's modulus of sample E): n = (l.P) / (h.S.E).
Thus, the above method for determining the geometric parameters of the gradient structures of optical materials using the AFM method allows determining the thickness of such gradient layers, refractive index, etc. with an accuracy of 8–12%.
3.
Results and discussion
As a result of the experiments conducted and the study of their results, the thickness was determined and the averaged value of the refractive index was calculated on samples of optical glass K8 and photographic plates. The thickness and refractive index of the gradient structure on the optical glass was determined by the sclerometric method under the following conditions: probe load when exposed to K8 glass – 6,2·10-4 N; when acting on a photographic plate – 6,4·10-4 N. The AFM images of the result of sclerometry on the K8 optical glass are shown in Fig.2.
Fig 2. AFM images (a) and Topogram (b) of the result of sclerometric determination of the thickness of the gradient structure
on the K8 optical glass
As can be seen from Fig. 2, the intensity of the tracks obtained as a result of the action of the probe and the surface area of the surface increases and is continuous, which indicates the homogeneity of the density distribution of the material over the thickness of the optical glass (i.e., the gradient structure should gradually (not discretely) change the refractive index over its thickness), and, accordingly, the high accuracy of determining the refractive index n, which was confirmed by an alternative method for determining the refractive index, namely, by the goniometric method. (device: Г-5). In general, studies of single-type samples, which were carried out in series, showed a high convergence of the results of determining the refractive index, the value of which for different samples is given in tabl.1.
Tabl. 1. The results of the study of gradient structures in optical glass К8
Sample number Estimated gradient layer thickness, μm
Refractive index (averaged value), n
Estimated value The value is obtained by goniometric method (Г-5)
Sample 1 15,6 1,85 1,9
Sample 2 18,3 1,93 2,0
Sample 3 19,0 2,01 2,0
Sample 4 21,5 2,11 1,95
Sample 5 25,8 1,92 2,0
Reference sample 32,4 2,05 2,1
As can be seen from the data presented in table 1, the accuracy of determining the refractive index correlates with the values obtained by the goniometric method (the discrepancy between the calculated and goniometric values does not exceed 8%). Similar results have also taken place for researches carried out for photographic plates.
According to the results of the study, it is clear that the calculated values of the refractive index are somewhat higher than the goniometric ones. This may be due to the fact that for optical glass, the hardness of which is commensurate with the hardness of the indenter, the probe “sticks” on the surface and leads to a slight (about 3-8%) increase in the refractive index compared to goniometric data. However, taking into account the subjectivity of determining the refractive index (determined in arbitrary units), the
discrepancy between the calculated and alternative method values of the refractive index can be considered as acceptable, and the data obtained by the proposed sclerometry method correspond to reality.
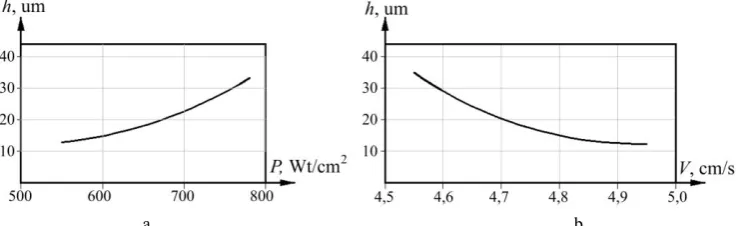
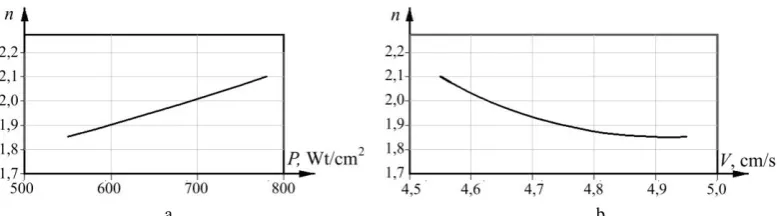
In parallel with determining the thickness of the gradient layer and calculating the refractive index of the gradient structures in optical glass, a connection was established between the modes of electron-beam modifying (specific power Р, kW/m2 and the speed
of the electron flow V, sm/s) the optical glass surface and the thickness h (Fig.3) and the refractive index n of the gradient structure in the glass (Fig.4).
It has been established (Fig.3, Fig.4) that with an increase in the specific power, a nonlinear increase in the thickness of the gradient structure occurs, whereas the refractive index also increases with the increase in specific power, but almost linearly.
а. b.
а. b.
Fig. 4. The dependence of the change in the averaged value of the refractive index n of the n gradient structure in optical glass on the specific power P (a) and speed V (b) of the electron flow
At the same time, an increase in the electron flow rate leads to a nonlinear decrease in both the thickness of the gradient structure and the refractive index.
Such patterns (Fig.3, Fig.4), according to the authors, are associated with time and energy flow acting on the surface of optical glass. Thus, with an increase in heat flux, or a decrease in exposure time, the heating of optical glass increases, which leads both to a change in the chemical composition (volatile ions evaporate from the surface, while the concentration of heavy ions increases) and to change its physical characteristics (the melted glass layer, as well as the reduction of microdefects and pores in the surface layer). It should be borne in mind that, unlike metals, the heating of which takes place in a very short time, optical glass, having a relatively small thermal conductivity and a large heat capacity, warms up much slower. The selection of electron beam exposure modes allows you to control the penetration depth, as well as the law of heat distribution (respectively, the optical density of the material) across the thickness of the optical glass, is the basis of the theory of creating gradient structures in an optical material.
4.
Conclusion
As a result of the research, the expediency of using the atomic force microscopy method to determine the geometric parameters of gradient microlayers formed in the surfaces of optical materials by the method of their electron-beam modifying was substantiated. To this end, the article presents a method for determining the basic geometric parameters (thickness of the gradient layer and refractive index) of gradient structures based on the atomic force microscopy method. The proposed method is based on the principle of the complex application of various modes of operation of an atomic-force microscope in one measurement cycle.
Regularities between changes in the refractive index and modes of conducting electron-beam modifying the surface of optical glass, as well as between the modes of electron-beam action and the geometric parameters of the gradient structure on glass (thickness and averaged value of the refractive index of the gradient structure) are established.
Comparison of the obtained results with the results of determining the thickness of the gradient layer and the averaged value of the refractive index obtained by the alternative method of goniometry on the Г-5 device showed high accuracy (the relative error between the results obtained by various methods did not exceed 8%) reliability (probability of failure-free determination of values by the method of AFM, not less than 0,95) and the adequacy of the proposed method.
5.
Literature
1. Pokryttia u pryladobuduvanni (Coatings in instrument making) [Tekst]: monohrafiia / V.S.Antoniuk, H.S.Tymchyk, Yu.Iu.Bondarenko, Yu.I.Kovalenko, M.O.Bondarenko ta in. // K.: NTUU «KPI», 2016. – 360 s.
2. Tekhnolohichni osnovy otrymannia metalizovanykh pokryttiv na vyrobakh mikrooptyky ta nanoelektroniky elektronno-promenevym metodom (Technological bases for obtaining metallized coatings on micro-optical products and nanoelectronics by electron-beam method) / V.A.Vashchenko, H.V.Kanashevych, S.M.Vashchenko, M.O.Bondarenko i dr. // Zvit z NDR (MONU); № DR 0103U003689. – Kiyv, 2004. – 63 s.
3. Specіal'nі metodi obrobki optichnogo skla (Special methods of optical glass processing) [Tekst]: monohrafiia / G.V.Kanashevich, D.І.Kotel'nіkov, V.A.Vashchenko; pіd red. Profess. D.І. Kotel'nikova. – CHernіgіv: “Sіvers'ka dumka”, 2002. – 215 s. 4. Pryklady zastosuvannia fizychnykh metodiv doslidzhennia struktury poverkhni (Examples of the application of physical methods for studying the structure of the surface) [Tekst]: monohrafiia / H.M.Dubrovska, N.I.Bozhko, M.O.Bondarenko, H.V.Kanashevych ta in. // Silkhet: Shobuzh Biponi, Udoun Ofset Prynters, 2007. – 248 s.
5. Fynn A.M. Rekonstruktsyia ostatochnыkh napriazhenyi v hradyentnыkh sredakh pry prodolnom prosvechyvanyy (Reconstruction of residual stresses in gradient media with longitudinal translucency) [Tekst]: monohrafiia. - SPbHPU, 2005. – 77s.
6. Bondarenko M. Peculiarities of metalized surfaces modification of silicon elements of microelectromechanical systems with low-power electronic flow / M.Bondarenko, I.Bondarenko, V.Antoniuk etc. // Materials science. Non-equilibrium phase transformations. – 2017. – Year III. – Issue 2. – pp.53-55.
7. Yatsenko I., Antoniuk V., Bondarenko M., Vashchenko V. Influence of parameters by electronic ray on properties of superficial layers of optical elements of exact instrument-making, in Proc. Intern. scien.-tech. conf. “Innovations in ingeneering”, 9-12 september 2015. – Burgas, Bulgaria. – Vol. 20/183. – 2015. – pp. 64-66.
8. Kanashevich G.V. Tekhnologichni mozhlivost elektronno-promenevo obrobki optichnogo skla (Technological possibilities of electron beam processing of optical glass) / Visnik CHITI, 1998, No.3. – S. 48-55.
(Development of elements of integrated-optical circuits by new methods based on electron-beam processing) / V.N.Lisochenko, G.V.Kanashevich, V.A.Vashchenko i dr. // Otchet po NIR Cherkasskogo filiala KPI. – Cherkassy, 1993. – 205 s.
10. Yurkovych N.V., Mar‟yan M.I. The processes formation of thin-film heterogeneous structures based on Ge2S3 glass in
dependence of the technologies conditions of their preparation. – Uzhhorod University Scientific Herald. Series Physics. – Iss. 28, 2010. – рр. 64 – 69.
11. Diagnostics of functional layers in products of micro-optics and nanoelectronics obtained by electronic technologies (Diagnostics of functional layers in the products of micro-optics and nanoelectronics obtained by electronic technologies) / V.A.Vashchenko, H.V.Kanashevych, M.O.Bondarenko i dr. // Zvit z NDR (MONU); № DR 0106U004500. – Cherkassy, 2008. –192 s. 12. Kovalenko Yu.I., Bondarenko M.O., Bondaren-ko Yu.Iu.,
Vplyv rezhymiv ultrazvukovoho ochyshchennia
p„iezoelektrychnykh elementiv na yakist sformovanykh na yikhnikh poverkhniakh sribnykh elektrodiv (Influence of modes of ultrasonic cleaning of piezoelectric elements on the quality of silver electrodes formed on their surfaces) // Visnyk Natsionalnoho tekhnichnoho universytetu Ukrainy “Kyivskyi politekhnichnyi instytut”. Mashynobuduvannia, № 64, 2012. – s. 87-90.
13.Bondarenko M.O., Vashchenko V.A., Reva Y.A., Bondarenko Yu.Iu. Metodyka yzmerenyia tolshchyn tonkykh nesploshnykh
pokrytyi na dyelektrycheskykh poverkhnostiakh metodom atomno-sylovoi mykroskopyy (Method of measuring the thickness of thin non-permeable coatings on dielectric surfaces by atomic force microscopy), na XVIII mezhdunar. konf. Sovremennye metody y sredstva nerazrush. kontrolia y tekhnycheskoi diahnostyky, Yalta, 2010, s. 209-212.
14.M.O. Bondarenko ta in. Otsinka adheziinoi mitsnosti na styrannia oksydnykh pokryttiv na optychnomu skli metodom atomno-sylovoi mikroskopii (Estimation of adhesive strength for abrasion of oxide coatings on optical glass by atomic force
microscopy), na XII mizhnar. nauk.-tekhn. konf.
Pryladobuduvannia: stan i perspektyvy, Kyiv, 2013, s. 207. 15. S.A. Bylokon, M.A. Bondarenko, V.A. Andryenko, ta V.S. Antoniuk Yssledovanye mykrotverdosty tonkykh plenok metodom nanoyndentyrovanyia s pomoshchiu atomno-sylovoi mykroskopyy (Investigation of Microhardness of Thin Films by Nanoindentation by Nuclear Force Microscopy), na XIII mezhdunar. nauchno-prakt. konf. Kachestvo, standartyzatsyia, kontrol: teoryia y praktyka. – Kyev, 2013. – s. 20-21.