http://www.sciencepublishinggroup.com/j/sr doi: 10.11648/j.sr.20170501.11
ISSN: 2329-0935 (Print); ISSN: 2329-0927 (Online)
Estimation of Economic Order Quantity with Variable
Parameters (Ukraine Case Study)
Andrii Halkin
Department of Transport Systems and Logistics, O. M. Beketov National University of Urban Economy in Kharkiv, Kharkv, Ukraine
Email address:
To cite this article:
Andrii Halkin. Estimation of Economic Order Quantity with Variable Parameters (Ukraine Case Study). Science Research.
Vol. 5, No. 1, 2017, pp. 1-5. doi: 10.11648/j.sr.20170501.11
Received: October 31, 2016; Accepted: February 9, 2017; Published: March 4, 2017
Abstract:
The optimal order quantity is the one of the main logistics tasks that takes place in modern theory and practice. Variety of consumers with its own demand and irregularity of consumption during the year exponentially increase number and times of calculation of economic order quantity. These complicate the EOQ decisions. At the same time, variation of the costs throw this process complicate this tacks exponentially. Using regression model for describe order cost and holding cost per unit simply calculations and consider its variability character.Keywords: Decision, Order, Effectiveness, Logistics, Variable, Logistics, Model
1. Introduction
Current global crisis has affected firms’ behaviour on markets, forcing them to search for rational ways planning their business. Stochastic demand and constant variability of buyer behaviour [1] have multiple complicatedness decisions of supply-production-distribution process. The system effect can be explored while examining the logistic chain interrelation on vehicle’s and storage parameters for optimal order quantity (EOQ) example. Wilson’s model [2] use fixed cost per order and fixed holding costs. But, up-today changeable conditions reasonable indicate on variation of transport and storage component.
Irregularity of demand caused technological reaction of supply chain. Change of vehicle’s carrying capacity, distance of transportation, cargo class and other factors lead to different delivery cost and, as a result, different cost per order that constantly affects EOQ. Holding cost per unit is variable due to different fixed costs of different number of units in stock per period. Increase of stock level will decrease maintenance of cost per unit [3]. In outsourcing variant can be used different warehouse with its own cost per ton of maintaining and vice versa decrease of material flow (MF) increase holding costs. Technologies of logistics process have to put first in calculation of any supply variant [4]. Every of possible technological option has its own EOQ and costs. Thus, can conclude, that technological oriented approach for
EOQ require further development.
In this paper, put cost per order and holding cost as a function that depends on technological parameters of transport and storage participants. Therefore, the modify EOQ have been obtained.
Obtained results prove unstable and variability of Wilson’s model parameters and necessary to consider of technological component in EOQ-model.
2. Literature Review
Researches classified EOQ problem to operations management and inventory theory. It presents classical example of solution of the conflict goals between finding the optimal value of total costs and minimal level of spending. Classical way of calculation has presented by Wilson [2]:
cos
2⋅ ⋅
= МПпот ordMF
opt МF
t
q С
Q
С (1)
where MF пот
q – demand quantity, units / month;
MF ord
С – cost per order, setup cost dol. / Order;
cos
МF t
С – holding cost per unit, dol./Unit.
Multi-decision choice on orders was presented by [1]. This approach allows optimizing buyers and sellers goals according different ordering strategy. Further development obtained the multi-criteria EOQ models in [7] where have been minimizing the full cost, shortages, inventory order, etc. for all participants.
75% of supply chain participants working on its operations optimization to decrease costs of order scope [1]. To asses optimal inventory levels with variable demand used newsvendor models [9], when demand varies over time – the dynamic lot-size model [10]. Modify EOQ model, estimate the money demand dependence equal to money inventory [11]. Elements of project analysis approach in EOQ solutions which considered time-value of money was presented in [12].
Technological approaches to EOQ are based on solution for decreasing the logistics costs and gaining considerable competitive advantage by these actions describe in [13]. Additional goals achieved in minimizing expenses of transportation component by fully use of vehicle capacity [4], minimizing of non-production movement of vehicles [14], rationale distribution MF and support operations [15]. Simultaneously, these actions give additional advantages for buyers in possible discounts [1]. Stimulating for more ordering provides all-unit quantity discounts [16] according to the full truckload. However, the various factors impact on transport and storage process (volume, distance, timestorage area, etc.) should be reflected for order decision.
References analysis shows that for numerous interpretations of Wilson’s model, still have unknown options of its improving. Technological process of any delivery consists of many operations [13, 16, 17] that create its added value and delivery cost. Any varying of terms, specification of operations, technology of delivery, transportation, storage, handling, routes, material flow parameters, risks factors or either lead to changes in costs per order or holding cost per unit which affects EOQ value. Every day planning process activity faced with numerous of this changes which force to re-planning avoiding efficiency decrease. In this case, understanding of EOQ regularities changing on technology gives extra credit for sustainable development of any logistics system functioning.
3. Theoretical Aspects of Parameter’s
Study in Logistics Chains
Consider technological process complicates EOQ calculations and selection. It is important to understand the logistics chain requirements to transportation and storage and vice versa technological parameters influence on logistics, fig. 1
Figure 1. Interrelation of EQO depends on parameters of technology of transportation and storage.
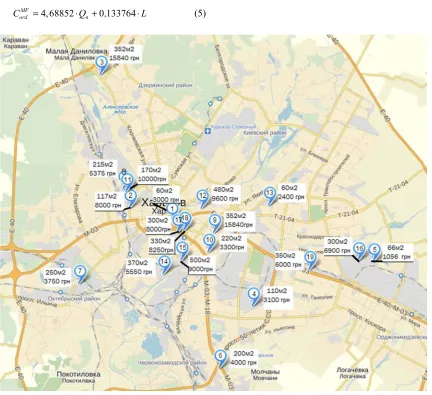
Transport service cost (TSC) formation is based for calculation of order cost. The transportation service cost value TSC size depends of many factors: distance transportation; bulk cargo; bulk density of cargo; carrying capacity of the vehicle; total distance; type of vehicle; an area of transportation service (fig. 2). In general, the cost per order depends and defunds on TSC function was presented in [17].
Figure 2. The transportation service cost characteristics [17].
There are different approaches to the TSC formation [3, 14, 17-22], which can be divided: the cost, by added value [18, 20], a market approach [18] and logistics approach [16].
Describe cost per order as function on technology:
1 1
( , ,..., ) MF
ord b
С = f x x x , (2)
where x x1, 2,...,xb – factors influencing on cost per order. According to fig. 2 model’s factors can be interpreted as:
X1 – Transportation distance; X2 – Bulk cargo transport; X3
– Class load; X4– The vehicle capacity; X5 – Total distance;
X6 – The type of vehicle; X7 – The transportation service
area.
Different vehicles has different parameters: carrying capacity, average fuel consumption, purchase price, the physical volume, types of loading and unloading, maintenance costs, quantity of berths and others, which are interconnected with each other. Change in one of them leads to change in transportation technology and economical component. The vehicle’s capacity change leads to changes EOQ. Increase in carrying capacity decrease of cost of one tone transportation, and increase stocks simultaneously increase holding costs, without changing the consumption demand.
The most obvious holding costs include next factors: rent for the required space [21]; materials, equipment [22]; insurance and risks [23]; security; interest on money invested in the inventory and space [11], and other direct expenses [24].
Describe holding cost as rent cost per ton function on technology factors:
cos ( ,1 2,..., )
МF
t a
С = f y y y (3)
where y y1, 2,...,ya – factors influencing on holding cost per
unit.
y1 – rent for the required space; y2– materials, equipment;
y3 –operate space; y4– insurance; y5 – security; y6– interest
on money invested in the inventory and space; y7 – other
direct expenses.
The EOQ-model (1), according to obtained models (2, 3), can be written as:
1 1
1 2 cos
2 2 ( , ,..., )
( , ,..., )
МП MF МП
пот ord пот b
opt МF
a t
q С q f x x x
Q
f y y y
С
⋅ ⋅ ⋅ ⋅
= = (4)
Costs parameters could be set by determined model also. Dependence of costs from order equinity creates new classified of tasks that can be described as multi-parameters optimization.
4. Method Application
The application of theory development The real data of different carriers was analysed according on site: «www.della.ua». According to it analysis we choose most important factors that influence on TSC: distance, vehicle capacity, faire. Calculation results that carried out using the statistical method presented as a model:
4, 68852 0 133764 MF
ord n
C = ⋅Q ,+ ⋅L (5)
where qn – vehicle capacity, ton; L – distance of transportation, km.
Obtained model describe variation of order cost on vehicle capacity and distance of transportation. Main characteristics are presented in table. 1. Limits of data variations for
Qn: 3-22,5 ton; L: 17-221 km.
Table 1. Model characteristics cost per order on vehicle capacity and distance of transportation.
Parameter Estimate Standard Error T-Statistic P-Value
Qn 0,133764 0,0519603 2,57434 0,0158
L 4,68852 0,750115 6,2504 0,0000
We researched of free estate space for storage and its cost for costs in Ukraine, fig. 3. There are 18 measurements have been made: Rent per mount and estate storage offers and its rent have been collected in Kharkiv. The statistics methods were used for data processing. Thus, holding costs model has been found:
0,362 cos 14, 276
МF МП
t storg
С = ⋅q − (6)
where qstorgМП - storage volume, ton.
Figure 4. Dependence of holding costs per 1 ton on storage volume in various operators.
The EOQ-model (1), according to obtained models (5, 6), can be written as:
0,362 cos
2 2 (4, 68852 0 133764 )
(14, 276 )
МП MF МП
пот ord пот
opt МF МП
t storg
q С q Qn , L
Q
С q −
⋅ ⋅ ⋅ ⋅ ⋅ + ⋅
= =
⋅ (7)
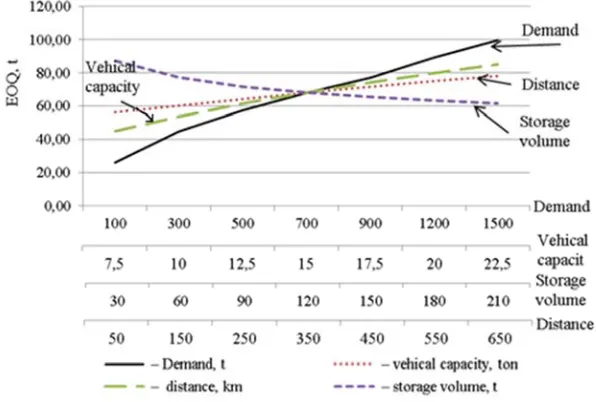
EOQ parameters described in eq. 1 like a function and presented as variable units. Change of condition of transportation or storage lead to EOQ changes. Graphical interpretation (fig. 5) allows finding variation of technological parameters influence on EOQ. We used characteristics graph which defined influence of each of several parameters (demand, distance, storage volume, vehicle capacity) on resulting one (EOQ) throw proposed model. Exploring of each parameter is made without changes of others. Results indicating that vehicle’s capacity, distance of transportation and demand have direct affects EOQ, volume of storage has reverse one. Angle of slope of each relationship described the degree of influence of it on EOQ.
Figure 5. Variation of technological parameters affects EOQ.
Moreover, modify EOQ model considers real environment components (storage and transportation data) that depend on Ukrainian market conditions on summer 2016. Obtained model can be used for rapid calculation, but for more detailed asses of costs it needs to calculate every single variant of technological interaction. We made calculations on raw materials supply example.
5. Discussion
Factor’s sensitivity analysis of EOQ model was used in [25] for supplier selection problem. Authors describe variable character of factors in [26] but they are not based on a specific transportation and storage technology.
A limitation of this paper is the limited data and parameters what have been used for modelling. Future research should extend data for different regions and other factors that can affect model. More over obtained data actual for current economical situation in Ukraine and can be change in future. Also, for other countries, multimodal
transportation it would be different. In this case, paper present only approach for EOQ forming according to presented factors.
EOQ decision tasks tacking into account: 1) delivery costs primarily purchase price, that do not depend on the size of the party and 2) expenses for the maintenance of stocks are directly proportional to their size, which were before described as assumptions and limitations in existing models.
6. Conclusions
References
[1] Altintas, N.; Erhun, F.; Tayur, S. (2008) Quantity Discounts Under Demand Uncertainty. Management Science. 54 (4): 777–792. doi:10.1287/mnsc.1070.0829.
[2] Wilson, R. H. (1943) A Scientific Routine for Stock Control.
Harvard Business Review. (13): 116—128.
[3] Mirotin L. B. & Tashbayev I. E. (2002) Systemic analysis in logistics. Moscow: Examination Publishing.
[4] Halavan L. (2007) Criteria logistics efficiency. Journal of Distribution and Logistics. 4 (11): p. 8–14.
[5] Tayur, S. (2000). Improving Operations and Quoting Accurate Lead Times in a Laminate Plant. Interfaces. 30 (5), p. 1–15. [6] Zipkin P. H. (2000) Foundations of Inventory Management,
Boston: McGraw Hill, ISBN 0-256-11379-3
[7] Malakooti, B. (2013) Operations and Production Systems with Multiple Objectives. John Wiley & Sons.
[8] Stevenson W. (2009) Operations Management. 10th ed. – 581. [9] Harvey M. Wagner and Thomson M. Whitin (1958) Dynamic
version of the economic lot size model / Management Science, Vol. 5, p. 89–96.
[10] Caplin, A., & Leahy, J. (2010). Economic Theory and the World of Practice: A Celebration of the (S, s) Model. The Journal of Economic Perspectives, 24(1), p.183-202.
[11] Trippi, R. and Lewin, D. (1974) A Present Value Formulation of the Classical Economic Order Quantity Problem, Decision Sciences, 5(1), p. 30-35. URL:
http://www.sigma-research.com/misc/A%20Present%20Value%20Formulation% 20of%20the%20Classical%20EOQ%20Problem.htm
[12] Adesso Solutions. 2005. A double-edged sword. Bus. Credit 107 (9), p. 56–59.
[13] Davidich Yu. O. (2010). Rozrobka grafіka Ruhu the agriculture zasobіv at organіzatsії vantazhnih transported. Kharkiv: KhUMG. – 346 p.
[14] Monk, E. & Wagner, B. (2006) Concepts in Enterprise Resource Planning. Canada: Thomson Course Technology. [15] Erhun, F., & Tayur, S. (2003). Enterprise-wide optimization of
total landed cost at a grocery retailer. Operations Research,
51(3), 343-353.
[16] Galkin A. Kush Y., Dolya V. (2014) Several logistics chains transportation services approach by single transport company.
Journal L' Association 1901 “SEPIKE”. № 4. p. 86-90. [17] Rushton, A., Croucher, P. and Baker, P. (2010). The handbook
of logistics & distribution management. London: Kogan Page.
[18] Grigorov, М., Gavrilov, E., Grigorova, Т. & Dolya, V. (2006), Prediction of the design characteristics of the design and operation of highways: Monograph. Naddnepryanochka, Kherson, Ukraine.
[19] Ronald H. Ballou, Srivastava S. (2007) Business Logistics: Supply Chain Management. Pearson Education
[20] Johnson, J. and Johnson, J. (1999), Contemporary logistics. Upper Saddle River, NJ: Prentice Hall.
[21] Filina-Dawidowicz, L., & Postan, M. (2016). Optimal inventory control for perishable items under additional cost for deterioration reduction. LogForum, 12.
[22] Litomin, I., Tolmachov, I., & Galkin, A. (2016). Use of the Distribution Center in the Ukrainian Distribution System.
Transportation Research Procedia, 16, p. 313-322.
[23] Vakulenko K., Galkin A., Kush Ev., Prunenko D., Bibik N. Dolia V., (2016) Logistics approach to working capital management / Logistyka I jakość. Procesy doskonalące zarządzenie: Monografia // Lublin: Wydział Ekonomiczny Uniwersytetu Marii Curie-Skłodowskiej. – p. 442-455. [24] Kannan, D., Khodaverdi, R., Olfat, L., Jafarian, A., & Diabat,
A. (2013). Integrated fuzzy multi criteria decision making method and multi-objective programming approach for supplier selection and order allocation in a green supply chain.
Journal of Cleaner Production, 47, 355-367.
[25] Qin, Z., & Kar, S. (2013). Single-period inventory problem under uncertain environment. Applied Mathematics and Computation, 219(18), p. 9630-9638.
[26] Sarkar, B., & Moon, I. (2014). Improved quality, setup cost reduction, and variable backorder costs in an imperfect production process. International Journal of Production Economics, 155, p. 204-213.
![Figure 2. The transportation service cost characteristics [17].](https://thumb-us.123doks.com/thumbv2/123dok_us/8575697.1717707/2.595.311.547.184.300/figure-transportation-service-cost-characteristics.webp)