1. Introduction
In today’s world of fast-moving global economy and fierce competition, maintenance has been recognized as a key factor to quickly respond to market opportunities. Maintenance is no longer regarded as being a necessary evil concerned primarily with corrective actions, but rather as a means to an end, which significantly contributes to the achievement of the organization’s main objectives. Maintenance involves actions to control or prevent deterioration process that may lead to device failures and returns that equipment to its operational condition through corrective maintenance [1]. The importance of maintenance becomes greater due to its unique role in preserving and improving product quality, accessibility, and also safety requirements. Therefore, selecting the appropriate maintenance strategies is one the most important decision-making activities in various industries [2]. Maintenance in factories and industrial places plays a critical role to determine productivity. The main aim of maintenance is reaching to the least failures and keep devices at the lowest possible cost of operating condition. Therefore, maintenance shouldn’t be considered as a costly activity, but also consider as a profit generating operation. Maintenance also increases different aspects of business like productivity
Corresponding author
E-mail address: Reza.vasili@hotmail.com DOI: 10.22105/jarie.2018.79157
Sustainable Reliability Centered Maintenance Optimization
Considering Risk Attitude
Ali Karevan1, Mohammadreza Vasili2
1Department of Industrial Engineering, Islamic Azad University, Najafabad Branch, Iran. 2Department of Industrial Engineering, Islamic Azad University, Lenjan Branch, Isfahan, Iran.
A B S T R A C T P A P E R I N F O
Maintenance costs are one of the major costs in plants and companies. The observation in many cases illustrates the lack of plans or mistakes in maintenance activities that incurred great costs. In this study, the number of equipment failures have been determined. Then the failure rate and reliability of each equipment are calculated. The third step calculates total system reliability so the initial plan is presented. After that, by using the obtained information, the sustainability aspects of the program will generate and the maintenance costs and sustainability functions will assess. At the end, this multi-objective optimization problem is solved by MOPSO algorithm and the results are compared with a simulation method. As a result, with this reliability centered maintenance program, the reliability of each equipment, as well as the whole system are improved; economic aspect of sustainability and customer satisfaction are increased; environmental pollutions and maintenance costs are decreased by offering more reliability based program; a scheduling plan for each maintenance procedures is provided and also more stable internet connection is established by reducing the system failures.
Chronicle:
Received: 06 July 2018 Revised: 16 August 2018
Accepted:11 November 2018
Keywords:
Sustainability. Reliability. Maintenance. Risk Attitude.
Multi-objective Particle Swarm Optimization.
Internet Telecommunications Equipment.
Journal of Applied Research on Industrial
Engineering
and profitability. The loss output of a day that arising from an unplanned stop, never reverses without additional costs such as overtime working and rewards to employees [3].
Various approaches have been investigated by researchers to cope with maintenance problems in the past decades as the concept has gained popularity. These may include lean maintenance and Total Productive Maintenance (TPM) [4]; proactive maintenance [5]; predictive maintenance [6]; Risk-Based Maintenance (RBM) [7]; agile maintenance [8]; selective maintenance [9]; virtual maintenance [10], and so on.
In the past decades, social, cultural, and technological changes have contributed to emergence of quantitative treatments and rational frameworks for the reliability analysis of engineered systems [11]. Numerous books and papers are witnesses of this fact [12-14]. In this regard, Reliability Centered Maintenance (RCM) is an effective way to proceed for establishing maintenance programs in practice [15, 16]. It directs maintenance efforts towards those systems and sub-systems which are critical in terms of reliability, production regularity, and safety [11]. However, the basic approaches are not sufficient to cope with many realistic settings. Therefore, many of their extensions have been considered and extensively studied [17-19].
Many studies have focused on development of maintenance optimization models to identify the best suitable maintenance actions and strategies [20-23]. Such models can be of different types, but they are all tools for balancing costs and benefits. By investigating the relationship between costs and benefits associated with each maintenance alternative, the optimal blend of maintenance strategies can be determined [24].
Recently, the concept of sustainability has attracted much attention of both academics and practitioners, however contributions which apply this concept in maintenance problems are very few. Keivanpour and kadi [25] proposed a conceptual framework to simultaneously integrate reliability, economic, environmental and social performance of maintenance activities. Saniuk et al. [26] investigated the role of maintenance in the sustainable developing practices. Ba et al. [22] presented a joint optimization of preventive maintenance and spare parts inventory, while minimizing CO2 emissions. Sabatino et al. [27]
proposed a sustainability-based maintenance optimization problem of highway bridges which provides decision makers with optimal life-cycle maintenance actions. The main objective of their framework was to reduce the extent of the impact of structural failure to sustainability dimensions. Their bi-objective problem was solved using a GA-based optimization approach.
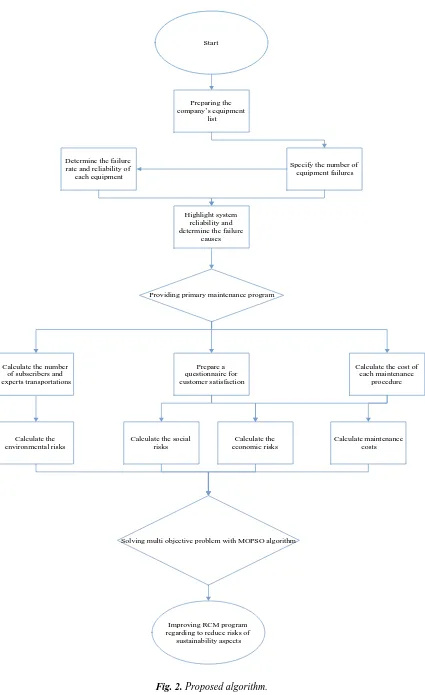
2. Methodology
The methodology of this study is an extension of the work by Sabatino et al. [27] to simultaneously incorporate reliability and sustainably-based procedures into an optimization procedure. The first step is introducing the list of intended equipment or devices and determine the system boundary. In fact, the identified those items that could effect on equipment and system [1]. In next step, maintenance experts need to highlight the potential equipment failures and determine that each equipment suffers what kind of damages and then try to find the critical causes of each of these failures. After that, expert should determine the harmful consequences of these failures [28]. All of this information can be taken by historical archive and general interviews with industrial maintenance experts.
In next step, according to the number of equipment failures during a time period and regarding its distribution, the reliability of each equipment has been specified and as a result, the system reliability can be calculated. After that, the risks of each aspect of sustainability has been identified. This can be done by using questionnaires or interviews with industrialists. It is obvious that the next step would be accessing these identified risks aspects of sustainability.
Eq. (1) calculates the reliability for each equipment and Eq. (2) assesses the most important formula - System Reliability- that creates a connection between two main objectives.
Ri= e−(t/θ) β
(1)
RT= ∏ Ri n
i=1
i = 1, … , n (2)
In the next step, the risks associated with the sustainability dimensions are identified based on experts’ opinions. Eq. (3) denotes the 1st risk attitude for economic impact [29]. This formula calculates the
relaunch equipment costs risk. Eq. (4) denotes the 2nd risk attitude for economic impact [30]. It assesses
lost profits risk due to the dissatisfaction of costumers and the probability of changing their company.
RAECO1(t)=
(1 − RT) ∗ ∑ni=1Ci
(1 + rm)t
, i = 1, … , n (3)
RAECO2(t)=
(1 − RT) ∗ [(nm∗ z ∗ ch∗ fh) + (nm∗ (1 − z) ∗ cf∗ ff)]
(1 + rm)t
(4)
In Eq. (5), MDT shows the mean down time and it will be obtained by 9 different times that involves realization time, access time, diagnosis time, spare part procurement time, replacement time, check out time, alignment time, logistic time, and administrative time [31]. This equation evaluates 1st risk attitude
RASOC1(t) = (1 − RT) ∗ [O1∗ (
TS
100) + O2∗ (1 − TS
100)] ∗ MDT ∗ nm (5)
RASOC2(t) = (1 − Rt) ∗ dm∗ fm (6)
RASOC3(t) = (1 − RT) ∗ [Chh∗ (
TS
100) + Chf∗ (1 − TS
100)] ∗ MDT ∗ nm (7) Eq. (8) and (9) illustrate the carbon dioxide generated risk and the amount of energy consumed risk, respectively [27, 32].
RAENV1(t) = (1 − Rt) ∗ (CD) ∗ [(fm∗ dm) + (fr∗ dr)] (8)
RAENV2(t) = (1 − Rt) ∗ (EC) ∗ [(fm∗ dm) + (fr∗ dr)] (9)
A number of time-based maintenance actions are specified as all possible required actions for the system and its components, so that the final optimal maintenance plan is a set of these actions. A maintenance action is assigned to a component based its desired level of reliability, which itself is based on the percentage failure that can be tolerated by that component as its acceptable failure level. Eq. (10) calculates the maintenance costs for each maintenance action [33].
CMaintenance = ∑ (CM1,i∗ (dD1,i) + CM2,i∗ (dD2,i) + CM3,i∗ (dD3,i)) NC
i
(10)
A maintenance plan details the type and timing of maintenance actions and it desirability depends on the risks-attributes associated with the sustainability dimensions. In other words, the risk-attributes capture the economic, social, and the environmental consequences of failures. However, these risks-attributes are measured with different units and thus are not directly comparable. This implies need for establishing a consistent range of values that each attribute may take. Therefore, the utility theory is used to normalize the value of each attribute to a number between 0 and 1. The formulation of the utility function corresponding to each attribute depends largely on the knowledge and preferential characteristics of the decision maker.
Below, Eqs. (11-17) describe the utility function for each sustainability aspects. They can be risk-aversion (γ>0) and risk-acceptation (γ<0) [27].
URAECO1=
1
1 − exp(−γ)∗ [1 − exp (−γ ∗
RAECO1max− RAECO1
RAECO1max− RAECO1min
)] (11)
URAECO2=
1
1 − exp(−γ)∗ [1 − exp (−γ ∗
RAECO2max− RAECO2
RAECO2max− RAECO2min
)] (12)
URASOC1=
1
1 − exp(−γ)∗ [1 − exp (−γ ∗
RASOC1max− RASOC1
RASOC1max− RASOC1min
)] (13)
URASOC2=
1
1 − exp(−γ)∗ [1 − exp (−γ ∗
RASOC2max− RASOC2
RASOC2max− RASOC2min
URASOC3=
1
1 − exp(−γ)∗ [1 − exp (−γ ∗
RASOC3max− RASOC3
RASOC3max− RASOC3min
)] (15)
URAENV1=
1
1 − exp(−γ)∗ [1 − exp (−γ ∗
RAENV1max− RASOENV1
RAENV1max− RAENV1min
)] (16)
URAENV2=
1
1 − exp(−γ)∗ [1 − exp (−γ ∗
RAENV2max− RAENV2
RAENV2max− RAENV2min
)] (17)
Monotonically decreasing functions are used to effectively represent the relative utility of detrimental consequences of the failures. The final utility function takes into account the weighted relative utility value corresponding to each attribute involved. It is important here to note that each major attribute within the presented approach may be associated with several sub-attributes, which are incorporated into the function by using the same approach as described above.
This function depicts a sustainability metric that effectively weighs the extent of impacts to the economy, society, and the environment. At the end, Eq. (18) illustrates the first objective that describes the amount of sustainability. Each sustainability aspects, based on decision-maker has its own weight (KECO, KSOC and KENV). The summation of both 3 aspects, describes the total sustainability function, and
Eq. (19) shows the second objective that describes the maintenance costs utility function. The higher amount of this 2 objective gives better performance.
US= Max [(KECO1∗ UECO1) + (KECO2∗ UECO2) + (KSOC1∗ USOC1) + (KSOC2∗ USOC2) + (KSOC3
∗ USOC3) + (KENV1∗ UENV1) + (KENV2∗ UENV2)]
(18)
UC= Max (
1
1 − exp(−γ)∗ [1 − exp (−γ ∗
Cmax− CMaintenance
Cmax
)]) (19)
The proposed optimization model is adjusted for the maintenance activities of a local Internet Service Provider (ISP). Through this, an optimal maintenance plan is specified for the ISP’s equipment (i.e. a number of server racks contain multiple electronic modules) that are located in the midtown building of the telecommunications company.
Each single attribute may monotonically decrease functions that are employed to effectively depict the relative utility of detrimental consequences of the failures. A final multi-attribute utility function is developed that considers the weighted relative utility value corresponding to each attribute involved. This function represents a sustainability metric that effectively weighs the contribution of impacts to the economy, society, and the environment.
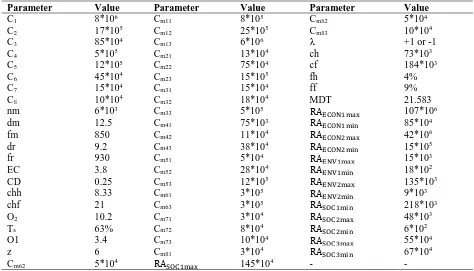
Table 1. Parameter definition.
2.1 Case Study
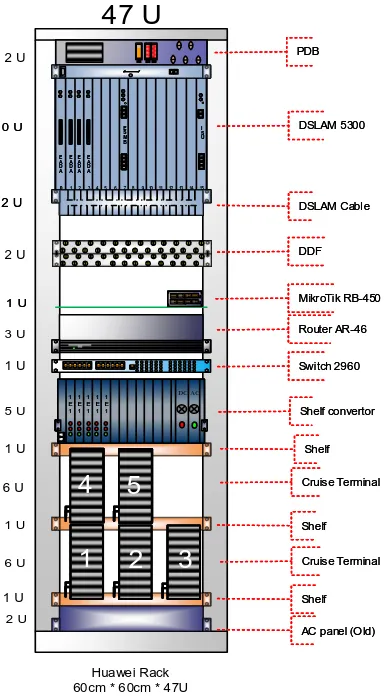
This work performed in Sabanet ISP1 Internet Service Provider Company located in Isfahan, Iran. This company like other ISP companies has a number of racks located in one of the telecommunication’s company’s rooms called PAP room. In these racks, there are some equipment and devices that have connected to each other. Eight equipment are identified in racks. These types of equipment are the first and the most important point to get permission to access the internet. If one of these equipment fails, people who used this ISP couldn’t access the internet. So the most critical place for these companies is performing the best maintenance activities to reduce the failure probability for these equipment. Fig. 1 shows the rack equipment of this ISP Company.
1Internet Service Provider
Symbol Definition Unit
RT System Reliability %
Ci launching Cost for device i $
O1 Usage rate for Household consumers per ADSL line Person O2 Usage rate for Household Corporate per ADSL line Person TS The average household subscribers percentage of total server traffic %
MDT Mean Down Time Hour
nm The number of failure reports announced annually Number dm The average distance of customer's home to the corporate Km2 fm The number of subscribers come to company annually Person dr The average distance of corporate to telecommunications companies Km2 fr The number of experts went to telecommunications companies annually Person
EC The amount of energy consumed Kj/m2
CD The amount of carbon dioxide produced Kg/m2
λ Risk Number
z Failure announced percentage for home subscribers %
ch The average cost per household service $
cf The average cost per corporate service $
fh The dissatisfaction percentage of failures announced with household subscribers % ff The dissatisfaction percentage of failures announced with corporate subscribers %
dDi,j If equipment i order j maintenance method 0,1Variable
CMi,j Maintenance cost for equipment i when j maintenance method perform $
NC Total number of equipment Number
Chh Internet outages cost per hour for household subscribers $
2
3
5
2
2
3
3
4
4
DSLAM 5300 DSLAM 5300 PDB PDB DSLAM Cable DSLAM CableAC panel (Old) AC panel (Old) Shelf convertor Shelf convertor Switch 2960 Switch 2960 Router AR-46 Router AR-46 Cruise Terminal Cruise Terminal
6 U
5
5
1
1
Huawei Rack 60cm * 60cm * 47U
DDF DDF
Mikr oTik RB-450 Mikr oTik RB-450
5 U
2 U
Cruise Terminal Cruise Terminal 1 E 1 1 E 1 1 E 1 1 E 1 1 E 1 1 E 1 1 E 1 1 E 1 1 E 1 1 E 1 DC DC DC ACACAC
1 E 1 1 E 1 1 E 1 1 E 1 1 E 1 DC AC 1 U
1 U
3 U
1 U
1 U
1 U
2 U
47 U
10 U
2 U
10 U
2 U
345678
1 9101112131415 E A D A 0 E A D A 0 E A D A E A D A E A D A E A D A 2 E A D A E A D A E S M B E S M B I S U I S U
2 U
Shelf Shelf Shelf Shelf Shelf Shelf
6 U
1 U
Fig. 1. Rack equipment.
Start
Preparing the company s equipment
list
Determine the failure rate and reliability of
each equipment
Specify the number of equipment failures
Highlight system reliability and determine the failure
causes
Providing primary maintenance program
Calculate the number of subscribers and experts transportations
Prepare a questionnaire for customer satisfaction
Calculate the cost of each maintenance
procedure
Solving multi objective problem with MOPSO algorithm
Improving RCM program regarding to reduce risks of
sustainability aspects Calculate the
environmental risks
Calculate the social risks
Calculate the economic risks
Calculate maintenance costs
3. MOPSO Algorithm
Particle Swarm Optimization (PSO) is a stochastic optimization technique that is similar to evolutionary algorithms. This algorithm has been modeled after the invasion and accumulation of animals and their behaviors. Unlike other methods, PSO doesn’t produce new samples. This algorithm doesn’t select any sample, instead, PSO saves a significant statistically population whose members were optimized in response to new discoveries. This technique was developed by James Kennedy and Russell Eberhart in 90s [35].
Like as differential evolution, PSO almost exclusively works in multidimensional space and on real intervals, because the PSO candidate answers mutated to discover the best solution that really requires a metric space. Due to using in real spaces and because the PSO has been inspired by swarms, PSO algorithm tends to referral to candidate answers as a particle swarms. These particles never die. In contrast, mutations execute in surrounding space and replaced particles. A particle consists of two parts: Particle place in the space and particle velocity. Each particle will start at a random location with a random velocity vector [34].
PSO algorithm is different from evolutionary algorithms. These differences are in the parents’ nature, selecting, and parameter setting method that are mentioned in the following:
In PSO, parents’ information includes the shared particle evolutionary optimization.
PSO doesn’t include an explicit selection function of processing evolutionary optimization.
PSO uses a guided mutation operator to manipulate individuals.
There is no mechanism for PSO to adapt velocity step for the right amount of space.
In MOPSO, the velocity and position update are equals to what has been in a single PSO. All parameters are like PSO algorithm except the objective function that is a multi-objective. The mathematical formula for MOPSO is as follows:
Vit+1= wV
it+ c1r1(xpbest− Xit) + c2r2(xgbest− Xit) (20)
Xit+1= Xit+ Vit+1 (21)
That w equals the inertia weight, c1 is the cognitive acceleration factor, c2 is the social acceleration
factor, r1 and r2 are the random variables between 0 and 1, xpbest isthe best individual particles, xgbest is
the best global particle, Xit equals the current situation of i-th particle in iteration t and Vit+1 is the ith particle velocity in iteration t [35]. Multi-objective particle swarm optimization algorithm basis is as follows:
Create the initial population.
Initialize the velocity each particle.
Evaluate each particle of the population.
Separating non-dominated members of the population and store them in another archive.
Tabulation the discovered purpose.
Each particle of the archive, select the leadership and moves.
The best memory of each particle is updated.
Dominated archive members will be deleted.
If the archive numbers exceed the determined capacity, additional members will be removed
If the conditions are not fulfilled, then returns to Step 5; otherwise, stop the algorithm.
4. Results
In the first step as we highlighted before, we identified the critical equipment and calculate the failure rate and reliability based on the number of failures and mean repair time in 1 year that are demonstrated in Table 2. It must be noted that these values are the current situation of the company. By testing the time between failures of each equipment, the Weibull distribution was used to calculate their reliability. Then the total system reliability was evaluated and showed 0.01546. Then we defined a rule based on the equipment reliability to identify its maintenance actions.
Table 2. Reliability of equipment.
By this rule, the primary maintenance program was presented. Error! Reference source not found. illustrates the current situation of maintenance program based on the equipment reliability. Also, Table 4 defines the amount of each parameter that was assumed in this study. Table 5 shows all times that evaluate Mean Down Time.
Table 3. Primary maintenance program.
Equipment DSLAM DSLAM Card
PDB Fuse
Main
Cable Fan Terminal
Data Pare Wires
Copulative Cables
Number of
Failures 26 29 21 31 17 42 53 25
θ 9.76 7.2 11.1 8.71 7.95 5.82 4.4 7.26
Β 2.48 2.07 2.03 1.84 1.41 2.41 1.24 1.53
Reliability 0.8266 0.6249 0.8203 0.6976 0.5945 0.4998 0.3098 0.5682
If 0.8 ≤ 𝑅𝑖≤ 1.0 , then select the 1st maintenance action.
If 0.5 ≤ 𝑅𝑖≤ 0.8 , then select the 2nd maintenance action.
If 0.0 ≤ 𝑅𝑖≤ 0.5 , then select 3rd maintenance action.
Equipment DSLAM DSLAM
Card
PDB Fuse
Main
Cable Fan Terminal
Data Pare Wires
Copulati ve Cables Reliability 0.8266 0.6249 0.8203 0.6976 0.5945 0.4998 0.3098 0.5682
Maintenance
Table 4. Amount of parameters.
Table 5. Mean down time
.
First, we solved this multi-objective optimization problem with MOPSO with MATLAB (R2015a) software. For our experiments, we utilized a Personal Computer (PC) equipped with an Intel® Core™ i5 5200 @ 2.20 GHz CPU and 8GB of RAM running Microsoft Windows® 10 Ultimate™. Table 6 illustrates the values that used in this algorithm for solving the problem.
Value Parameter Value Parameter Value Parameter 5*104 Cm82 8*105 Cm11 8*106 C1 10*104 Cm83 25*105 Cm12 17*105 C2
Table 6. Values used in the algorithm.
We want to solve this problem either for risk-acceptance models and risk-aversion models. It’s clear that in the different iteration of the algorithm we may take different solutions. Table 7 represents the best solutions that MOPSO found between all possible solutions for risk-acceptance models. As it shows, there are four optimal maintenance programs that are different in their objectives amounts. The goal is to maximize both objectives. All of these solutions give better performance than the current program. This iteration was implemented in 17.449 seconds.
Table 7. Proposed maintenance program with MOPSO for risk-acceptance models.
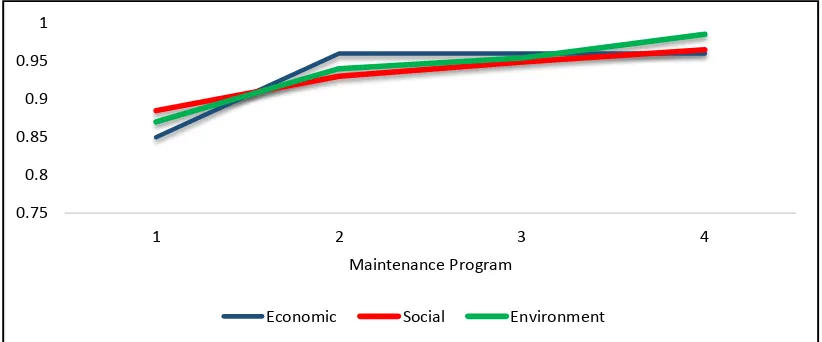
Fig. 3 shows the Pareto optimal solutions for risk acceptance models. Fig. 4 specifies that when sustainability utility increases, the maintenance cost utility decreases. But the differences between them are very close and negligible. Also, Fig. 4 proposes maintenance program objective functions for risk-acceptance models. Fig. 5 represents the sustainability aspects of this program and all three aspects, increase constantly and have been placed in the range of [0.85-0.99].
Value Variable
300 Iteration
50 Population size
300 Repository Size
2 Personal learning coefficient
2 Global learning coefficient
55% Mutation rate
3 Leader selection pressure (β)
2 Deletion Selection Pressure
0.7 Inertia Weight
The proposed maintenance program
The objective amounts of each program Sustainability
Ma
in
ten
an
ce
co
st
E
co
n
o
m
ic
So
cial
E
n
v
ir
o
n
m
en
t
T
o
tal
su
stain
ab
ilit
y
[1 1 1 3 1 1 1 1] 0.9603 0.9490 0.9541 0.9549 0.9089
[1 1 2 3 1 1 1 1] 0.9611 0.9651 0.9850 0.9685 0.9070
[1 1 1 1 2 1 1 1] 0.9601 0.9312 0.9411 0.9435 0.9135
Fig. 3. Pareto optimal solutions for risk-acceptance models.
Fig. 4. Proposed maintenance program objective functions for risk-acceptance models.
Fig. 5. Sustainability aspects for risk-acceptance models.
0.8000 0.8500 0.9000 0.9500 1.0000
1 2 3 4
Maintenance Program
Sustainability Maintenance Costs
0.75 0.8 0.85 0.9 0.95 1
1 2 3 4
Maintenance Program
Now, we concentrate on risk-aversion models. Like previous one, MOPSO algorithm ran for finding the best solutions. Table 8 proposes maintenance program with their objective function values. This iteration was implemented in 18.561 seconds.
Table 8. Proposed maintenance program with MOPSO for risk-aversion models.
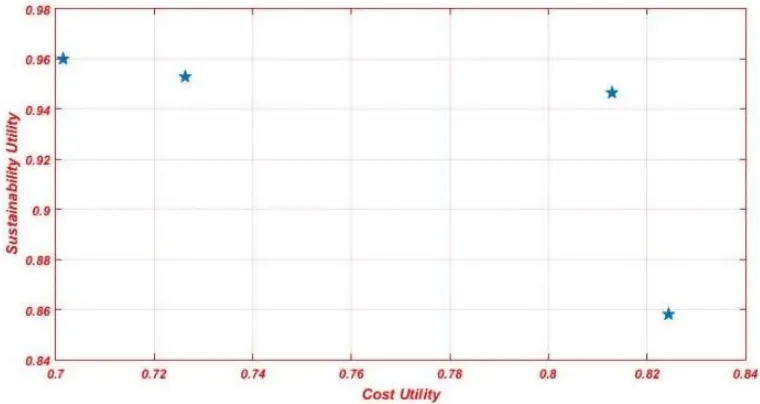
In this iteration, accidentally, four optimal solutions were obtained. As it has been specified in Fig. 6, the objective values are not good as risk-acceptance one. Fig. 7 demonstrates this problem better. Like previous one, by increasing sustainability utility, the maintenance costs utility decreased but the most differences with that are the maintenance utility values which much less than the risk-acceptance model. On the other hand, the sustainability aspects increase during these four programs that are recognized in Fig. 8.
Fig. 6. Pareto optimal solutions for risk-aversion models.
The proposed maintenance program
The objective amounts of each program Sustainability
Ma
in
ten
an
ce
co
st
E
co
n
o
m
ic
So
cial
E
co
n
o
m
ic
T
o
tal
su
stain
ab
ilit
y
[1 2 1 2 1 1 3 3] 0.94 0.96 0.96 0.9527 0.7263
[1 1 1 1 1 1 1 1] 0.89 0.81 0.88 0.8582 0.8243
[1 1 1 1 1 2 3 1] 0.95 0.94 0.95 0.9466 0.8128
Fig. 7. Proposed maintenance program objective functions for risk-aversion models.
Fig. 8. Sustainability aspects for risk-aversion models.
All of the Pareto solutions that were determined above can be used as an optimal maintenance strategy with the maximum amount of both objective functions. It must be noted another time, because of the various number of strategies, we decided to solve this with a meta-heuristic algorithm. It may take an illogical solving time if we want to use such an exact method. By viewing the solutions, we can identify that MOPSO gave better performance with better results in a very short time; furthermore, it gave more diverse solutions so the decision-maker can choose the maintenance strategy more easily.
It is important to know that the upper and lower limits of sustainability aspects, could effect on solutions quality. Another one is the sustainability aspects weights that refer to decision-maker and the type of the problem. In this study, we assumed 0.40 for economic aspect, 0.35 for the social aspect, and 0.25 for environment aspect.
0.5000 0.5500 0.6000 0.6500 0.7000 0.7500 0.8000 0.8500 0.9000 0.9500 1.0000
1 2 3 4
Maintenance Program
Maintenance Costs Sustainability
0.7 0.75 0.8 0.85 0.9 0.95 1
1 2 3 4
Maintenance Program
5. Conclusion
With the increasing spread of the internet and the advent of social and scientific networks, uninterrupted and rapid access to the internet become a basic requirement for all people in all over the world. The use of information and communication technologies with specific and unique features, such as ubiquitous, availability, and high speed is growing increasingly. Increasing the number of internet users in the country and also being various ISP companies, makes it vital to assess the client needs and provide quality to meet their needs in order to attract new customers and retain existing ones. Maintenance cost is one of the most critical costs in all companies. For these reasons, this study aimed to determine equipment maintenance in PAP room for Sabanet Company. First, a list of equipment prepared and specified the number of failures by using their information. Then the reason for failures and also the consequences of them were identified. In next step, the failure rate and the reliability of each equipment were evaluated and the primary RCM strategy determined. After that by finding the risk attitude for each sustainability aspects, the utility of each aspect was calculated so the total sustainability utility was evaluated. Then each maintenance actions costs was determined and by using the maintenance cost function, the amount of maintenance costs utility was determined. Due to various types of maintenance strategies, we used MOPSO algorithm to solve this multi-objective problem. Then we used a novel simulation method to compare with MOPSO algorithm. The results specified that MOPSO gives better performance than simulation method in both risk-acceptance and risk-aversion models. And also both methodologies were much better than current maintenance strategies. The proposed maintenance strategies highly reduced the emergency maintenance that can harm equipment. As a result, the Mean Time between Failures (MTBF), Mean Time to Failure (MTTF) decreased and the system reliability and also equipment lifetime became greater. Some of the most important results of this study demonstrate below:
Increasing equipment reliability and system reliability.
Increasing the economic utility by reducing the risks of system failures and loss the costumers.
Increasing the costumer’s satisfactions with reducing the social risks.
Decreasing the environmental pollutions by reducing the transportation for both costumers and experts
for maintaining failures.
Reducing the maintenance costs by providing the accurate RCM strategies.
Providing maintenance schedules for each procedure.
For future study, we suggest implementing this methodology for parallel-series systems. This novel study can use in various industries with different types of risks that can influence on sustainability utility. It’s challenging to solve this problem with other meta-heuristics or try to compare it with exact methodologies.
Acknowledgment
References
[1] Ben-Daya, M., Kumar, U., & Murthy, D. P. (2016). Introduction to maintenance engineering: modelling, optimization and management. John Wiley & Sons.
[2] Vishnu, C. R., & Regikumar, V. (2016). Reliability based maintenance strategy selection in process plants: a case study. Procedia technology, 25, 1080-1087.
[3] Alsyouf, I. (2007). The role of maintenance in improving companies’ productivity and profitability. International journal of production economics, 105(1), 70-78.
[4] Ahuja, I. P. S., & Khamba, J. S. (2008). Total productive maintenance: literature review and directions. International journal of quality & reliability management, 25(7), 709-756.
[5] Muller, A., Suhner, M. C., & Iung, B. (2008). Formalisation of a new prognosis model for supporting proactive maintenance implementation on industrial system. Reliability engineering & system safety, 93(2), 234-253.
[6] Van Horenbeek, A., & Pintelon, L. (2013). A dynamic predictive maintenance policy for complex multi-component systems. Reliability engineering & system safety, 120, 39-50.
[7] Arunraj, N. S., & Maiti, J. (2010). Risk-based maintenance policy selection using AHP and goal programming. Safety science, 48(2), 238-247.
[8] Dybå, T., & Dingsøyr, T. (2008). Empirical studies of agile software development: A systematic review. Information and software technology, 50(9-10), 833-859.
[9] Cassady, C. R., Pohl, E. A., & Paul Murdock, W. (2001). Selective maintenance modeling for industrial systems. Journal of quality in maintenance engineering, 7(2), 104-117.
[10] Van Houten, F. J., & Kimura, F. (2000). The virtual maintenance system: a computer-based support tool for robust design, product monitoring, fault diagnosis and maintenance planning. CIRP annals-manufacturing technology, 49(1), 91-94.
[11] Zio, E. (2009). Reliability engineering: Old problems and new challenges. Reliability engineering & system safety, 94(2), 125-141.
[12] Bichon, B. J., McFarland, J. M., & Mahadevan, S. (2011). Efficient surrogate models for reliability analysis of systems with multiple failure modes. Reliability engineering & system safety, 96(10), 1386-1395. [13] Lisnianski, A., Elmakias, D., Laredo, D., & Haim, H. B. (2012). A multi-state Markov model for a
short-term reliability analysis of a power generating unit. Reliability engineering & system safety, 98(1), 1-6. [14] Barabady, J., & Kumar, U. (2008). Reliability analysis of mining equipment: A case study of a crushing
plant at Jajarm Bauxite Mine in Iran. Reliability engineering & system safety, 93(4), 647-653.
[15] Nowlan, F. S., & Heap, H. F. (1978). Reliability-centered maintenance. United Air Lines Inc San Francisco Ca.
[16] Rausand, M. (1998). Reliability centered maintenance. Reliability engineering & system safety, 60(2), 121-132
[17] Niu, G., Yang, B. S., & Pecht, M. (2010). Development of an optimized condition-based maintenance system by data fusion and reliability-centered maintenance. Reliability engineering & system safety, 95(7), 786-796.
[18] Zhou, X., Xi, L., & Lee, J. (2007). Reliability-centered predictive maintenance scheduling for a continuously monitored system subject to degradation. Reliability engineering & system safety, 92(4), 530-534.
[19] Li, D., & Gao, J. (2010). Study and application of Reliability-centered Maintenance considering Radical Maintenance. Journal of loss prevention in the process industries, 23(5), 622-629.
[20] Samrout, M., Châtelet, E., Kouta, R., & Chebbo, N. (2009). Optimization of maintenance policy using the proportional hazard model. Reliability engineering & system safety, 94(1), 44-52.
[21] Selvik, J. T., & Aven, T. (2011). A framework for reliability and risk centered maintenance. Reliability engineering & system safety, 96(2), 324-331.
[22] Ba, K., Dellagi, S., Rezg, N., & Erray, W. (2016). Joint optimization of preventive maintenance and spare parts inventory for an optimal production plan with consideration of CO2 emission. Reliability engineering & system safety, 149, 172-186.
[23] Khatab, A., & Aghezzaf, E. H. (2016). Selective maintenance optimization when quality of imperfect maintenance actions are stochastic. Reliability engineering & system safety, 150, 182-189.
[24] Apeland, S., & Aven, T. (2000). Risk based maintenance optimization: foundational issues. Reliability engineering & system safety, 67(3), 285-292.
[26] Saniuk, A., Jasiulewicz-Kaczmarek, M., Samolejová, A., Saniuk, S., & Lenort, R. (2015). Environmental favourable foundries through maintenance activities. Metalurgija, 54(4), 725-728.
[27] Sabatino, S., Frangopol, D. M., & Dong, Y. (2015). Sustainability-informed maintenance optimization of highway bridges considering multi-attribute utility and risk attitude. Engineering structures, 102, 310-321. [28] Ait-Kadi, D., Duffuaa, S. O., Knezevic, J., & Raouf, A. (2009). Handbook of maintenance management
and engineering (Vol. 7). London: Springer.
[29] Stein, S. M., Young, G. K., Trent, R. E., & Pearson, D. R. (1999). Prioritizing scour vulnerable bridges using risk. Journal of infrastructure systems, 5(3), 95-101.
[30] Zhu, B., & Frangopol, D. M. (2012). Risk-based approach for optimum maintenance of bridges under traffic and earthquake loads. Journal of structural engineering, 139(3), 422-434.
[31] Smith, D. (2011). Reliability, maintainability and risk: Practical safety-related systems engineering methods. Butterworth-Heinemann
[32] Rackwitz, R. (2002). Optimization and risk acceptability based on the life quality index. Structural safety, 24(2-4), 297-331.
[33] Heo, J. H., Kim, M. K., & Lyu, J. K. (2014). Implementation of reliability-centered maintenance for transmission components using particle swarm optimization. International journal of electrical power & energy systems, 55, 238-245.
[34] Luke, S. (2009). Essentials of metaheuristics (Vol. 113). Raleigh: Lulu.