DOI: 10.14738/abr.77.6643.
Sari, N., & Heryanto. (2019). The Effect Of Training And Utilization Of SIPKD On Competency And Its Impact On The Quality Of Financial Statements In Dharmasraya Regency SKPD. Archives of Business Research, 7(7), 112-121.
The Effect Of Training And Utilization Of SIPKD On Competency
And Its Impact On The Quality Of Financial Statements In
Dharmasraya Regency SKPD
Neli Sari
Master of Management, STIE “KBP “, JL Khatib Sulaiman No. 61 Lolong Belanti, Padang Utara 25136, West Sumatra, Indonesia
Heryanto
Lecturer in Management Master Program, STIE “KBP”, JL Khatib Sulaiman No. 61 Lolong Belanti, Padang Utara 25136, West Sumatra, Indonesia
ABSTRACT
This study tries to examine the effect of training and utilization of SIPKD on competency and its impact on the quality of financial statements in the SKPD of the Dharmasraya Regency. This study uses descriptive quantitative methods. The study population consisted of 60 people from employees. To obtain a valid and realistic instrument, the validity and reliability test, normality test, multicollinearity test and heterocedasticity test were tested. The data analysis technique used is path analysis using the SPSS program. The results of the study show that there is a positive influence provided by training and the use of SIPKD on increasing competency. The value of indirect influence is greater than the value of direct influence. These results indicate that indirectly training through competence has a significant influence on the quality of financial statements in the SKPD of the Regency of Dharmasraya. The empirical findings indicate that in order to increase community satisfaction, the SIPKD of Dharmasraya District needs to pay attention and focus more on improving training and the quality of financial reports.
Keywords: Training, Utilization of SIPKD, Competence, Quality of Financial Statements.
INTRODUCTION
Head ofa Region as the head of the regional government is the holder of regional financial management authority and represents the regional government in the ownership of separated regional assets (vide) article 6 paragraph (2) letter e Law Number 17 of 2003 concerning State Finance jo.Article 5 paragraph (1) PP Number 58 Year 2005 concerning Regional Financial Management jo.Article 5 paragraph (1) Permendagri Number 13 of 2006 concerning Guidelines for Regional Financial Management as last amended by Permendagri Number 21 of 2011.
management official;b.carried out by the head of the regional device work unit as the official of the budget / regional goods user "
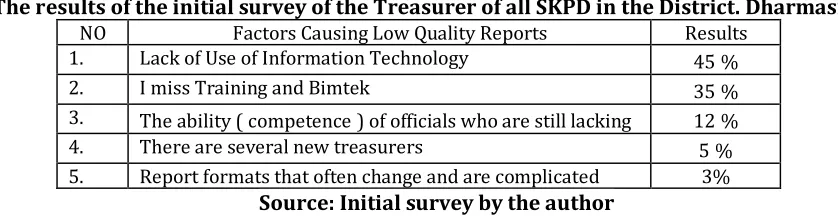
Table 1
The results of the initial survey of the Treasurer of all SKPD in the District. Dharmasraya
NO Factors Causing Low Quality Reports Results 1. Lack of Use of Information Technology 45% 2. I miss Training and Bimtek 35% 3. The ability (competence) of officials who are still lacking 12% 4. There are several new treasurers 5% 5. Report formats that often change and are complicated 3%
Source: Initial survey by the author
Research purposes
In order for researchers to have a clear direction, it is necessary to set research objectives.The objectives to be achieved in this study are:
1. Test the influence of training on competence on the Regional Government of
Dharmasraya Regency.
2. Testing the influence of the use of SIPKD on competence in the Regional Government of
the Regency of Dharmasraya.
3. Test the influence of training on the quality of financial statements in the Regional
Government of Dharmasraya Regency.
4. Testing the effect of SIPKD utilization on the quality of financial statements in the
Regional Government of Dharmasraya Regency.
5. Test the influence of competence on the quality of financial statements in the Regional
Government of Dharmasraya Regency.
6.
Test the effect of training and utilization of SIPKD simultaneously on competency in the Regional Government of the Regency of Dharmasraya.
7. Test the influence of competence as an intervening variable on training and quality of
financial statements in the Regional Government of Dharmasraya Regency
LITERATURE REVIEW Quality of financial statements
The general purpose of financial statements is to provide information about financial position, budget realization, cash flow, and financial performance of a reporting entity that is useful for users in making and evaluating decisions regarding the allocation of resources. Specifically, the purpose of government financial reporting is to present information that is useful for decision making.
According to Mahmudi (2010) the definition of local government financial statements is information presented by local governments to assist stakeholders in making social, political and economic decisions so that decisions taken can be of higher quality. The Regional Government Financial Report (LKPD) will be assessed annually in the form of opinions from the Supreme Audit Agency (BPK). When the BPK provides unqualified opinions on financial statements, it means that it can be said that the financial statements of an organization are presented and expressed fairly and with quality .
Training
achieve certain skills and abilities to succeed in carrying out their work". Furthermore, Mondy R Wayne (2008) defines that "training is activities designed to provide learners with the knowledge and skills needed for their current job". The objectives of implementing training activities include increasing work efficiency and effectiveness as well as improving the quality of Human Resources (Handoko, 2014) .
Based on Government Regulation Number 101 of 2000 concerning Civil Servants Education and Training, what is meant by Education and Training is "the implementation of the learning process to improve the ability to carry out their positions in accordance with the objectives". Training in office is carried out to develop the knowledge, skills and attitudes of Civil Servants in order to carry out their duties in government and development as well as possible. The benefits of implementing education and training, namely changing the attitude of employees, increasing knowledge and skills of employees, developing skills and morale, simplifying employee supervision and enhancing employee stability
Utilization of SIPKD
Information technology is a technology used to process data, including processing, obtaining, compiling, storing, in various ways to produce quality information, namely relevant, accurate and timely information, which is used for personal, business and government purposes and is strategic information for decision making (Mulyono, 2009) .
The system defined by (Wilkinson (2000) is an integrated framework that has one or more goals, whereas according to McLeod & schell, (2008) a system is a group of integrated elements with the same intent to achieve a goal. Information according to Supriyanto, (2005) is data that has been processed into a form that means for recipients and is useful in making decisions now or in the future, whereas information according to Wilkinson (2000) is a vital commodity for an organization or company, which consists of transformed data and made more valuable through processing.
Competence
Based on the Regulation of the Head of the State Personnel Agency Number 7 of 2013, competence is "the characteristics and capabilities of work that cover aspects of knowledge, skills, and attitudes according to the duties and / or functions of office". Competence is needed so that employees can carry out work in accordance with established standards, or in other words fulfill the measure of quality of expected work results (Supardi, 2013) .
Employees who have competence, can carry out their main tasks and functions optimally (Adhi dan Suhardjo 2013) . Conversely, employees who do not have sufficient knowledge in work will encounter many obstacles that result in waste of material, time and energy (Rachmawati, 2014) . Therefore, competent employees play an important role in achieving the goals of an organization.
RESEARCH METHODS Population and Samples
In general, the population is defined as all group members whose characteristics are clearly defined, be it a group of people, objects, or events. The population in this study is the expenditure treasurer in every SKPD in Dharmasraya Regency as many as 49 people.
Samples according to Sugiyono (2017) are some of the numbers and characteristics possessed by the population. In this study the authors used a saturated sampling technique (census), which is that all populations were sampled as many as 49 people
Types and Data Sources
The type of data in this study is primary data, namely research data obtained or collected directly from original sources (without intermediaries). According to Sugiyono (2017) , primary sources are data sources that directly provide data to data collectors. While the primary data sources in this study were obtained from answers to questionnaires distributed to respondents. In addition, the data used in this study also comes from various literature such as previous research, and books relating to the problem under study.
The types and sources of data used in the study are as follows:
Primary data,
Data is the main data type that supports research. The source of this primary data is obtained directly from the research responses through respondents' answers in the research questionnaire circulated.
Secondary data,
Data which is the second type of data that supports research, this data is obtained indirectly from sources of information that are not attempted alone by researchers. Secondary data sources are data sources such as employee data, organizational structure, journals, and readings that relate to research and data sources obtained from the Regional Government of Dharmasraya Regency
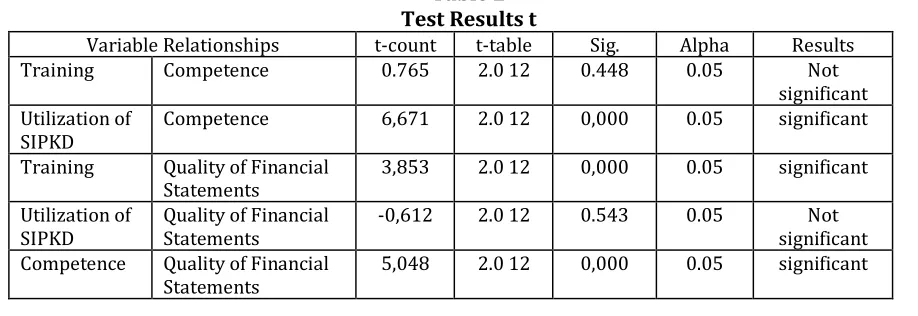
RESULTS AND DISCUSSION Partial Hypothesis Testing (t Test)
The t test is intended to determine whether or not there is a partial (own) influence given by the independent variable (X) to the dependent variable (Y).The basis of decision making is if the value of sig <0.05, or t-count> t-table then there is an influence of variable X partially on variable Y, and vice versa.
It is known that t table = t (α / 2; nk-1) = t (0.025;46) = 2.012, then thetable will be obtained as follows:
Table 2 Test Results t
Variable Relationships t-count t-table Sig. Alpha Results Training Competence 0.765 2.0 12 0.448 0.05 Not
significant Utilization of
SIPKD Competence 6,671 2.0 12 0,000 0.05 significant Training Quality of Financial
Statements 3,853 2.0 12 0,000 0.05 significant Utilization of
SIPKD Quality of Financial Statements -0,612 2.0 12 0.543 0.05 significant Not Competence Quality of Financial
Based on the table above can be explained as follows:
a. The first hypothesis testing (H 1 ) is rejected
There is no partial influence between the Training and Competence variables.
b. Hypothesis testing for two (H2) is received
There is a partial influence between theSIPKD and Competency Usagevariables.
c. Testing the third hypothesis (H3) is accepted
There is a partial influence between the Training variable and the Quality of Financial Statements
d. Fourth hypothesis testing (H4) is rejected
There is no partial effect between the variables of SIPKD Utilization and Financial Report Quality.
e. The fifth hypothesis testing (H5) is accepted
There is a partial influence between the variables of Competence and Quality of Financial Statements.
Simultaneous Hypothesis Testing (F test)
The F test aims to determine whether or not there is an influence simultaneously (together) given the independent variable (X) to the dependent variable (Y).The basis of decision making is if the value of sig <0.05, or F count> F table then there is the influence of X variable simultaneously on variable Y, and vice versa.It is known that F table = F (k; nk) = F (2;47) = 3,20
Table 3 Test Results f
ANOVAa
Model Sum of Squares df Mean Square F Sig.
1 Regression 473,386 2 236,693 38,963 , 000
b
Residual 346,264 57 6,075 Total 819,650 59
a. Dependent Variable: REPORT QUALITY
b. Predictors: (Constant), UTILIZATION OF SIPKD, TRAINING
Based on the above output, it is known that the significance value for the effect of X1 and X2
simultaneously on Y is 0,000 <0,05 and F count 38,963> 3, 20 , so it can be concluded that there are simultaneous effects of Training and Utilization of SIPKD on the Quality of Financial Statements.
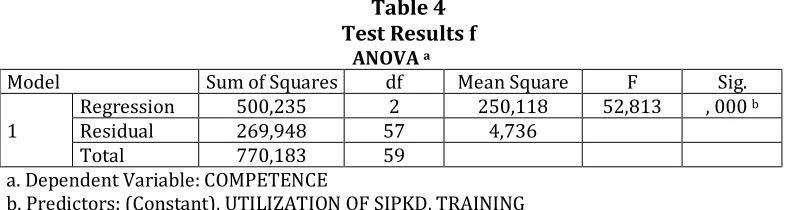
Table 4 Test Results f
ANOVAa
Model Sum of Squares df Mean Square F Sig.
1 Regression 500,235 2 250,118 52,813 , 000
b
Residual 269,948 57 4,736 Total 770,183 59
a. Dependent Variable: COMPETENCE
b. Predictors: (Constant), UTILIZATION OF SIPKD, TRAINING
Based on the output above, it is known that the significance value for the effect of X1 and X2 simultaneously on I is 0,000 <0,05 and F count 52,813> 3,20, so it can be concluded that there is a simultaneous effect of Training and Utilization of SIPKD on Competence.
Sixth hypothesis testing (H6) is accepted.
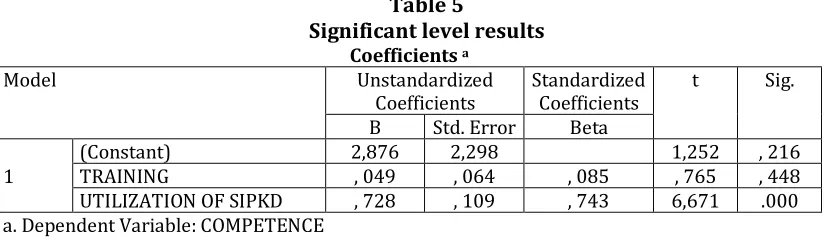
PATH ANALYSIS Path Model Coefficient 1
Multiple linear regression analysis was used in this study with the aim to determine whether there is an influence of independent variables on the dependent variable.The statistical calculation in multiple linear regression analysis used in this study is to use the IBM SPSS computer program ver.21.0.The summary of the results of data processing using the SPSS program are as follows:
Table 5
Significant level results
Coefficientsa
Model Unstandardized
Coefficients Standardized Coefficients t Sig. B Std. Error Beta
1 (Constant) TRAINING 2,876 , 049 2,298 , 064 , 085 1,252 , 765 , 216 , 448 UTILIZATION OF SIPKD , 728 , 109 , 743 6,671 .000 a. Dependent Variable: COMPETENCE
Based on the table above, it was obtained that:
1. The significance value of the Training variable (X 1 ) = 0.448> 0.05, this means that
directly there is no significant effect of Training (X 1 ) on Competence (I).
2. While the variable of SIPKD Utilization (X 2 ) = 0,000 <0,05 which means the Utilization
of SIPKD (X 2 ) This means that directly there is a significant effect of the Utilization of
SIPKD (X 2 ) on Competence (I).
Table 6 Model Summary
Model R R Square Adjusted R Square Std. Error of the Estimate
1 , 806 a , 650 , 637 2,17622
a. Predictors: (Constant), UTILIZATION OF SIPKD, TRAINING
3. While the value of R 2 contained in the Model Summary table is 0.650 which gives the
meaning that the contribution of variables X1 and X2 to I is equal to 65.0% and the
remaining 35.0% is the contribution of other variables not included in research. And from the value of R 2, obtained e1 by means of e1 = √ (1 - 0.650) = 0.591
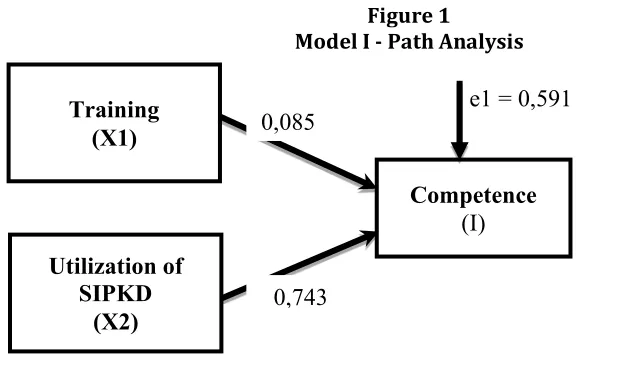
Based on the results above, the structural equation is obtained:
I = 0, 085.X 1
+ 0, 743.X
2+ 0, 591
Figure 1
Model I - Path Analysis
Path Model Coefficient 2
Multiple linear regression analysis is still used in the next study to obtain the two model path coefficients, with the aim of knowing whether there are influences of independent variables (
t
rainingandUtilization of SIPKD) and intervening variables (c
ompetence) on the dependent variable (q
uality of Financial Statements). It can be seenin the following table:Table 7
Linear regression test results
Coefficientsa
Model Unstandardized
Coefficients Standardized Coefficients t Sig. B Std. Error Beta
1
(Constant) 9.513 2,206 4,312 .000 TRAINING , 235 , 061 , 396 3,853 .000 UTILIZATION OF SIPKD -, 084 , 138 -, 083 -, 612 , 543 COMPETENCE , 633 , 125 , 614 5,048 .000 a. Dependent Variable: REPORT QUALITY
Based on the table above obtained:
1. The significance value of the Training variable (X 1 ) = 0,000 <0,05, this means that
directly Training (X 1 ) has a significant effect on the Quality of Financial Statements (Y).
2. Significance value of the variable Utilization of SIPKD (X 2 ) = 0.543> 0.05 which means
that directly the Use of SIPKD (X 2 ) does not significantly influence the Quality of
Financial Statements (Y).
3. Significance value of Competency variable (I) = 0,000 <0,05 which means that directly the Use of SIPKD (X 2 ) has a significant effect on the Quality of Financial Statements (Y).
Table 8
Significant level results
Model Summary
Model R R Square Adjusted R Square Std. Error of the Estimate
1 , 842 a , 710 , 694 2,06144
a. Predictors: (Constant), COMPETENCE, TRAINING, UTILIZATION OF SIPKD
4. The value of R 2 found in the Model Summary table is 0.710 which gives the meaning
that the contribution of variables X1, X2 and I to Y is 71.0% and the remaining 29.0% is
the contribution of other variables which are not included in the study. And from the value of R 2 obtained e2, by means of e2 = √ (1 - 0.710) = 0.538
Training (X1)
Utilization of SIPKD
(X2)
0,085
Competence
(I)
0,743
Based on the results above, the structural equation is obtained:
Y = 0, 396.X 1-0,
612.X
2+
3+ 0.538 0,614.X
From the processing of the data above, it can be obtained Model I Path Diagram, as follows:
Figure 2
Model 2 - Path Analysis
Direct and Indirect Effects
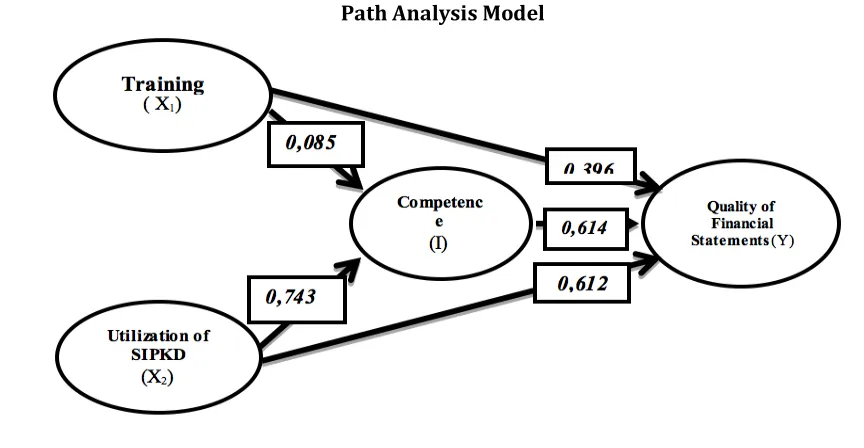
Besides using independent variables (X) more than one variable, this study also uses intervening variables.Intervening variable is a intermediate / mediating variable, its function mediates the relationship between the independent variable and the dependent variable.To test the effect of intervening variable analysis method path(path analysis).Path analysis is an extension of regression analysis to estimate the causality relationship between previously defined variables based on theory(Ghazali, 2013).The following is the path analysis to examine the relationship between Training and the Use of SIPKD on the Quality of Financial Reports and whether the Training and Utilization of SIPKD relations to the Quality of Financial Reports are mediated by Competencies with the following figure:
Figure 3 Path Analysis Model Training
(X1)
Utilization of SIPKD
(X2)
Competenc e (I)
Quality of Financial Statements
(Y)
0,396
0,614
0,612 0,085
0,743
Based on the pictureabove can be calculated indirect effects between independent and bound variables through intervening variables asfollows:
Testing the seventh hypothesis (H7) is accepted
Analysis of the effect of X1 through I on Y. It is known that the direct effect of X1 on Y is
0.396.While the indirect effect of X1 through I on Y is the multiplication of the value of beta X1
to I with beta I value to Y,namely:0.085 x 0.614 = 0.052.Then the total influence given X1 to Y
is the direct effect added by indirect effects,namely:0.085 + 0.052 = 0.137.Based on the results of these calculations, it is known that the direct effect value is 0.085 and the indirect effect is 0.137 which means that the value of indirect influence is greater than the value of direct influence, this result indicates that indirectly X1 through I has a significant influence on
Y.
CONCLUSION
Based on the results of testing and discussion of the hypotheses described previous, some conclusions can be drawn asfollows:
1. There is no partial influence between the training and competence variables. This means that there is no influence given by training on increasing competency .
2. There is a partial influence between the SIPKD and competency usage variables . This means that there is an influence given by the use of SIPKD on increasing competency . 3. There is a partial influence between the Training variable and the quality of financial
statements . This means that there is influence given by the training on the quality of financial statements .
4. There is no partial effect between the variables of SIPKD Utilization and Financial Report Quality. This means that there is no influence given by the utilization of SIPKD on the quality of financial statements
5. There is a partial influence between the variables of competence and quality of financial statements. This means that there is influence given by competence on the quality of financial statements
6. There is a simultaneous influence of training and utilization of SIPKD on competence. This means that there is a positive influence provided by training and the use of SIPKD on increasing competency .
7. This means that the value of indirect influence is greater than the value of direct influence, these results indicate that indirectly training through competence has a significant influence on the quality of financial statements
SUGGESTION
Based on the findings and conclusions of the study. There are some suggestion as follow:
1. Leaders need to provide more frequent training so that financial reports can be completed with good quality.
2. There needs to be coordination between the parties involved in preparing good and quality financial reports.
BIBLIOGRAPHY
Adhi dan Suhardjo. 2013. Pengaruh Penerapan Standar Akuntansi Pemerintahan Dan Kualitas Aparatur
Pemerintah Daerah Terhadap Kualitas Laporan Keuangan (Studi Kasus Pada Pemerintah Kota Tual). Semarang: STIE Semarang.
Ghazali, Imam. 2013. Atik Septi Winarsih. Semarang: Badan Penerbit Universitas Diponegoro. Handoko. 2014. Manajemen Personalia Dan Sumber Daya Manusia. Yogyakarta: BPFE. Mahmudi. 2010. Manajemen Keuangan Daerah. Jakarta: Erlangga.
McLeod & schell. 2008. Sistem Informasi Manajemen. Jakarta: Salemba Empat. Mondy R Wayne. 2008. Manajemen Sumber Daya Manusia. Jakarta: Erlangga. Mulyono. 2009. Pendidikan Bagi Anak Berkesulitan Belajar. Jakarta: Rineka Cipta.
Muri. 2014. Metodology Penelitian Kuantitatif, Kualitatif, Dan Penelitian Gabungan. Jakarta: Prenadamedia Group. Rachmawati. 2014. Metodologi Penelitian Kualitatif DalamRiset Keperawatan. Jakarta: PT Raja Grafindo Persada. Rivai & Sagala. 2013. Manajemen Sumber Daya Manusia Untuk Perusahaan. Jakarta: Rajawali Press.
Sugiyono. 2017. Metode Penelitian Kuantitatif, Kualitatif, Dan R&D. Bandung: Alfabeta.
Supardi. 2013. Aplikasi Statistika Dalam Penelitian Konsep Statistika Yang Lebih Komprehensif. Jakarta: Change Publication.
Supriyanto. 2005. Pengantar Teknologi Informasi. Jakarta: Salemba Empat.