ORIGINAL ARTICLE
A genome-wide association study identi
fi
es risk loci for
childhood acute lymphoblastic leukemia at 10q26.13
and 12q23.1
J Vijayakrishnan1, R Kumar2, MYR Henrion1, AV Moorman3, PS Rachakonda2, I Hosen2, MI da Silva Filho2, A Holroyd1, SE Dobbins1, R Koehler4, H Thomsen2, JA Irving3, JM Allan3, T Lightfoot5, E Roman5, SE Kinsey6, E Sheridan7, PD Thompson8, P Hoffmann9,10, MM Nöthen9, S Heilmann-Heimbach9, KH Jöckel11, M Greaves12, CJ Harrison3, CR Bartram4, M Schrappe13, M Stanulla14, K Hemminki2,15and RS Houlston1
Genome-wide association studies (GWASs) have shown that common genetic variation contributes to the heritable risk of childhood acute lymphoblastic leukemia (ALL). To identify new susceptibility loci for the largest subtype of ALL, B-cell precursor ALL (BCP-ALL), we conducted a meta-analysis of two GWASs with imputation using 1000 Genomes and UK10K Project data as reference (totaling 1658 cases and 7224 controls). After genotyping an additional 2525 cases and 3575 controls, we identify new susceptibility loci for BCP-ALL mapping to 10q26.13 (rs35837782,LHPP,P= 1.38 × 10⁻¹¹) and 12q23.1 (rs4762284,ELK3,P= 8.41 × 10⁻⁹). We also provide confirmatory evidence for the existence of independent risk loci at 9p21.3, but show that the association marked by rs77728904 can be accounted for by linkage disequilibrium with the rare high-impactCDKN2Ap.Ala148Thr variant rs3731249. Our data provide further insights into genetic susceptibility to ALL and its biology.
Leukemia(2017)31,573–579; doi:10.1038/leu.2016.271
INTRODUCTION
Acute lymphoblastic leukemia (ALL) is the major pediatric cancer in western countries, with B-cell precursor (BCP) ALL accounting for ~ 80% of ALL cases.1Despite this, the etiology of ALL is poorly understood and although there is indirect evidence for an infective origin, no specific environmental risk factor has been identified.2,3 Evidence for inherited predisposition to ALL is provided by the increased risk shown in siblings of cases independent of the concordance in monozygotic twins, which has anin uteroetiology.4 Support for polygenic susceptibility to ALL has come from genome-wide association studies (GWASs).5–9 Although these studies have so far identified single-nucleotide polymorphisms (SNPs) at seven loci influencing BCP-ALL at 7p12.2 (IKZF1), 9p21.3 (CDKN2A, two risk loci), 10p12.2 (near PIP4K2A), 10p14 (GATA3), 10q21.2 (nearARID5B) and 14q11.2 (nearCEBPE), statistical modeling using genome-wide complex trait analysis predicts that additional risk loci conferring modest effects should be identifiable by further GWAS.10
Recovery of untyped genotypes through imputation provides a mechanism of exploiting GWAS data sets to identify new risk alleles.11 In addition, it enablesfine mapping and refinement of association signals, for example, in identification of theCDKN2A
p.Ala148Thr variant rs3731249 (hg19 chr9:g.21970916 G4A) as contributing to the 9p21.3 association signal.8Recently, the use of
the 1000 Genomes Project and the UK10K projects as a combined reference panel has been shown to improve imputation accuracy compared with using the 1000 Genomes Project data alone.12,13
Here, we report imputation using the 1000 Genomes and the UK10K Project data as reference and meta-analysis of two GWASs to identify new susceptibility alleles for BCP-ALL. After replication genotyping in three additional case–control series, we have identified new risk loci for BCP-ALL at 10q26.13 and 12q23.1. Our
findings provide further insights into the genetic and biological basis of this hematological malignancy.
MATERIALS AND METHODS
Ethics
Collection of samples and clinicopathological information from subjects was undertaken with informed consent in accordance with the Declaration of Helsinki and ethical board approval. Ethical committee approval was obtained for Medical Research Council UKALL97/99 trial by individual UK treatment centers and approval for UKALL2003 was obtained from the Scottish Multi-Centre Research Ethics Committee (REC:02/10/052).14,15 Additional ethical approval was obtained under the auspices of the
1
Division of Genetics and Epidemiology, The Institute of Cancer Research, Sutton, UK;2
Division of Molecular Genetic Epidemiology, German Cancer Research Centre, Heidelberg, Germany;3
Leukemia Research Group, Northern Institute for Cancer Research, Newcastle University, Newcastle upon Tyne, UK;4
Department of Human Genetics, Institute of Human Genetics, University of Heidelberg, Heidelberg, Germany;5Department of Health Sciences, Epidemiology and Cancer Statistics Group, University of York, York, UK; 6
Department of Paediatric and Adolescent Haematology and Oncology, Leeds General Infirmary, Leeds, UK;7
Medical Genetics Research Group, Leeds Institute of Biomedical & Clinical Sciences, University of Leeds, Leeds, UK;8Paediatric and Familial Cancer Research Group, Institute of Cancer Sciences, University of Manchester, St Mary's Hospital, Manchester, UK;9
Institute of Human Genetics, University of Bonn, Bonn, Germany;10
Department of Biomedicine, Human Genomics Research Group, University Hospital Basel, Basel, Switzerland;11
Institute for Medical Informatics, Biometry and Epidemiology, University Hospital Essen, Essen, Germany;12
Haemato-Oncology Research Unit, Division of Molecular Pathology, Institute of Cancer Research, Sutton, UK;13
General Paediatrics, University Hospital Schleswig-Holstein, Kiel, Germany; 14
Department of Paediatric Haematology and Oncology, Hannover Medical School, Hannover, Germany and15
Center for Primary Health Care Research, Lund University, Malmö, Sweden. Correspondence: Correspondence: Professor RS Houlston, Division of Genetics and Epidemiology, The Institute of Cancer Research, 15 Cotswold Road, Sutton SM2 5NG, UK.
E-mail: richard.houlston@icr.ac.uk
Received 13 June 2016; revised 26 August 2016; accepted 6 September 2016; accepted article preview online 3 October 2016; advance online publication, 11 November 2016
Childhood Leukaemia Cell Bank, the UK Childhood Cancer Study and University of Heidelberg.
GWAS data
The UK-GWAS and German-GWAS data sets have been previously reported.6,7Briefly, the UK-GWAS was based on constitutional DNA (that is, remission samples) of 459 white BCP-ALL cases from the UK Childhood Cancer Study (UKCCS; http://www.ukccs.org/; 258 males; mean age at diagnosis 5.3 years); 342 cases from the UK Medical Research Council ALL 97/99 (1997–2002) trial (190 males; mean age of diagnosis 5.7 years) and 23 cases from the Northern Institute for Cancer Research (16 males). Genotyping was performed using Illumina Human 317 K arrays (Illumina, San Diego, CA, USA; Available at: http://www.illumina.com). For controls, we used publicly accessible data generated by the Wellcome Trust Case Control Consortium 2 (http://www.wtccc.org.uk/) from 2699 individuals in the 1958 British Birth Cohort (Hap1.2M-Duo Custom array data) and 2501 individuals from the UK Blood Service. The German-GWAS was comprised of 1155 cases (620 males; mean age at diagnosis 6.0 years) ascertained through the Berlin– Frankfurt–Münster (BFM) trials (1993–2004) genotyped using the Illumina Human OmniExpress-12v1.0 arrays. For controls, we used genotype data from 2132 healthy individuals from the Heinz Nixdorf Recall study; consisting of 704 individuals genotyped using Illumina HumanOmni1-Quad_v1 and 1428 individuals genotyped on Illumina Human OmniExpress-12v1.0 plat-form. In total, we obtained 1658 BCP-ALL cases and 7224 matched controls from the two GWASs series combined.
Quality control of GWAS samples
The quality-control steps of UK- and German-GWAS study samples have been described in the previous studies.6,7After the quality-control steps, we obtained 824 cases and 5200 controls for the UK-GWAS data set, and 834 cases and 2024 controls from the German data sets that were then used for further genotyping and imputation analysis.
Replication series and genotyping
The UK replication series comprised 1150 patients (504 males; mean age at diagnosis 6.2 years) ascertained through the UK ALL-2003 (2003–2011) and ALL 97/99 trials.14,15 Immunophenotyping of diagnostic samples was undertaken using standard methods. The 2100 controls (702 males) were ethnically-matched healthy individuals with no personal history of cancer recruited to the National Study of Colorectal Cancer Genetics16and the Genetic Lung Cancer Predisposition Study.17 Genotyping of cases and controls was performed using competitive allele-specific PCR KASPAR chemistry (LCG Biosciences Ltd, Hertfordshire, UK). The German replication series consisted of 1501 patients ascertained (794 males; mean age at diagnosis, 6.2 years ascertained through the BFM trials (1993–2004)).18The controls comprised of 1516 (762 males; mean age, 58.2 years), ethnically matched healthy individuals of German origin recruited at the Institute of Transfusion Medicine in Manheim, Germany, 2004. Samples having SNP call rates ofo90% were excluded from the analysis. To ensure quality of genotyping in all assays, at least 2 negative controls and 1 to 2% duplicates (concordance499.9%) were genotyped. All primers and probes used are detailed in Supplementary Table S11. Combining both replication series, we had access to 2651 B-cell ALL cases and 3616 matched controls for the current study.
Sanger sequencing
To confirm thefidelity of imputation, a random subset of samples were sequenced using BigDye Terminator v3.1 Cycle Sequencing Kit (Applied Biosystems, Waltham, MA, USA) in conjunction with ABI 3700xl semi-automated sequencers (Applied Biosystems). Primer sequences are detailed in Supplementary Table S11.
Statistical and bioinformatics analyses
Main data analysis were undertaken using R version 2.15.2 (R Core Team, 2013; http://www.R-project.org/), PLINK v1.9(ref. 19) and SNPTEST v2.4.1 software.20 The two GWAS data sets were imputed for over 10 million variants using IMPUTE2 v2.3.0 software21,22 and data from the 1000 Genomes Project (phase 1 integrated variant set, v3.20101123, http://www.1000genomes.org, 9 December 2013) and UK10K (ALSPAC, EGAS00001000090/EGAD00001000195; and TwinsUK, EGAS00001000108/ EGAD00001000194, studies only; http://www.uk10k.org/) as reference.
Data sets werefirst phased using SHAPEIT v2.12 prior to imputation to accurately estimate haplotypes.23The adequacy of case–control matching and possibility of differential genotyping between cases and controls were evaluated using quantile–quantile plots of test statistics to computeλ100. Test of association between imputed SNPs and childhood ALL was performed using a missing data likelihood score test under a frequentist additive model in software SNPTEST. Eigenvectors for the German data set were inferred usingsmartpcacomponent within EIGENSOFT v2.4(refs. 24,25) and Eigenstrat adjustment was carried out by including the first two eigenvectors as covariates in SNPTEST during association analysis. Post imputation and SNPTEST, only markers with info scores40.4, imputed call rates/SNP40.9, minor allele frequencies (MAFs)40.005, and a posterior imputation quality threshold of 0.5 or higher were included in further analysis. SNPs that deviated from Hardy–Weinberg equilibrium atP-values o10−5were also excluded from further analysis. Meta-analysis of post quality control GWAS data sets was conducted in META 1.3.1,20,21,26under afixed-effects model using the inverse variance approach. We calculated Cochran’sQstatistic to test for heterogeneity and theI2statistic to quantify the proportion of the total variation attributable to heterogeneity.27The presence of secondary association signals owing to allelic heterogeneity in risk loci were carried out using a conditional analysis in SNPTEST by adjusting for the sentinel SNP using the‘–condition-on’option. Logistic regression association analysis and meta-analysis of the replication data sets underfixed effects were carried out using the STATA v.10 software (Stata Corporation, College Station, TX, USA).
Linkage disequilibrium (LD) metrics were calculated using vcftools v0.1.12b26 (http://vcftools.sourceforge.net) using UK10K data. HapMap recombination rate (cM/Mb) were defined by Oxford recombination hotspots.28,29
Chromatin state dynamics and functional annotation
To explore the epigenetic profile of association signals, we used 15-state chromatin segmentation data learned by computationally integrating chIP-seq data for GM12878 lymphoblastoid cells inferred from ENCODE Histone Modification data (H4K20me1, H3K9ac, H3K4me3, H3K4me2, H3K4me1, H3K36me3, H3K27me3, H3K27ac and CTCF) and binarized using a multivariate Hidden Markov Model (http://genome.ucsc.edu/ENCODE/).30 Risk SNPs and their proxies (that is,r240.8 in the 1000 Genomes EUR reference panel) were annotated for putative functional effect using HaploReg v3,31RegulomeDB32and SeattleSeq33Annotation. These servers make use of data from ENCODE,30genomic evolutionary rate profiling34 conservation metrics, combined annotation-dependent depletion scores35 and PolyPhen scores.36 Similarly, we searched for overlap with ‘ super-enhancer’ regions as defined by Hnisz et al.37 restricting analysis to GM12878 cells.
Expression quantitative trait locus analysis
Expression quantitative trait locus (eQTL) analysis was performed for all genes in 1 Mb regions spanning rs4762284 and rs35837782 by querying messenger RNA expression data from MuTHER38 and Blood eQTL browser.39
Chromosome karyotyping and 9p21.3 deletion status
Conventional cytogenetic studies on diagnostic ALL tumor cells were conducted using standard karyotyping methodologies, and standard criteria for the definition of a clone were applied. Genomic copy number at 9p21.3 was assayed using FISH and MLPA as previously described.40,41
Relationship between SNP genotype and survivorship
To investigate if genotype is associated with clinical phenotype or outcome, we analyzed data on patients recruited to AIEOP-BFM 2000.18 Briefly, patients received standard chemotherapy (that is, prednisone, vincristine, daunorubicin, l-asparaginase, cyclophosphamide, ifosfamide, cytarabine, 6-mercaptopurine, 6-thioguanine and methotrexate) with a subset of high-risk patients treated with cranial irradiation and/or stem cell transplantation. Event-free survival was defined as the time from diagnosis to the date of last follow-up in complete remission or to thefirst event. Events were resistance to therapy (nonresponse), relapse, secondary neoplasm or death from any cause. Failure to achieve remission owing to early death or nonresponse was considered as an event at time zero and patients lost to follow-up were censored at the time of their withdrawal. Patients were stratified into three categories: standard, intermediate and
high risk. Although minimal residual disease analysis was the main stratification criterion, high risk was also defined by prednisone poor response or⩾5% leukemic blasts in bone marrow on day 33, ort(9;22)/
t(4;11) positivity or their molecular equivalents (BCR-ABL/MLL-AF4-fusion) independent of minimal residual disease status. Standard patients were minimal residual disease-negative on treatment day 33 (TP1) and 78 (TP2), and had no high-risk criteria. High-risk patients were defined as having residual disease (⩾10−3cells) at TP2. Intermediate patients had positive-minimal residual disease detection at either TP1 or TP2, but had a cell count ofo10−3at TP2. The Kaplan–Meier method was used to estimate survival rates, differences were compared with the two-sided log-rank test.42,43 Cumulative incidence functions for competing events were constructed by the method of Kalbfleisch and Prentice,44 and were compared employing the Gray’s test.45 Computations were performed using SASv9.1 (SAS, Cary, NC, USA).
Heritability analysis
We used genome-wide complex trait analysis to estimate the polygenic variance (that is, heritability) ascribable to all GWAS SNPs.46 SNPs were excluded based on the MAF (o0.01), missing genotype rate (0.05) and deviation from Hardy–Weinberg equilibrium (Po0.05). Individuals were excluded for exhibiting an excess of missing genotype (40.02) and where two individuals were closely related (genetic relatedness score 40.05). A genetic relationship matrix of pairs of samples was used as input for the restricted maximum likelihood analysis to estimate the heritability explained by the selected set of SNPs. Regions of high LD in the genome were excluded from the analysis. Imposing a prevalence of 0.0005(ref. 2)for childhood ALL, we estimated the heritability explained by risk SNPs identified by GWAS as located within autosomal regions associated with ALL. For each risk SNP, the heritability was estimated for all chromosomes simultaneously using the risk SNP genotype as a covariate. In chromosomes bearing multiple independent risk loci, all the risk SNPs in that chromosome were used as covariates to get the combined contribution of risk SNPs toward heritability. The heritability associated with the risk SNPs was taken to be the difference between the heritability of the chromosome on which it is found as calculated with and without covariate adjustment for the SNP.
Calculation of polygenic risk scores
In addition to the two new risk loci described here, seven previously reported risk loci were included in the calculation of the polygenic risk scores for childhood ALL (rs10828317, 10p12.2; rs3824662, 10p14; rs7089424, 10q21.2; rs2239633, 14q11.2; rs4132601, 7p12.2; rs3731249,
9p21.3; rs3731217, 9p21.3; rs35837782, 10q26.13; rs4762284, 12q23.1). The eight variants are thought to act independently as previous studies have shown no interaction between risk loci.5–7 Polygenic risk scores were constructed using methods established by Pharoahet al.47based on the log-normal distribution LN(μ,σ2) of meanμand varianceσ2(that is, relative risk is normally distributed on a logarithmic scale). Standardized incidence ratios for familial risk in singleton siblings and twins for childhood ALL were assumed to be 3.2.4Familial risk was calculated by dividing polygenic variation over the square root of familial risk.
RESULTS
Association analysis
To identify new susceptibility loci for BCP-ALL, we conducted a pooled meta-analysis of two GWASs in populations of European ancestry, the UK-GWAS and the German-GWAS (see Materials and Methods section). Afterfiltering, the studies provided genotype data on 1658 cases and 7224 controls. To achieve consistent and dense genome-wide coverage, we imputed unobserved geno-types at 410 million SNPs using a combined reference panel comprising 1092 individuals from the 1000 Genomes Project and 3781 individuals from the UK10K project (Supplementary Figure S2). Quantile–quantile plots of SNPs (MAF 40.5%) post imputation did not show evidence of substantive overdispersion introduced by imputation (genomic inflation λ100 for UK- and
German-GWAS was 1.016 and 1.009, respectively; Supplementary Figure S1).
Pooling data from both GWASs, we derived joint odds ratios and 95% confidence intervals under afixed-effects model for each SNP with MAF40.5% and associated per alleleP-values. From this analysis, we identified the top-ranked SNPs in 20 distinct regions and not previously implicated in the risk of developing BCP-ALL (Supplementary Table S1). After confirming the fidelity of imputation by Sanger sequencing (Supplementary Table S2), we successfully designed and optimized allele-specific PCR (KASPAR) assays for 14 SNPs. We sought validation of associations by genotyping additional UK and German case–control series totaling 2525 cases and 3575 controls (Supplementary Table S3).
In the combined analysis of data from these replication series, rs35837782 (10q26.13, hg19 chr10:g.126293309) and rs4762284
Table 1. Risk to childhood acute lymphoblastic leukemia at loci 10q26.13 and 12q23.1
rs35837782 (10q26.13, LHPP) Case genotypes Control genotypes OR 95% CI P-value
RAF AA AG GG RAF AA AG GG
UK-GWAS 0.67 93 358 373 0.62 745 2510 1945 1.27 (1.14–1.41) 2.04 × 10⁻⁵
German-GWAS 0.67 93 365 376 0.63 268 952 804 1.19 (1.05–1.36) 0.0072
Meta 1.24 (1.14–1.34) 6.04 × 10⁻⁷
UK replication 1 0.67 73 211 251 0.62 150 475 405 1.19 (1.03–1.39) 0.022 UK replication 2 0.67 56 265 253 0.61 167 497 391 1.33 (1.14–1.55) 0.0002 German replication 0.65 184 607 621 0.63 204 701 574 1.13 (1.02–1.26) 0.0203
Meta 1.20 (1.11–1.29) 3.66 × 10⁻⁶
Combined meta 1.21 (1.15–1.28) 1.38 × 10⁻¹¹(Phet=0.48,I
2
=0%)
rs4762284 (12q23.1, ELK3) RAF AA AT TT RAF AA AT TT OR 95% CI P-value
UK-GWAS 0.33 373 358 94 0.30 2578 2160 462 1.18 (1.05–1.32) 0.0046
German-GWAS 0.33 372 366 95 0.28 1072 773 179 1.30 (1.14–1.49) 1.01 × 10⁻⁴
Meta 1.23 (1.13–1.34) 2.87 × 10⁻⁶
UK replication 1 0.31 258 227 52 0.30 497 408 98 1.03 (0.88–1.21) 0.6870
UK replication 2 0.34 232 287 52 0.29 534 434 85 1.30 (1.11–1.53) 0.0008
German replication 0.31 650 625 124 0.28 746 619 109 1.15 (1.02–1.29) 0.0178
Meta 1.16 (1.07–1.25) 3.85 × 10⁻⁴
Combined meta 1.19 (1.12–1.26) 8.41 × 10⁻⁹(Phet=0.17,I
2
=38%) Abbreviations: CI, confidence interval; GWAS, genome-wide association study; OR, odds ratio; RAF, risk allele frequency. Risk allele for rs35837782 is G and risk allele for rs4762284 is T.
(12q23.1, hg19 chr12:g.96612762) showed significant support for an association with BCP-ALL, with P-values and odds ratios of 3.66 × 10⁻⁶, 1.20 and 3.88 × 10⁻⁴, 1.16, respectively (Table 1; Supplementary Table S4; Supplementary Figure S3). In a meta-analysis of the discovery GWAS and replication series, these associations attained genome-wide significance (rs35837782, P= 1.38 × 10⁻¹¹ and rs4762284, P= 8.41 × 10⁻⁹; Table 1; Supplementary Table S4; Supplementary Figure S3).
Conditional association analyses
To explore the possibility of multiple risk loci at 10q26.13 and 12q23.1 and previously identified GWAS risk loci, we performed conditional analyses. At 10q26.13 and 12q23.1, we found no evidence for signals independent of SNPs rs35837782 and rs4762284. Similarly at 7p12.2, 10p12.2, 10p14, 10q21.2 and 14q11.2, we found no support for the existence of multiple risk loci.
We and others have recently sought to decipher the GWAS signal at the 9p21.3 locus.8,48–50Our conditional analysis supports the assertion of an additional locus in this region, independent of the original GWAS SNP rs3731217, which is best captured by the rare coding SNP rs3731249 (MAF = 0.03,r2= 0.005,D′= 1.00 with rs3731217; Supplementary Table S5). rs3731249, encoding CDKN2Ap.Ala148Thr, has been shown to reduce tumor suppressor function of p16INK4A, increase susceptibility to leukemic trans-formation of hematopoietic progenitor cells and to be preferen-tially retained in ALL cells.49The more common variant rs662463
correlated with rs77728904 has concurrently been suggested as a plausible causative variant underlying this new association signal48 (MAF = 0.07,r2= 0.16,D′= 1.00 with rs3731249). Despite some evidence that rs77728904 variant is acis-eQTL forCDKN2B,48 this association signal is entirely captured by rs3731249 (P-values before and after conditioning: 6.26 × 10⁻⁷and 0.10, respectively; Supplementary Table S5). Here, our analysis has been constrained to the identification of variants that can be imputed with high
fidelity, hence it does not exclude the possibility of rarer variants with higher impact, especially indels potentially impacting on ALL risk. This exemplifies the difficultly in elucidating the genetic basis of such functionally rich genomic regions. Once correcting for these two signals, no additional statistically significant association was detected in this region.
Relationship between the new ALL-risk SNPs and tumor profile Given the biological heterogeneity of BCP-ALL, we analyzed the association between rs35837782 and rs4762284 genotypes, and the major subtypes of BCP-ALL, hyperdiploidy (that is, 450 chromosomes),ETV6-RUNX1and others (Supplementary Table S6; Supplementary Figure S3). Analysis of these data provided no consistent evidence that the risk of rs35837782 and rs4762284 was confined to hyperdiploid,ETV6-RUNX1 or non-hyperdiploid/ non-ETV6-RUNX1 subtypes of B-ALL. Similarly, we found no evidence for a relationship between rs35837782 and rs4762284 genotypes, and other chromosomally defined forms of BCP-ALL defined by t(9;22)(q34;q11), t(1;19)(q23;p13) andt(4;11)(q21;q23) karyotype, orCDKN2Adeletion status after adjustment for multiple testing (Supplementary Table S6). Finally, we found no evidence that rs35837782 and rs4762284 genotypes were associated with age at diagnosis or sex, or influenced patient outcome as defined by event-free survival by analyzing data on 810 patients from the AIEOP-BFM 2002 trial (Supplementary Figure S4, Supplementary Table S7 and S8).
Impact on the heritable risk
By fitting all SNPs from GWAS simultaneously, the estimated heritability of ALL attributable to all common variation is 12.1% (±3.8%). This estimate represents the additive variance, and
therefore, does not include the potential impact of gene–gene interactions or dominance effects, or gene–environment interac-tions impacting on ALL risk. Moreover, given the evidence, albeit indirect, of a role for infectious exposure in relation to ALL risk, it is possible that substantive gene–environment effects operate. Although the currently identified risk SNPs (newly discovered and previously identified) only account for 19% of the additive heritable risk, the odds ratio effect sizes of the ALL-risk SNPs are among the highest reported in GWAS of any cancer type, and in combination they impact significantly on disease risk with those in the top 1% of genetic risk having a 6.2-fold relative risk of developing ALL (Supplementary Figure S5). The power of our GWAS to identify common alleles conferring relative risks of 1.5 or greater (such as the 7p12.2 variant) is high (~80%). Hence, there are unlikely to be many additional SNPs with similar effects for alleles with frequencies40.3 in populations of European ancestry. In contrast, our analysis had limited power to detect alleles with smaller effects and/or MAFo0.1.
Biological inference
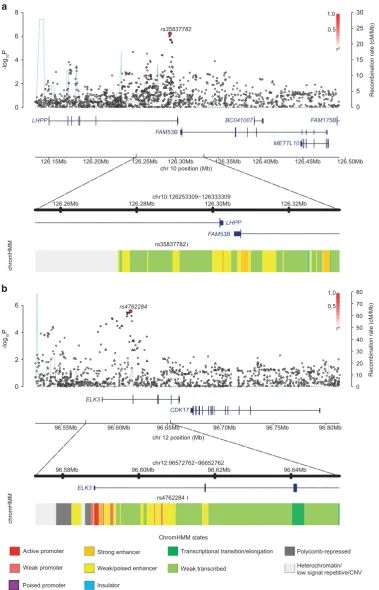
At 10q26.13, rs35837782 localizes to intron 6 on the gene encoding phospholysine phosphohistidine inorganic pyropho-sphate phosphatase (LHPP; Figure 1) with genes FAM53B and METTL10mapping nearby. The SNP rs4762284 at 12q23.1 maps to intron 1 of the gene encoding the ETS-domain protein (ELK3), with nearby genes includingCDK17(Figure 1).
To explore the epigenetic profile of association signals at each of the two new risk loci, we used HaploReg and RegulomeDB to examine whether the sentinel SNPs and those in high LD (that is, r240.8 in the 1000 Genomes EUR reference panel) annotate
putative transcription factor-binding or enhancer elements (Supplementary Table S9). The SNP rs4762284 resides within a region of open chromatin, common across multiple cell lines, consistent with a regulatory element such as an enhancer or a promoter. To gain further insight into the functional basis of rs35837782 and rs4762284 associations, we examined for an association between SNP genotype and expression of genes mapping within 1 Mb of sentinel SNPs. We made use of publicly available expression data on blood cells, lymphoblastoid cell lines from HapMap3, Geneva and the Multiple Tissue Human Expres-sion Resource pilot data. In blood, rs4762284 genotype was associated with ELK3expression at P= 6.85 × 10⁻⁴ with the risk
allele correlated with reduced expression (Supplementary Table S10).39
DISCUSSION
In this analysis of BCP-ALL, we have identified common variants at 10q26.13 and 12q23.1. It has recently been proposed that many GWAS signals are a consequence of ‘synthetic associations’, resulting from the combined effect of one or more rare causal variants rather than simply LD with a common risk variant.51,52 Support for such a model in ALL is provided by the rare high-impact variant rs3731249 in CDKN2A8 that is in LD with rs77728904. As imputation using UK10K as reference can accurately recover genotypes for variants with MAFs of 0.5%,12 the possibility that either 10q26.13 or 12q23.1 associations have a similar genetic basis is highly unlikely.
Given the existence of immunogenetic subtypes of BCP-ALL, it is perhaps not surprising there is variability in the genetic effects on ALL risk by subtype, with 10q21.2 variants influencing hyperdiploid ALL and 10p14 variants influencing non-hyperdi-ploid/non-ETV6-RUNX1 disease.6,7 In contrast to the 7p12.2 and
10p12.2 risk variants,6,7 the 10q26.13 and 12q23.1 loci have generic effects on the development of ALL.
Because rs35837782 and rs4762284 localize toLHPPandELK3, respectively, it is plausible that the functional basis of these
Figure 1. Regional plots of association results and recombination rates for the newly identified risk loci for BCP-ALL (aandb). Results for 10q26.13 (rs35837782,a) and 12q23.1 (rs4762284,b). Plots (using visPig)56show association results of both genotyped (triangles) and imputed (circles) SNPs in the GWAS samples and recombination rates.−log10P-values (yaxes) of the SNPs are shown according to their chromosomal positions (xaxes). The sentinel SNP in each combined analysis is shown as a large circle or triangle, and is labeled by its rsID. The color intensity of each symbol reflects the extent of LD with the top genotyped SNP, white (r2=0) through to dark red (r2=1.0). Genetic recombination rates, estimated using UK10K Genomes Project samples, are shown with a light-blue line. Physical positions are based on NCBI build 37 of the human genome. Also shown are the relative positions of genes and transcripts mapping to the region of association. Genes have been redrawn to show their relative positions; therefore, maps are not to physical scale. The lower panel is the chromatin-state segmentation track (ChromHMM) for lymphoblastoid cells using data from the HapMap ENCODE Project. CNV, copy-number variation.
associations are mediated through these genes. ELK3, an ETS-domain transcription factor is an attractive candidate for defining ALL susceptibilitya priorias it has a role in both B-cell development and IgH gene regulation.53 ELK3, which is a member of ETS family of transcription factors, interacting with TCF3 transcription factor 3 (E2A immunoglobulin enhancer-binding factors E12/E47) that is involved in several ALL-specific gene fusions including TCF3-PBX1/t(1;19)(q23;p13) and TCF3-HLF/t(17;19)(q23;p13) ALL.54ELK3 is highly expressed primarily at the early stages of B-lymphocyte development with expres-sion declining drastically upon B-cell maturation, correlating with the activity of the enhancer of the immunoglobulin heavy chain.53 Hence, genetically determined reduced expression is compatible with B-cell developmental arrest, a hallmark of ALL. In contrast to ELK3 evidence for a role forLHPP, which encodes a diphosphatase, in B-cell development or B-cell malignancy is yet to be established.55 Although the identified risk SNPs map
within regions of active chromatin within B cells and thus have a role in the B-cell cis-regulatory network a priori, additional laboratory follow-up is required to decipher their functional basis.
In summary, ourfindings represent a further important step in defining the contribution of inherited genetic variants to the risk of developing ALL. Our current and previousfindings are notable because we have defined associations of several regions with susceptibility to ALL, and these regions harbor plausible candidate genes for further investigation. Moreover, they emphasize the role of genetically determined expression of B-cell developmental genes being key players in ALL. Given that there remains significant missing heritability for ALL, future GWAS-based studies in concert with functional analyses are likely to lead to further insights into ALL biology.
CONFLICT OF INTEREST The authors declare no conflict of interest.
ACKNOWLEDGEMENTS
The UK Bloodwise provided principal funding for the study (13027, 13044). Support from Cancer Research UK (C1298/A8362, supported by the Bobby Moore Fund) is also acknowledged. Support from José Carreras Stiftung under project DJCLS R 13/19 is also acknowledged. The study made use of genotyping data from the Wellcome Trust Case Control Study on the 1958 Birth Cohort. We thank S Richards and J Burrett (Clinical Trials Service Unit, Oxford), J Simpson (Univ. York), P Thomson and A Hussain (Cancer Immunogenetics, School of Cancer Sciences, Univ. Manchester) for assistance with data harmonization. We thank the Childhood Leukaemia Cell Bank for access to samples. We are grateful to the UK Cancer Cytogenetics Group (UKCCG) for data collection and provision of samples. P Thompson (Paediatric and Familial Cancer, Institute of Cancer Sciences, The University of Manchester) is funded by Children with Cancer. Genotyping of German cases and controls was partly covered by funding from Tumorzentrum Heidelberg-Mannheim and Deutsche Krebshilfe. We are grateful to all the study subjects for their participation, and their clinicians who contributed to the blood sample and data collection. The Heinz Nixdorf Foundation supported the population-based Heinz Nixdorf Recall study; the genotyping of the Illumina HumanOmni-1 Quad BeadChips of the Heinz Nixdorf Recall subjects wasfinanced by the German Centre for Neurodegenerative Disorders (DZNE, Bonn). In addition, the study is funded by the German Ministry of Education and Science, and the German Research Council (DFG; Project SI 236/8-1, SI236/9-1, ER 155/6-1). We are extremely grateful to all investigators who contributed to the generation of this data set and to all subjects for their participation.
REFERENCES
1 Stiller CA, Parkin DM. Geographic and ethnic variations in the incidence of childhood cancer.Br Med Bull1996;52: 682–703.
2 Greaves M. Infection, immune responses and the aetiology of childhood leu-kaemia.Nat Rev Cancer2006;6: 193–203.
3 Crouch S, Lightfoot T, Simpson J, Smith A, Ansell P, Roman E. Infectious illness in children subsequently diagnosed with acute lymphoblastic leukemia: modeling the trends from birth to diagnosis.Am J Epidemiol2012;176: 402–408.
4 Kharazmi E, da Silva Filho MI, Pukkala E, Sundquist K, Thomsen H, Hemminki K. Familial risks for childhood acute lymphocytic leukaemia in Sweden and Finland: far exceeding the effects of known germline variants.Br J Haematol2012;159: 585–588.
5 Sherborne AL, Hosking FJ, Prasad RB, Kumar R, Koehler R, Vijayakrishnan Jet al. Variation in CDKN2A at 9p21.3 influences childhood acute lymphoblastic leukemia risk.Nat Genet2010;42: 492–494.
6 Migliorini G, Fiege B, Hosking FJ, Ma Y, Kumar R, Sherborne ALet al.Variation at 10p12.2 and 10p14 influences risk of childhood B-cell acute lymphoblastic leu-kemia and phenotype.Blood2013;122: 3298–3307.
7 Papaemmanuil E, Hosking FJ, Vijayakrishnan J, Price A, Olver B, Sheridan Eet al. Loci on 7p12.2, 10q21.2 and 14q11.2 are associated with risk of childhood acute lymphoblastic leukemia.Nat Genet2009;41: 1006–1010.
8 Vijayakrishnan J, Henrion M, Moorman AV, Fiege B, Kumar R, da Silva Filho MIet al. The 9p21.3 risk of childhood acute lymphoblastic leukaemia is explained by a rare high-impact variant in CDKN2A.Sci Rep2015;5: 15065.
9 Sherborne AL, Hemminki K, Kumar R, Bartram CR, Stanulla M, Schrappe Met al. Rationale for an international consortium to study inherited genetic susceptibility to childhood acute lymphoblastic leukemia.Haematologica2011;96: 1049–1054. 10 Enciso-Mora V, Hosking FJ, Sheridan E, Kinsey SE, Lightfoot T, Roman Eet al. Common genetic variation contributes significantly to the risk of childhood B-cell precursor acute lymphoblastic leukemia.Leukemia2012;26: 2212–2215. 11 Servin B, Stephens M. Imputation-based analysis of association studies: candidate
regions and quantitative traits.PLoS Genet2007;3: e114.
12 Huang J, Howie B, McCarthy S, Memari Y, Walter K, Min JLet al. Improved imputation of low-frequency and rare variants using the UK10K haplotype reference panel.Nat Commun2015;6: 8111.
13 Consortium UK10K, Walter K, Min JL, Huang J, Crooks L, Memari Yet al.The UK10K project identifies rare variants in health and disease.Nature2015;526: 82–90.
14 Hann I, Vora A, Richards S, Hill F, Gibson B, Lilleyman Jet al.Benefit of intensified treatment for all children with acute lymphoblastic leukaemia: results from MRC UKALL XI and MRC ALL97 randomised trials. UK Medical Research Council's Working Party on Childhood Leukaemia.Leukemia2000;14: 356–363. 15 Vora A, Goulden N, Wade R, Mitchell C, Hancock J, Hough Ret al.Treatment
reduction for children and young adults with low-risk acute lymphoblastic leu-kaemia defined by minimal residual disease (UKALL 2003): a randomised controlled trial.Lancet Oncol2013;14: 199–209.
16 Penegar S, Wood W, Lubbe S, Chandler I, Broderick P, Papaemmanuil Eet al. National study of colorectal cancer genetics.Br J Cancer2007;97: 1305–1309. 17 Wang Y, Broderick P, Webb E, Wu X, Vijayakrishnan J, Matakidou Aet al.Common
5p15.33 and 6p21.33 variants influence lung cancer risk. Nat Genet2008;40: 1407–1409.
18 Conter V, Bartram CR, Valsecchi MG, Schrauder A, Panzer-Grumayer R, Moricke A et al. Molecular response to treatment redefines all prognostic factors in children and adolescents with B-cell precursor acute lymphoblastic leukemia: results in 3184 patients of the AIEOP-BFM ALL 2000 study.Blood2010; 115: 3206–3214.
19 Purcell S, Neale B, Todd-Brown K, Thomas L, Ferreira MA, Bender Det al.PLINK: a tool set for whole-genome association and population-based linkage analyses. Am J Hum Genet2007;81: 559–575.
20 Liu JZ, Tozzi F, Waterworth DM, Pillai SG, Muglia P, Middleton Let al.Meta-analysis and imputation refines the association of 15q25 with smoking quantity.Nat Genet 2010;42: 436–440.
21 Marchini J, Howie B, Myers S, McVean G, Donnelly P. A new multipoint method for genome-wide association studies by imputation of genotypes.Nat Genet2007; 39: 906–913.
22 Howie BN, Donnelly P, Marchini J. Aflexible and accurate genotype imputation method for the next generation of genome-wide association studies.PLoS Genet 2009;5: e1000529.
23 Delaneau O, Marchini J, Zagury JF. A linear complexity phasing method for thousands of genomes.Nat Methods2012;9: 179–181.
24 Price AL, Patterson NJ, Plenge RM, Weinblatt ME, Shadick NA, Reich D. Principal components analysis corrects for stratification in genome-wide association stu-dies.Nat Genet2006;38: 904–909.
25 Patterson N, Price AL, Reich D. Population structure and eigenanalysis.PLoS Genet 2006;2: e190.
26 de Bakker PI, Ferreira MA, Jia X, Neale BM, Raychaudhuri S, Voight BF. Practical aspects of imputation-driven meta-analysis of genome-wide association studies. Hum Mol Genet2008;17: R122–R128.
27 Higgins JP, Thompson SG. Quantifying heterogeneity in a meta-analysis.Stat Med 2002;21: 1539–1558.
28 Myers S, Bottolo L, Freeman C, McVean G, Donnelly P. Afine-scale map of recom-bination rates and hotspots across the human genome.Science2005;310: 321–324.
29 Gabriel SB, Schaffner SF, Nguyen H, Moore JM, Roy J, Blumenstiel Bet al.The structure of haplotype blocks in the human genome.Science2002;296: 2225–2229. 30 ENCODE Project Consortium An integrated encyclopedia of DNA elements in the
human genome.Nature2012;489: 57–74.
31 Ward LD, Kellis M. HaploReg: a resource for exploring chromatin states, con-servation, and regulatory motif alterations within sets of genetically linked var-iants.Nucleic Acids Res2012;40(Database issue): D930–D934.
32 Boyle AP, Hong EL, Hariharan M, Cheng Y, Schaub MA, Kasowski Met al. Anno-tation of functional variation in personal genomes using RegulomeDB.Genome Res2012;22: 1790–1797.
33 Ng SB, Turner EH, Robertson PD, Flygare SD, Bigham AW, Lee Cet al.Targeted capture and massively parallel sequencing of 12 human exomes.Nature2009; 461: 272–276.
34 Cooper GM, Stone EA, Asimenos G, NISC Comparartive Sequencing Program, Green ED, Batzoglou Set al.Distribution and intensity of constraint in mammalian genomic sequence.Genome Res2005;15: 901–913.
35 Kircher M, Witten DM, Jain P, O'Roak BJ, Cooper GM, Shendure J. A general framework for estimating the relative pathogenicity of human genetic variants. Nat Genet2014;46: 310–315.
36 Adzhubei IA, Schmidt S, Peshkin L, Ramensky VE, Gerasimova A, Bork Pet al.A method and server for predicting damaging missense mutations.Nat Methods 2010;7: 248–249.
37 Hnisz D, Abraham BJ, Lee TI, Lau A, Saint-Andre V, Sigova AA et al. Super-enhancers in the control of cell identity and disease.Cell2013;155: 934–947. 38 Nica AC, Parts L, Glass D, Nisbet J, Barrett A, Sekowska Met al.The architecture of
gene regulatory variation across multiple human tissues: the MuTHER study.PLoS Genet2011;7: e1002003.
39 Westra H-J, Peters MJ, Esko T, Yaghootkar H, Schurmann C, Kettunen Jet al. Systematic identification of trans eQTLs as putative drivers of known disease associations.Nat Genet2013;45: 1238–1243.
40 Sulong S, Moorman AV, Irving JA, Strefford JC, Konn ZJ, Case MCet al.A com-prehensive analysis of the CDKN2A gene in childhood acute lymphoblastic leu-kemia reveals genomic deletion, copy number neutral loss of heterozygosity, and association with specific cytogenetic subgroups.Blood2009;113: 100–107. 41 Schwab CJ, Chilton L, Morrison H, Jones L, Al-Shehhi H, Erhorn Aet al.Genes
com-monly deleted in childhood B-cell precursor acute lymphoblastic leukemia: associa-tion with cytogenetics and clinical features.Haematologica2013;98: 1081–1088. 42 Kaplan EL, Meier P. Nonparametric estimation from incomplete observations.
J Am Stat Assoc1958;53: 457–481.
43 Mantel N. Evaluation of survival data and two new rank order statistics arising in its consideration.Cancer Chemother Rep1966;50: 163–170.
44 Kalbfleisch JD, Prentice RL.The Statistical Analysis of Failure Time Data, John Wiley & Sons, Inc., New York, NY, USA, 1980.
45 Gray RJ. A class of K-sample tests for comparing the cumulative incidence of a competing risk.Ann Stat1988;19: 1141–1154.
46 Yang J, Lee SH, Goddard ME, Visscher PM. GCTA: a tool for genome-wide complex trait analysis.Am J Hum Genet2011;88: 76–82.
47 Pharoah PD, Antoniou A, Bobrow M, Zimmern RL, Easton DF, Ponder BA. Poly-genic susceptibility to breast cancer and implications for prevention.Nat Genet 2002;31: 33–36.
48 Hungate EA, Vora SR, Gamazon ER, Moriyama T, Best T, Hulur Iet al.A variant at 9p21.3 functionally implicates CDKN2B in paediatric B-cell precursor acute lym-phoblastic leukaemia aetiology.Nat Commun2016;7: 10635.
49 Xu H, Zhang H, Yang W, Yadav R, Morrison AC, Qian Met al.Inherited coding variants at the CDKN2A locus influence susceptibility to acute lymphoblastic leukaemia in children.Nat Commun2015;6: 7553.
50 Walsh KM, de Smith AJ, Hansen HM, Smirnov IV, Gonseth S, Endicott AAet al.A heritable missense polymorphism in CDKN2A confers strong risk of childhood acute lymphoblastic leukemia and is preferentially selected during clonal evolu-tion.Cancer Res2015;75: 4884–4894.
51 Anderson CA, Soranzo N, Zeggini E, Barrett JC. Synthetic associations are unlikely to account for many common disease genome-wide association signals.PLoS Biol 2011;9: e1000580.
52 Wray NR, Purcell SM, Visscher PM. Synthetic associations created by rare variants do not explain most GWAS results.PLoS Biol2011;9: e1000579.
53 Lopez M, Oettgen P, Akbarali Y, Dendorfer U, Libermann TA. ERP, a new member of the ets transcription factor/oncoprotein family: cloning, characterization, and differential expression during B-lymphocyte development.Mol Cell Biol1994;14: 3292–3309.
54 Moorman AV. The clinical relevance of chromosomal and genomic abnorma-lities in B-cell precursor acute lymphoblastic leukaemia.Blood Rev 2012; 26: 123–135.
55 Yokoi F, Hiraishi H, Izuhara K. Molecular cloning of a cDNA for the human phospholysine phosphohistidine inorganic pyrophosphate phosphatase.J Bio-chem2003;133: 607–614.
56 Scales M, Jager R, Migliorini G, Houlston RS, Henrion MYR. visPIG - A Web Tool for Producing Multi-Region, Multi-Track, Multi-Scale Plots of Genetic Data.PLoS ONE 2014;9: e107497.
This work is licensed under a Creative Commons Attribution 4.0 International License. The images or other third party material in this article are included in the article’s Creative Commons license, unless indicated otherwise in the credit line; if the material is not included under the Creative Commons license, users will need to obtain permission from the license holder to reproduce the material. To view a copy of this license, visit http://creativecommons.org/licenses/ by/4.0/
© The Author(s) 2017
Supplementary Information accompanies this paper on the Leukemia website (http://www.nature.com/leu)