www.ocean-sci.net/10/49/2014/ doi:10.5194/os-10-49-2014
© Author(s) 2014. CC Attribution 3.0 License.
Ocean Science
Tidal variability of the motion in the Strait of Otranto
L. Ursella, V. Kovaˇcevi´c, and M. Gaˇci´c
Istituto Nazionale di Oceanografia e di Geofisica Sperimentale (OGS), B.go Grotta Gigante 42/c, 34010 Sgonico (TS), Italy
Correspondence to: L. Ursella (lursella@ogs.trieste.it)
Received: 24 January 2013 – Published in Ocean Sci. Discuss.: 5 March 2013
Revised: 15 November 2013 – Accepted: 2 January 2014 – Published: 13 February 2014
Abstract. Various current data, collected in the Strait of Otranto during the period 1994–2007, have been analysed with the aim of describing the characteristics of the tidal mo-tions and their contribution to the total flow variance. The principal tidal constituents in the area were the semi-diurnal (M2) and the diurnal (K1), with the latter one predominant. The total flow was, in general, more energetic along the flanks than in the middle of the strait. Specifically, it was most energetic over the western shelf and in the upper layer along the eastern flank. In spite of the generally low veloc-ities (a few cm s−1) of the principal tidal constituents, the tidal variance has a pattern similar to that of the total flow variance, that is, it was large over the western shelf and low in the middle. The proportion of non-tidal (comprising the inertial and sub-inertial low-frequency bands) to tidal flow variances was quite variable in both time and space. The low-frequency motions dominated over the tidal and inertial ones in the eastern portion of the strait during the major part of the year, particularly in the upper and intermediate layers. In the deep, near-bottom layer the variance was evenly distributed between the low frequency, diurnal and semi-diurnal bands. An exception was observed near the western shelf break dur-ing the summer season when the contribution of the tidal sig-nal to the total variance reached 77 %. This high contribution was mainly due to the intensification of the diurnal signal at that location at both upper and bottom current records (veloc-ities of about 10 cm s−1). Local wind and sea level data were analysed and compared with the flow to find the possible ori-gin of this diurnal intensification. Having excluded the sea-breeze impact on the intensification of the diurnal tidal sig-nal, the most likely cause remains the generation of the topo-graphically trapped internal waves and the diurnal resonance in the tidal response. These waves were sometimes generated by the barotropic tidal signal in the presence of summer strat-ification and the strong bottom slope. This phenomenon may
stimulate diapycnal mixing during the stratified season and enhance ventilation of the near-bottom layers.
1 Introduction
The notion of tidal variability was historically better de-scribed from the measurements of the sea level than from measurements of the sea currents. The simplicity, low cost and easy maintenance of the tide gauges at the coast com-pared to current-meter moorings are the main reason for this historical discrepancy. Therefore, the study of the sea level tidal oscillations in the Adriatic Sea has a long and rich his-tory (summarized by Cushman et al., 2001). The sea level tidal oscillations are of the mixed type, and are well repro-duced, taking into account the seven major tidal constituents, namely, K1, O1, P1 (diurnal) and M2, S2, K2, N2 (semi-diurnal band).
off the Gargano promontory (at around 16◦E; 42◦N), that is, south of the one for the sea level (Ursella and Gaˇci´c, 2001). The maxima in the current tide therefore correspond to zero amplitude in the sea level (Hendershott and Speranza, 1971). From numerical model studies, Malaˇciˇc et al. (2000) explained the dynamics of semi-diurnal and diurnal tides in the northern Adriatic with a general theory of gravity and to-pographic waves. Thus, the M2 tide is well represented by a Kelvin wave that propagates along the basin, as gravity dominates, while K1 is well approximated by a continental shelf wave propagating across the basin as topographic ef-fects dominate. Book et al. (2009b) showed that in the north-ern Adriatic the K1 tide displayed a behaviour of both a to-pographic Rossby wave and a Kelvin wave, with departure from Kelvin behaviour where bathymetry is steep. In addi-tion to the above-menaddi-tioned papers there has been a consid-erable amount of other theoretical and observational research on tides; results and findings up to 2001 are summarized by Cushman-Roisin et al. (2001).
Current-meter measurements of sufficient duration to de-termine the tidal flow constituents have been something of a challenge all over the Adriatic Sea due to high costs, and instrument losses caused mainly by heavy fishery activities. Tidal currents derived from current-meter measurements as found in the literature refer predominantly to the northern Adriatic Sea. In particular, studies in the channels along the eastern coast (references in Cushman-Roisin et al., 2001) showed tidal flow ranges between 1 and 10 cm s−1. Tidal characteristics of the surface current along the northern Ital-ian coast were studied by Budillon et al. (2002), Kovaˇcevi´c et al. (2004) and Chavanne et al. (2007), while the detailed vertical pattern of the tidal flow throughout the water col-umn was examined in the northernmost part of the basin by Book et al. (2009a) and in the central Adriatic by Martin et al. (2009). All these studies show that the values of the semi-major axes are a few cm s−1(M2 was mostly between 5 and 7 cm s−1and K1 between 2 and 4 cm s−1).
However, a basin-wide survey in 1995 by a Vessel Mounted Acoustic Doppler Current Profiler (VM-ADCP) enabled a detailed description of the distribution of the M2 tidal current ellipses for a wider area of the Adriatic basin (Ursella and Gaˇci´c, 2001).
Poulain (2013) derived the characteristics of the surface tidal flow for the first time from the drifters that populated the Adriatic Sea between 1990 and 2006. The tidal ellipses of the M2, S2 and K1 constituents are given on a 0.25◦×0.25◦ grid over the entire Adriatic area. The author emphasized that despite all the shortcomings intrinsic to the measurements, the estimates of the surface tidal flow are generally in good qualitative agreement with the observations.
Recent numerical modelling studies on tides (Cushman-Roisin and Naimie, 2002; Janekovi´c et al., 2003; Janekovi´c and Kuzmi´c, 2005; Guarnieri et al., 2013) are based on 3-D, high-resolution models. In particular, Janekovi´c and Kuzmi´c (2005) obtained satisfactory results,
as demonstrated from the comparison of numerical data with the observed sea levels from several tide gauges around the coast, and with some sporadic current-meter data from several locations in the northern Adriatic Sea. Guarnieri et al. (2013) established the importance of the tidal influence on the mean circulation, mixing, and consequently on the distribution of water masses in the basin. Particularly in the regions of freshwater influence (like south of the Po River delta) near-bottom transports of temperature and salinity in both along- and across-shore direction, are much better reproduced with tides included.
On the other hand, studies based on detailed observations of tidal currents across the Strait of Otranto have not been made before. From some sporadic and short-lasting measure-ments that were conducted in the eighties and nineties in that area (i.e., Michelato and Kovaˇcevi´c, 1991; Leder et al., 1992; Ferentinos and Castanos, 1988) it turned out that the flow has prominent diurnal and inertial fluctuations. From the current measurements in the adjacent southern Adriatic, Vilibi´c et al. (2010) found evidence of fortnightly oscillations of the flow over the shelf break in phase with Mf tide (period 13.66 days).
In numerical studies the strait has been considered either as an open boundary of the Adriatic Sea (i.e, Janekovi´c and Kuzmi´c, 2005) or as a part of the wider area. A tidal model of the barotropic M2 for the whole Mediterranean was de-veloped by Lozano and Candela (1995). While the results agreed well over most of the Adriatic with the findings of Ursella and Gaˇci´c (2001), a full comparison for the Strait of Otranto was not possible because of the lack of measure-ments.
The long-term current time-series collected in the Strait of Otranto intermittently from the 1990s until 2007 form a unique data set for studying the flow characteristics in the area, primarily as the exchange of water and biogeochemical properties between the Adriatic and Ionian Sea. In the past studies the emphasis was put on the low frequency (with pe-riods of about a week), and seasonal flow and transport vari-ability (Gaˇci´c et al., 1996; Vetrano et al., 1999; Kovaˇcevi´c et al., 1999; Ursella et al., 2011, 2012; Yari et al., 2012) or on the inter-annual variability related to the processes of the dense water formation (Manca et al., 2002). The interest in the transport rate and its seasonal and inter-annual variability did not include a thorough and exhaustive analysis of the flow in the diurnal and semi-diurnal tidal frequency bands. So, we addressed here these latter topics, and the phenomenon of baroclinic diurnal tide intensification in the deep layers over the western shelf edge.
amplified and polarized in the near-bottom layer. Such effects were not observed in the semi-diurnal response.
However, in the study of the Adriatic tides some non-tidal phenomena should be taken into account because their typ-ical frequencies are close to the tidal ones. In particular, in the Adriatic, there are two basin-wide resonant modes of sea-level oscillations, seiches, at the periods around 22 and 11 h with maximum for the amplitude in the sea level at the north-ern end of the Adriatic Sea (Cushman-Roisin et al., 2001). Seiches are an important response to atmospheric forcing in the Adriatic (Ceroveˇcki et al., 1997; Leder and Orli´c, 2004). The longest seiche period (21–22 h) is very close to the daily tidal constituents (such as OO1 and UPS1). As they are free modes of oscillation of the basin, they are theoreti-cally present all throughout the year (Cushman-Roisin et al., 2001), but the probability that important events happen dur-ing summer at 22 h is really low. In fact, experimental ev-idence of strong events has been found almost exclusively during the late autumn/winter period of the year (from Octo-ber to April) due to the presence of low-air-pressure/sirocco-wind events (Ceroveˇcki et al., 1997; Comune di Venezia, 2013). Other important features present in the energy spectra are the inertial oscillations, whose period for the Adriatic is around 17–18 h (therefore, in between the two tidal bands) and the sea-breeze events whose period of variability is 24 h (Klai´c et al., 2009). The energy of all these oscillations, if their frequencies are not properly resolved, can leak into the tidal range and create misleading interpretations of the phe-nomena.
This paper is structured as follows: data and methods are presented in Sect. 2, description of the spatial and seasonal variability of the tidal signal is given in Sect. 3, detailed con-siderations of the bottom layer characteristics are exposed in Sect. 4, intensification of the diurnal tide at the western shelf-break and slope is discussed in Sect. 5 and, finally, Sect. 6 contains concluding remarks.
2 Data and methods
2.1 Mooring arrangement and deployment
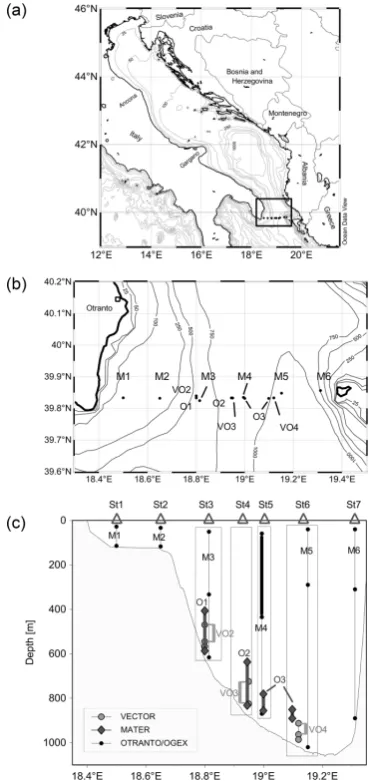
We used data collected from the mooring arrays in the Strait of Otranto (Fig. 1) during three long-term observa-tions. The first set of observations from February 1994 to November 1995 is common to the Mediterranean Targeted Project (MTP) – OTRANTO and to the Otranto Gap EX-periment (OGEX), indicated as OTRANTO/OGEX projects (Fig. 2a). The second set of observations from March 1997 to July 1999 (Fig. 2b) comes from the MTP II-MATER (MAss Transfer and Ecosystem Response) project. The third one, from November 2006 to April 2007 (Fig. 2c), is obtained in the framework of the VECTOR (VulnErabilità delle Coste e degli ecosistemi marini italiani ai cambiamenti climaTici e loro ruolO nei cicli del caRbonio mediterraneo) project.
Fig. 1. (a) Study area in the Strait of Otranto at the southern end
of the Adriatic Sea, depicted by a rectangle and expanded in (b).
(b) Mooring locations with original station nomenclature. Sea level
and wind are available at the coast in Otranto. (c) Vertical scheme of the mooring lines: thick lines indicate layers covered by ADCPs. Both the original station nomenclature and the one adopted in this paper (St1, . . . , St7) are indicated. St3, St4, St5 and St6 enclose 2 or 3 moorings within dashed-line rectangles. Current measurements were conducted within the framework of different projects (see leg-end) during the time interval 1994–2007. Depth contours in (a) and
(b) are in metres.
instrument and battery malfunctioning. The moorings at lo-cations M1 and M2 on the western side included two cur-rent meters, while moorings in the central and western parts at locations M3, M5 and M6 included three current meters (Fig. 1). Four types of self-recording current meters were used on the moorings. The NBA-DNC-2B with rotor and EG&G SMART acoustic current meters recorded a mean speed and instantaneous direction every 20 and 10 min, re-spectively. The Aanderaa RCM7 current meter recorded an hourly current vector averaged from 50 samples taken ev-ery 72 s. At M4 only, apart from the bottom current meter, an RDI ADCP operating at 75 KHz was deployed at about 430 m below the sea surface, looking upward to measure the currents in the water column in 8 m bins. The accuracy of the aforementioned instruments for measuring the speed and di-rection are 1 cm s−1and 3–7.5 degrees, respectively. Because
of the high vertical correlation of the ADCP current data, the time series from just the uppermost and the lowermost cells (near-surface layer and mid-depth) were considered repre-sentative of the upper and intermediate layers, respectively. All the moorings were recovered almost every 3 months and redeployed after maintenance. The available time series are indicated in Fig. 2a.
MATER moorings were equipped with RDI BB ADCPs that recorded the deep currents above the seabed, within about 160 m at stations O1 and O2 and about 50 m at O3, with a vertical resolution of 5 m and a sampling rate of 30 min. MATER moorings were deployed five times and each data series is about 6 months long (Fig. 2b).
VECTOR moorings were equipped with: (i) an Aanderaa current-meter, 17 m above the seabed, whose sampling rate was 30 min; (ii) a conductivity–temperature SBE37 CT probe 2 m above the current meter, with a sampling rate of 15 min; and (iii) an upward-looking RDI ADCP 10 m above the CT, with a sampling interval of 15 min. The ADCP measure-ments covered a layer of about 100 m at station V3 and of about 80 m at V2 and V4.
A detailed description of the mooring arrangement and schedule during the MATER and VECTOR projects can be found in Ursella et al. (2012) and references therein. The VECTOR stations V2, V3 and V4 correspond to O1, O2 and O3 in the MATER project, and stations M3 and M4 of the OTRANTO/OGEX projects roughly coincide with V2 and V3, respectively (Fig. 1). Henceforth, a unique nomenclature is introduced: St1 for station M1, St2 for station M2, St3 for stations M3, O1 and V2, St4 for O2 and V3, St5 for M4 and O3 for the first measurement phase, St6 for M5, O3 and V4 and, finally, St7 for M6.
2.2 Data processing
For all the analysis considered herein, each ADCP cell was considered as an independent time series and each measurement period separately analysed. ADCP data and current-meter series were treated in the same way, using the
same procedure in data analysis. Quality control was carried out, removing spikes and bad data, while the missing data within the gaps lasting for less than 6 h were linearly inter-polated.
Three periods were chosen for the OTRANTO/OGEX projects: PR1 (51 days), from 3 December, 1994 to 25 Jan-uary, 1995; PR2 (97 days), from 20 May to 26 August, 1995; and PR3 (83 days), from 27 August to 18 November, 1995 (Fig. 2a). These three periods were considered roughly as winter, summer and autumn seasons. They were selected for the sake of the best possible time and space coverage along the Otranto section.
For the other two projects, MATER and VECTOR, only bottom-layer data were available. The periods for the anal-ysis differ from the OTRANTO/OGEX ones, and they are simply the periods of each deployment (Fig. 2 b, c). It must be kept in mind that during the first phase of MATER (A), mooring O3 was positioned at station St5 while during the other measurement phases it was deployed at station St6 and was therefore deeper.
On the edited and interpolated data, rotary spectra were calculated for each instrument depth and period. The follow-ing different window lengths were applied: 512 points (21 days) for OTRANTO/OGEX hourly data and 1024 and 2048 points for raw, originally sampled MATER and VECTOR ADCP data, respectively. The overlapping period always cor-responded to the window half-length. The length of the win-dow in all cases permitted to resolve tidal signal from seiches and inertial oscillations. Harmonic analysis (Foreman, 1978) was applied in order to obtain tidal constituents. Harmonic analysis calculations were done using the Matlab programme t_tide (Pawlowicz et al., 2002), which automatically selects the tidal constituents resolvable with the data set used. More-over, nodal corrections were taken into account in our anal-yses in order to properly consider the modulation and there-fore intensification of tidal constituents. The method also en-ables calculation of the percentage of the total variance ac-counted for by the resolved tidal signal.
For the purposes of the analysis of Sect. 5 only, the periods of the OTRANTO/OGEX project were selected in a different way with respect to PR1, PR2 and PR3.
3 Spatial and seasonal variability of the tidal signal over the entire Otranto section
The data from the OTRANTO/OGEX projects were the only ones that covered the entire Otranto section and were there-fore used to study the vertical and horizontal variability of the tidal motion.
Fig. 2. Time diagram of the available current meter data within (a) the OTRANTO/OGEX projects. Shaded areas correspond to time intervals
for which rotary spectral analysis was done (PR1, PR2, and PR3) (b) MATER project. Time intervals A, B, C, D and E are indicated. (c) VECTOR project.
3.1 Variance and spectral analysis
Figure 3 summarizes the variance in the three layers within each period at different moorings. The tidal signal is com-posed of all the constituents resolved by the harmonic anal-ysis. In this way, owing to the finite length of the time se-ries, tidal variance can be slightly overestimated (by about 3–4 %), due to the fact that some non-tidal phenomena are close in frequency to some tidal ones and part of their vari-ance can enter in the tidal varivari-ance (low-pass signal versus MM/MFS or 22 h seiche versus UPS1/OO1). This must be kept in mind when interpreting the results. The percentage of the predicted variance to the total one is also depicted. The percentage was always below 40 %, apart from the stratified period PR2: at St2, it reached about 60 % at the top and 77 % at the bottom, and at St7-bottom the value was 47 %.
The upper-layer tidal analysis was based on current mea-surements at depths varying between 28 and 42 m below the sea surface. Moreover, the upper current meter at St2 during period PR2 was positioned at 56 m depth. The western flank of the strait (station St1) was characterized by the largest total variance (Fig. 3) and by the largest tidal variance as well. The central portion of the strait had total and tidal variances lower than at both flanks. The only comparison available for
the nearby locations over the western shelf (St1 and St2) was for the period PR1, during which the total and tidal vari-ances decreased rapidly in the offshore direction. A signif-icant fluctuation in the variance in time and space is due to the varying energy levels of both the tidal and the non-tidal bands. The spectral characteristics of the upper layer show that the flow variance was distributed principally among the tidal oscillations (diurnal and semi-diurnal), inertial oscilla-tions (0.053454 cph–18.7 h period) and a long-period motion (Fig. 4). The diurnal tidal band was more energetic than the semi-diurnal one. Moreover, at the shelf break (station St2) during period PR2 the diurnal one was the principal peak in the spectrum, with particularly high energy at negative fre-quencies (indicating a clockwise rotation of the tidal vector). Inertial oscillations, indicated by a dominant peak at a neg-ative frequency, were more energetic than the diurnal one, except during the stratified (PR2) period at the shelf break (station St2). During PR1 and PR3 the low-frequency band was predominant and it was more energetic at the flanks, both eastern (station St7) and western (station St1), than in the middle of the strait (Fig. 4).
Fig. 3. Total variance (black bars), predicted variance (grey bars),
and the contribution of predicted to total (%; continuous line) due to all resolved tidal constituents along the Otranto section, from OTRANTO/OGEX data for the three time intervals PR1 (a), PR2
(b) and PR3 (c). Symbols s, i, and b stand for surface, intermediate
and bottom layers, respectively.
extremely low energetics at these depths. The spectral char-acteristics (not shown) indicate that low-frequency motion was the most energetic. Inertial oscillations were attenuated with respect to the upper layer (Fig. 4), and displayed values similar to those of the semi-diurnal and diurnal tides.
In the bottom layer, total variance (Fig. 3) was larger over the continental shelf (station St1), gradually diminishing in the offshore direction. The tidal contribution also diminished from the shelf toward the eastern flank. Tidal variance was exceptionally high over the shelf edge (station St2) during the stratified PR2 time interval. In general, the low-frequency motion (Fig. 5) was the most energetic; however, an excep-tion to this was observed at staexcep-tion St2 during all the three periods, when the diurnal signal was higher than the low pass or even dominated. In addition, during PR2 the semi-diurnal band was as energetic as the low-frequency one. As for the upper layer, the sense of rotation was clockwise. In the central deep portion of the strait (stations St5 and St6), the low frequency dominated over the tidal and inertial ones.
Fig. 4. Rotary spectral analysis in the upper layer along the Otranto
section for the three time intervals PR1, PR2, and PR3 from the OTRANTO/OGEX project. The 95 % confidence level is indicated. f is the Coriolis parameter divided by 2π.
In conclusion, the total variance was maximum at the westernmost two stations and at the easternmost surface one. Predicted tidal variance behaved similarly to the total vari-ance. A behaviour was different during the period PR2 at St2 (near the shelf break), when the tidal variance was large, and when its contribution to the total variance was maximum (77 %).
3.2 Harmonic analysis
Fig. 5. Rotary spectral analysis in the near-bottom layer along the
Otranto section for the three time intervals PR1, PR2, and PR3 from OTRANTO/OGEX project. The 95 % confidence level is indicated. f is the Coriolis parameter divided by 2π.
Tidal constituents MM and MFS, with frequencies of 0.0015 and 0.0028 cph, respectively (that is, with periods of 27.78 and 14.88 days), are grouped into the long-term tidal band. Their amplitudes were highly variable in time and space (not shown), probably due to the fact that with harmonic analysis it is not always possible to distinguish be-tween the astronomical tidal forcing and the non-tidal low-frequency meteorological signal with periods of about 10 days or more. The largest amplitudes of this signal were en-countered along the western and eastern flanks, while the smallest were in the central part, resembling the pattern of the entire non-tidal variance (Fig. 3).
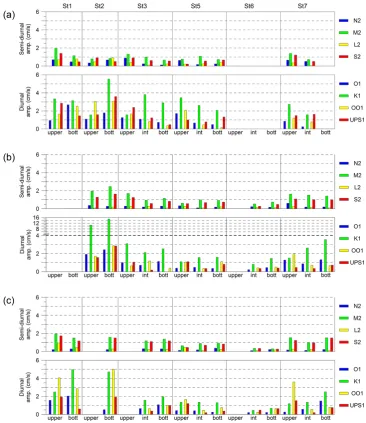
Figure 6 summarizes the semi-major-axis amplitudes of some of the diurnal and semi-diurnal tidal ellipses. It shows the most relevant constituents for the Adriatic (Cushman-Roisin et al., 2001), except P1 and K2 that are not resolved. There are few other constituents with amplitudes in some cases comparable to that of the principal ones (i.e., OO1, UPS1, and L2). Concerning these last constituents, it must be kept in mind that their frequency is very close to the 22 h
seiche. The constituents that showed the largest value of the tidal ellipse semi-major axis, namely K1 (0.04178 cyc h−1)
and M2 (0.08051 cyc h−1), were taken as representative of
the corresponding band. Amplitude of the K1 constituent was always below 6 cm s−1except at station St2, where it reached 10 and 15 cm s−1in the upper and bottom records, respec-tively, during the stratified period PR2. Amplitudes of the M2 constituent were always below 3 cm s−1. The K1 semi-major axes of tidal ellipses were almost twice those of M2 and were thus the main tidal signal in the flow. This kind of relation-ship between K1 and M2 is opposite to the one typical in the northern Adriatic Basin, where M2 prevails over K1, as ob-served also by Poulain (2013). The M2 tidal constituent had somewhat larger amplitudes along the flanks and smaller in the centre of the section. It did not show much change from PR1 to PR3. There was, in contrast and as already mentioned, an anomalous feature of the diurnal constituent K1: an am-plification at the shelf break (station St2) just encountered in the OTRANTO/OGEX summer time series (PR2 period). Unfortunately, due to the lack of measurements on the shelf, no confirmation of this characteristic was encountered either during other periods of the OTRANTO/OGEX or during the MATER and VECTOR projects. The intensification at the shelf break is described and discussed in detail in Sect. 5.
4 Detailed look into the bottom layer in the deep portion of the strait
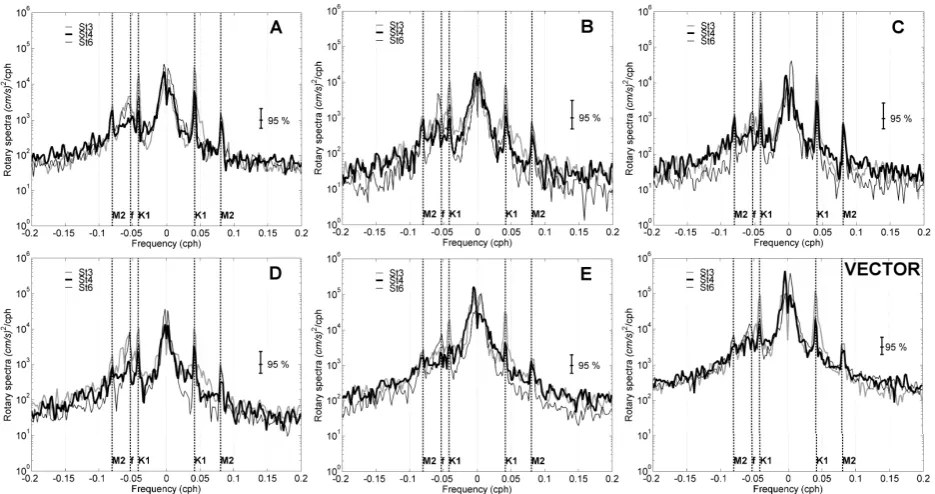
The data set from the MATER and VECTOR projects per-mits accurate description of the tides in the bottom layer. Rotary spectra (Fig. 7) show that inertial, diurnal and semi-diurnal bands were always present at all stations and during all periods. The energy of these peaks was lower at station St4 during the last MATER measurement phase (E). In par-ticular, the diurnal constituent was always more energetic at location St3 than at other locations, where its energy could be almost as high as the energy of the low-frequency band. This characteristic may indicate an amplification of the diur-nal tidal sigdiur-nal near the shelf break (see the position of St3 in Fig. 1). Moreover, no significant differences in the spec-tra were found between upper and lower cells at any current meter (not shown).
Fig. 6. Semi-major axes of the tidal ellipses for the diurnal and semi-diurnal tidal constituents, obtained from the harmonic analysis applied to
the periods PR1 (a), PR2 (b) and PR3 (c) of the OTRANTO/OGEX projects. Upper, intermediate (int) and bottom (bott) layers are indicated. Please note the change of the amplitude scale for the diurnal plot in (b).
was more important than in the deep central part of the strait. The lowest tidal contribution to the total variance was found at St4, indicating a variability in the current field due prin-cipally to non-tidal phenomena. Finally, the lowest percent-ages at the three stations were found during period E, when the non-tidal variability was rather strong.
Tidal semi-major axes for the two main constituents, K1 and M2, are depicted in Fig. 9 together with the orientation of the tidal ellipses. The K1 amplitude was always larger than M2 and it assumed the greatest values at location St3, reach-ing 3 to 5 cm s−1during all the periods except phase D when
it was about 2 cm s−1. The K1 amplitudes slightly increased
with depth at location St3, decreased at St4 and were constant or increased at St5 and St6. In contrast, the M2 amplitudes
Fig. 7. Rotary spectra for the deepest ADCP cell during five MATER periods (A, B, C, D and E) and VECTOR. Inertial (f) and principal tidal frequencies (M2 and K1) are indicated by dashed lines.f is the Coriolis parameter divided by 2π.
5 Intensification of diurnal tide at the shelf-break and slope
As described in the previous sections, the diurnal K1 tide at the shelf break (station St2) had larger amplitude dur-ing the summer-like period PR2 (when the water column is stratified) compared to other sites. In addition, a weaker in-tensification just down-slope was observed at station St3 dur-ing the MATER and VECTOR periods. It seems that there was no similar manifestation at the inshore station St1 over the shelf. However, because of the measurement gaps it was not possible to compare the flow characteristics at the two locations, St1 and St2, for the same time period, but only for two periods similar as far as the density stratification is con-cerned, i.e. summers 1994 and 1995, as shown in Fig. 10. If we suppose that the circulation at location St1 during sum-mer 1994 is representative of the stratified conditions in gen-eral, it is evident from Fig. 11 that during summer the di-urnal signal predominated only at location St2 (shelf edge). The cross-shelf u component was of the same sign in the upper and in the bottom layers (Fig. 11a), even though the magnitude was different (larger at the bottom); the findings for the along-shelfvcomponent were similar (Fig. 11b). The current components at location St1 were very different and occasionally of the opposite sign between the upper (depth 30 m) and the bottom layers (Fig. 11d, e). In addition, tem-perature measured at the current-meters at St2 has been con-sidered (Fig. 11c). In the bottom, oscillations with relatively large amplitudes are evident in mid- and late July, and in
late August 1995; these oscillations have a diurnal period, as specified by means of the Continuous Wavelet Transform spectra (not shown). The Wavelet Transform performs a de-composition of the variability in time and scales, determining the time variability of the spectra at each scale. The same sig-nal is not as evident in the upper series.
In the follow-up, we discuss the possible mechanisms re-sponsible for the observed diurnal intensification near the shelf edge during summer.
5.1 Possible generation mechanisms
Fig. 8. Total variance (black dots), predicted variance (grey dots) and its contribution to the total one (%) as a function of depth. The predicted
variance was calculated considering all the resolved tidal constituents (35) along the Otranto section, from MATER (periods A, B, C, D and E) and VECTOR data. Note that during period A, to avoid overlapping, the variances at St5 are plotted adding 60 m to the true depth.
Fig. 9. Semi-major axes for K1 (black dots) and M2 (grey dots) with tidal ellipse orientation angle (in degrees anticlockwise from East) as
a function of depth. The semi-axes were calculated with harmonic analysis for the bottom current meters along the Otranto section, from MATER (periods A, B, C, D and E) and VECTOR data. Note that during period A, to avoid overlapping, the semi-major axes at St5 are plotted adding 60 m to the true depth.
On the other hand, the amplitudes of the semi-major axis at the bottom of location St2 varied between 15 cm s−1 and 20 cm s−1 until the end of July 1995. From the beginning of August on, they started diminishing. The correspond-ing semi-minor axis amplitudes were also large, between 10 cm s−1and 20 cm s−1, indicating a circular motion of the
diurnal tide at this location. From the available data we saw
Fig. 10. (a) Potential density anomaly from the CTD surveys conducted in close proximity of St2 during OTRANTO/OGEX projects. (b) Vertical distribution of the first three horizontal velocity modes at station St2 calculated from the August 1995 CTD profile.
Current-meter depths at St2 during the PR2 time period are indicated by horizontal dashed lines. (c) Vertical distribution of the potential temperature in the upper layer of the Otranto section on 27 August 1995.
further analyses were performed on the longest available time series for each current-meter. In particular, harmonic analysis performed at the bottom series at St2 from mid-May until mid-November 1995 (184 days long) permits a reso-lution between close frequencies of the diurnal tidal band (ALP1, 2Q1, Q1, O1, TAU1, BET1, NO1, P1, K1, PHI1, J1, SO1, OO1, UPS1). In this case, we still find an important in-tensification for K1 (9.98 cm s−1). The intensification, how-ever, is not as high as in the preceding May–August 1995 time interval (14.98 cm s−1). This fact we explain with the inclusion of the autumn period into analysis, when no in-tensification was found (4.71 cm s−1), and with the presence of the P1 constituent that was not resolved during PR2. As a conclusion, diurnal intensification cannot be attributed to the semi-annual beating provoked by the unresolved P1 tidal constituent with respect to the K1.
As far as seiches and their possible contribution to the intensification are concerned, we examined the conditions for their occurrence. As pointed out by several authors (Ceroveˇcki et al., 1997; Leder and Orli´c, 2004), influential seiche episodes occur mostly during the late autumn/winter period of the year due to the presence of low air pres-sure/sirocco wind events. Still, Cushman-Roisin et al. (2001), summarize that fundamental mode (peak at the 21–22 h pe-riod) might be active almost the whole year, but with am-plitudes higher in winter than in summer. The spectral anal-ysis of our velocity time series showed that there was no peak at the 21–22 h period at St2, and neither at St1. More-over, the intensification in our data varies with depth reach-ing the maximum near the bottom, where seiches should be weaker due to bottom friction. Near the St2 position, accord-ing to Leder and Orli´c (2004), seiches might reach up to
20 cm s−1, triggered by a suddenly changing scirocco (SE) wind as during winter 1989. ECMWF wind time series for the year 1995 near location St2 indicated that no significant sirocco wind episodes occurred during that summer. More-over, there was no evidence in the northern Adriatic (where the sea level seiche amplitude is maximum) of significant se-iche events that could provoke an “acqua alta” phenomenon in Venice. Namely, for the entirety of 1995 there was only one such episode, observed on 31 December 1995 (Comune di Venezia, 2013). Furthermore, we analysed the sea level in Trieste, northern Adriatic, for the year 1995, and no signif-icant seiche amplitudes were observed during the summer. Consequently, we claim that there were no significant seiche events during summer 1995, which could explain the bottom current intensification near the edge of the shelf break (St2). Beckenbach and Terrill (2008) studied a similar diur-nal phenomenon in the Southern California Bight, and they found that the structure of the diurnal internal tide resem-bled the vertical shape of the first normal baroclinic mode. The good vertical spatial resolution of their ADCP measure-ments enabled indication of such behaviour. In our case, the upper current meter at St2 was located at 56 m depth, there-fore below the pycnocline, which during summer 1995 was located between 20 and 40 m depth (Fig. 10a). As shown in Fig. 10b, this depth is below the zero-crossing of the first baroclinic mode. Hence, the values for the diurnal amplitudes at the deeper current meter are expected to be slightly greater than at the upper one, and the two levels should be in phase, which is exactly what we observed.
Fig. 11.uandvcurrent components in the upper (red line) and bot-tom (black line) layers at station St2 (a and b) during summer 1995 and at location St1 (d and e) during summer 1994. The temperature time series at station St2 is plotted in (c); the time of the CTD cast at St2 referred to in Fig. 10 is indicated by a vertical black line.
site was poleward of the critical latitude for diurnal frequency internal waves, as was ours, and nevertheless currents were dominated by the diurnal signal. They explained this inten-sification in terms of a baroclinic internal tide generated through the interaction of a barotropic tide with topogra-phy. In these circumstances, subinertial internal waves can exist beyond the critical latitude and explain a consistent part of the variance. In particular, they observed an intensi-fication of the across-shelf current component in accordance with the first baroclinic mode, with propagation of the signal from the shelf to the open sea. In their case, a possible ef-fect of the sea breeze was excluded. They suggested that the origin of the regularity of the amplified diurnal signal could be found either in (a) the extension of the low limit in fre-quency of the internal wave spectrum when also including the horizontal component of the Coriolis parameterf, or in
(b) the presence of internal coastal-trapped waves. The first of these causes was excluded due to high stratification, that is, the Brunt-Väisälä frequencyN(rotation frequency), while the second one was considered possible, whether of remote and/or local origin. The condition of strong stratifica-tion during summer 1995 (Fig. 10a), like in the case of Beck-enbach and Terrill (2008), makes us exclude the first possible cause of diurnal intensification for our observations.
Another possible origin for the extension of the low-frequency limit could be related to a strong negative rela-tive vorticity (Kunze, 1985); for example, a current shear of 50 cm s−1over a horizontal distance of 20 km at 40◦latitude can shift the limit to 25 h. For what concerns the negative relative vorticity, it could occur on the Otranto Shelf due to either anti-cyclonic eddies propagating down the Italian coast or simply to the anti-cyclonic inshore side of a sheared slope current. This is an interesting alternative explanation but not very likely applicable at the study region, where hori-zontal current shears in both directions are not of such inten-sities (usually less than 20 cm s−1between St2 and St3 over a distance of 14 km, which extends the internal wave limit to about 20 h). On the other hand, anti-cyclonic eddies found in the deepest part of this transect (St3–St6) were estimated to have a peak azimuthal velocity around 12–15 cm s−1and a diameter of 24 km (Ursella et al., 2011), whose relative vor-ticity is thus not able to shift enough the longest period for internal waves (period equal to 19.7–19.9 h). This consider-ation led us to exclude the possibility of the low-frequency limit extension of the internal spectrum.
Orli´c et al. (2011) and Mihanovi´c et al. (2009) found that summertime stratification occasionally generates inter-nal coastal waves that travel daily around an island in the southern Adriatic Sea, creating the conditions for resonant excitation of the diurnal frequency by sea breeze and/or diur-nal tides. In particular, Orli´c et al. (2011) forced the Princeton Ocean Model by real wind stress and found that an intensifi-cation of the diurnal signal, similar to that found in our data, is not possible without the topographic effect. In the Otranto area the topography is characterized by a gently increasing slope from the coast to the position of the station St2; sea-ward from that location the bottom slope abruptly increases, reaching its maximum value between St2 and St3 (Fig. 1).
To complete the picture of the intensification phenom-ena at the shelf break, temperature time series measured at current-meter locations during the OTRANTO/OGEX projects were considered. Their spectra have a weak diurnal peak that was evident almost only at station St2, predomi-nantly near the bottom, during period PR2, and was practi-cally absent in other periods and at the nearby stations (not shown).
Fig. 12. Wavelet spectrum as a function of time and scale (period) for wind stress (a), temperature (b) and residual bottom current components (c and d) at St2, and sea level at Otranto (e) during summer 1995. Diurnal scale (24 h) is indicated by a horizontal black line.
(European Centre for Medium-range Weather Forecast) wind data were used. ECMWF data have a spatial resolution of 0.25 degrees in both latitude and longitude, and a tempo-ral resolution of 6 h; data at the grid point nearest to the St2 location were extracted. As a test, the ECMWF wind data for year 2007 were compared with the 2007 on-shore station wind data (Otranto). Moreover, wavelet power spec-tra for both wind time series during 2007 were calculated and similar levels of energy were found at diurnal frequency. ECMWF winds thus proved useful in determining the im-portance of the diurnal signal when no other wind data are available, and for that reason, they were used for discussing the 1995 phenomena.
Interconnection among the wind, currents and sea temper-ature was examined by means of the Continuous Wavelet Transform. It performs a decomposition of the variability in timescales, thus enabling a comparison of their respective wavelet power spectra on a scale-by-scale basis (Torrence and Compo, 1998; Torrence and Webster, 1999). Perform-ing a wavelet analysis of the bottom current and tempera-ture data at St2, the wind stress and the sea level from the tide gauge located in Otranto (Rete Mareografica Nazionale, http://www.mareografico.it/) during summer 1995, interest-ing features emerged (Fig. 12). A strong diurnal signal with some modulation in time was observed in both cur-rent components, although it was more energetic for the u component (cross-shelf). In general there was a weaker
diurnal signal in the wind field (relatively more pronounced in the cross-shelf ucomponent, not shown), occurring just occasionally. Temperature had a prominent but transient di-urnal signal. In contrast, sea level had a strong signal at the semi-diurnal frequency (modulated at 15 days) rather than at the diurnal one; this is in accordance with the characteris-tics of the Adriatic tides (Hendershott and Speranza, 1971; Ursella and Gaˇci´c, 2001).
Multiple and partial coherences between wind stress, cur-rent and temperature on the diurnal scale were calculated as in Mihanovi´c et al. (2009). That is, the diurnal scale was ex-tracted from the Wavelet results. Multiple coherences were usually above the 95 % confidence level, often very close to 1, while partial coherences between current components and wind components showed few values above the confidence level (not shown). Finally, a wavelet spectrum of the cur-rents and wind was calculated for the off-shore station St3 and only a weak diurnal signal was found during period PR2, while the coherence resulted in no correlation at all with wind data (not shown). This indicates that there was no wind in-fluence on the diurnal scale of the current field.
than further away (St2). However, the diurnal tide (K1 semi-major axis) at the near-shore station St1 in summer 1994 had values around 2.6–2.8 cm s−1. These were much smaller than
at the bottom of St2 in summer 1995 (15 cm s−1) and similar to that found at the bottom of St3 in winter (4.2 cm s−1). We argue therefore, that there was no evidence of the intensifica-tion of the diurnal signal during summer 1994 near the coast.
5.2 Evidences of coastal trapped internal wave
Having excluded the effect of wind in the intensification of the diurnal tidal signal, the most probable cause remains the generation of internal waves that are coastally trapped by topography and resonate at the diurnal frequency (e.g., Huthance, 1978; Thomson and Crawford, 1982). The mech-anism for generating topographically trapped diurnal waves may arise from the interaction with the topography of the barotropic K1 wave that encounters the shelf edge. The re-duced bottom depth at the shelf edge triggers the internal wave (as in the case of a stratified system) with frequency of the forcing K1 wave. As the diurnal frequency is below the inertial frequency for this latitude, the wave (hybrid be-tween Kelvin and shelf wave), becomes trapped both in the vertical and in the horizontal, and “propagates” along the iso-baths with the coast at its right side (Wunsch, 1975; Baines, 1986; Mihanovi´c et al., 2006). The presence of these trapped internal diurnal waves can be proved by the investigation on the phase shift between the diurnal signal in the coastal sea level and the currents together with energy flux considera-tions. The harmonic analysis performed on the longest avail-able current time series located far from the bottom bound-ary layer, showed that K1 tidal barotropic phases are between 326◦and 350◦for the stations St1–St4.The sea level phases across the strait were extracted from the co-tidal charts of Janekovi´c et al. (2003): they range from 47◦ to 60◦ (54◦ at St2). The phase differences concerning the sea level and the currents are consequently between−273◦and−300◦. In particular, at station St2, the phase for the current is 326◦ and the phase difference with the sea level is−273◦. Points with difference in phase close to−270◦ are important be-cause they separate zones in the strait with opposite energy flux direction. Hence, we calculated the barotropic K1 tidal energy fluxes for the stations St1 to St4, as indicated in Book et al. (2009b), with the tidal ellipse values obtained from the above-mentioned harmonic analyses. The results are re-ported in Table 1. The sign of the Fv energy flux inverts be-tween St2 and St3, but the most prominent characteristic is that at station St2 the energy flux becomes oriented cross-basin, indicating a cross-slope barotropic K1 tidal energy propagation. St2 seems therefore to be a critical point in the slope, a site of local generation of trapped internal diurnal waves. Wavelet spectra in Fig. 12 evidence that these inter-nal waves were not always present, and they did not gen-erate amplification on the on-shore side of the shelf break (for example at station St1 during summer 1994). Moreover,
stratification during summer 1995 was stronger than during summer 1994 (Fig. 10a). This indicates that the topographic slope as well as the density stratification is the necessary el-ement for the resonance.
The diurnal spectra of u/v current component and tem-perature at St2, sea level and wind stress were extracted with wavelet analysis (Fig. 13). In very few events, the wind stress has a peak in correspondence of the ones for diurnal tem-perature. Moreover, both current components have a peak in agreement with the temperature peaks. Peaks in the diurnal ucomponent are more pronounced (Fig. 13), indicating that the forcing of such waves should be in the same direction, i.e east–west propagation direction of the barotropic K1 tidal component. The peaks in the upper and bottom temperature diurnal spectra are often not coincident in time. This can be related to the temperature gradients: the top current meter is in a zone of vertical temperature gradient, while the bot-tom one is in a zone of horizontal temperature gradients, as shown from the CTD data, for the month of August 1995 (Fig. 10c). Also peaks in the diurnal coastal sea level are not always present during these events. We observe that dur-ing the time interval, diurnal temperature peaks in the upper layer (Fig. 13a) are decreasing, while those in the bottom layer (Fig. 13b) are increasing in amplitude. This, with an intensification of diurnal signal at bottom, should evidence generation by the topography of the wave trapped near the bottom along the bathymetry. Coherences were therefore cal-culated in order to better understand the possible cause of the diurnal peaks in the bottom temperature (Fig. 14). Here we will focus on the events characterized by the most prominent peaks in the temperature, leaving the study of the remaining events to a more detailed study foreseen in the future on the observed phenomena and their relationship with the coastal trapped waves. As already pointed out, only few events with significant partial coherence with wind are observed when considering current, temperature and wind stress, while co-herence between current components and temperature is sig-nificant to a higher degree. This, together with coherence of current components with sea level (not shown) implies that the waves are locally generated in the area of the Strait of Otranto and southern Adriatic.
Table 1. Barotropic K1 tidal energy fluxes (Fu-East and Fv-North) and parameters used for their calculation: phase (ph) and amplitude (amp)
for the sea level, and phase/inclination (inc) and semi-major/semi-minor axis amplitudes of tidal ellipse for the currents.
Period Sea level Current
initial date duration ph amp ph/inc maj/min Fu Fv Station (dd/mm/yy) (days) (◦) (cm) (◦) (cm s−1) (W m−1) (W m−1) St1 mean 03/11/94 147 60 2 347/42 2.25/−0.78 118.7 −15.5 St2 56 m 17/05/95 116 54 2 333/44 10.3/−8.6 937.8 −664.4 St3 300 m 24/02/94 455 50 2 350/66 2.88/−0.23 501.6 816.2 St5 435 m 03/12/94 350 47 2 333/78 1.45/0.02 86.5 348.9
Fig. 13. Wavelet spectra of temperature, wind stress anducurrent component at station St2, and sea level at Otranto station, at the diurnal scale, for summer 1995. The spectra are normalized by the respective variance and significance levels. Black dashed line indicates 95 % level of confidence. (a) upper current-meter (56 m); (b) lower current-meter (105 m).
that varies in time during the length of the event): this gives a phase velocity of 0.8–0.9 m s−1. If we consider, as a first approximation an internal Kelvin wave in a stratified system such as ours with density difference in the water column of 4 kg m−3m−1, mean density of 1029 kg m−3, andH=30 m
(mixed layer), we obtain a velocity of 1.1 m s−1that is
com-patible with the phase speed. Moreover, the first baroclinic mode calculated from the Brunt-Väisälä frequency profile has a velocity of 0.8 m s−1. Finally, such time delays (11.5 h is almost half the diurnal period) can have the effect of super-posing constructively (positive interference) with the wave generated at location St2, which could amplify the diurnal signal. Similar results are found for the event at the end of August 1995 (on 24th) for which a time interval of 9.8 h gives a phase velocity of 0.9 m s−1.
At the end, we calculated the lagged cross-correlation be-tween the sea level and the current at each of the two depths for the diurnal scale extracted by the wavelet analysis at
station St2. Overall, 24 values for cross-correlation were cal-culated lagging sea level with respect to current by 1, 2, . . . , 24 h. The two correlation functions show maxima shifted by one hour (see Fig. 15c for the ucurrent component), with the one for the bottom preceding the upper-layer one. This indicates phase propagation from the bottom to the surface.
We looked in detail at the episode that occurred at the end of August 1995, when pronounced temperature and ve-locity diurnal oscillations were evident at St2 (Figs. 11, 12, 13). From Fig. 11 it emerges that the temperature oscil-lates between 12.9 and 13.5◦C. This range is compatible with the temperature differences observed in the bottom layer between St1 and St2 (Fig. 10c). The oscillating across-shelf (u) current, of about 15–20 cm s−1 in amplitude might be responsible for advecting back and forth over the bottom sen-sor the water of that temperature range.
Fig. 14. Multiple and partial wavelet coherences squared (blue line) and Normalized Wavelet Spectra (green line) at St2 during summer
1995, at the diurnal scale. Multiple coherence is calculated with theucurrent component, the wind stress and the temperature. The 95 % confidence levels are indicated by the horizontal dashed lines.
on the analysis by Pereira et al. (2002). Their paper describes a modelling study of tidal effects at the shelf break of the Weddel Sea in the zone of critical latitude (75–80◦S, inertial period of about 12.4 h). The vicinity of the critical latitude is crucial for the resonance of the semi-diurnal tidal con-stituents (in their case M2–S2) and the tidal current and mix-ing enhancement. We are not close to the critical latitude for K1, that is 30◦, and therefore the comparison between these two situations is not completely analogous, mainly because the mechanisms of the origin of the internal waves in our zone are different from those exposed in Pereira et al. (2002). They state that internal tides are expected to be generated at the shelf break because of the cross-slope barotropic veloci-ties are strongest in that region (up to 30 cm s−1, while we ob-serve up to 15 cm s−1). Besides the strength of the barotropic
currents, the generation of internal tides also depends on the stratification and the steepness of the slope. These general ideas match very well to the conditions that we actually ob-served at the shelf break of the section in the Strait of Otranto. They estimated that, in general, the tidally induced mixing is an important phenomenon on the shelf and on the continental shelf break, and discerned its seasonal variability. In win-ter, the turbulent mixing involves a larger part of the water column, in summer it influences the bottom boundary layer and the pycnocline. Moreover, they report that there exist additional mechanisms, which increase friction, and, there-fore mixing. Some of them are definitely present in our case,
such as diurnal continental shelf waves, internal tides, and waves trapped to the pycnocline. Although we are not able to quantify the vertical viscosity coefficients in our conditions, the effects on the mixing might be very similar. K1 tidal el-lipses during summer at St2 show increase of both across-shelf and along-across-shelf components, especially in the bottom layer. This fact, as stated by Pereira et al. (2002), results in the more vigorous displacement of the stratified fluid up and down the slope region.
6 Conclusions
Fig. 15. 24 h-centered bandpass filtered data foru(a) andv(b) current components at the upper meter (red line) and bottom
current-meter (black line); the 24 h-centered bandpass filtered sea level (in cm) is indicated in green. (c) lagged cross-correlation between the wavelet-extracted diurnal scales of the sea level and theucurrent component as a funtion of the lag interval; the upper layer is black and the bottom is grey.
appeared in the deepest layer and increased towards the bot-tom is explained in terms of the first baroclinic mode pattern. We excluded the possible sea-breeze impact on the intensifi-cation of the diurnal tidal signal and the most likely cause re-mains the generation of the topographically trapped internal waves resonant at diurnal period as a response to the tidal forcing and local interference. These waves (hybrid between Kelvin and shelf wave) are triggered by the reduced bottom depth at the shelf edge in condition of density stratification of the water column and have the frequency of the forcing K1 barotropic tidal signal. They become trapped both in the vertical and in the horizontal and propagate along the iso-baths with the coast at their right side. These waves are only sometimes generated because they require the presence of density stratification in the vicinity of the topographic slope change. This phenomenon can stimulate both diapycnal mix-ing durmix-ing the stratified season and sediment resuspension, and can enhance ventilation of the near-bottom layers.
Table A1. Abbreviations.
ADCP Acoustic Doppler Current Profiler BB Broad Band
CT Conductivity-Temperature CTD Conductivity-Temperature-Depth
ECMWF European Centre for Medium-range Weather Forecast MATER MAss Transfer and Ecosystem Response
MTP Mediterranean Targeted Project NWS Normalized Wavelet Spectra OGEX Otranto Gap EXperiment RDI RD Instruments
Acknowledgements. We thank the anonymous reviewers very much
for the careful reading of our manuscript, helping us to consider and improve various important aspects of this research. We ex-press our thanks to M. Orli´c for fruitful discussions on some top-ics. We greatly acknowledge the technical and scientific staffs of the OGS and of the former establishment SACLANTCEN of the Centre for Maritime Research and Experimentation (CMRE), Italy, as well as of the Hellenic Centre for Marine Research, Greece, who participated in the CTD, multi-beam and current meter data acquisition and pre-processing in the framework of the projects OTRANTO/OGEX, MATER and VECTOR. We are also grateful to the crew of the research vessels Urania, Aegeo, Alliance, ITS Magnaghi, OGS-Explora and Universitatis who helped in all the operations at sea. We are grateful to V. Cardin for extracting the ECMWF data. We thank I. M. Mosquera for offering his help re-garding wavelet analysis and interpretation of results. We also ac-knowledge F. Raicich for providing 1995 sea level data at Trieste.
The central part of the bathymetry line used in Fig. 1c (∼18.6– 19.25◦E) is a product of the multi-beam survey with high spa-tial resolution conducted on board r/v OGS-Explora in April 2007 (VECTOR).
The work was partially supported by the Italian national project
Ricerca italiana del mare (Ritmare) financed by the Ministry of
Research and Education and by the EU project Policy-oriented marine Environmental Research for the Southern European Seas (PERSEUS).
Edited by: N. Pinardi
References
Baines, P. G.: Internal tides, internal waves and near-inertial mo-tions, in: Baroclinic Processes on Continental Shelves, edited by: Mooers, C. N. K., AGU, Washington, D.C., 19–31, 1986. Beckenbach, E. and Terrill, E.: Internal tides over abrupt topography
in the Southern California Bight: observations of diurnal waves poleward of the critical latitude, J. Geophys. Res., 113, C02001, doi:10.1029/2006JC003905, 2008.
Book, J. W., Martin, P. J., Janekovi´c, I., Kuzmi´c, M., and Wim-bush, M.: Vertical structure of bottom Ekman tidal flows: Obser-vations, theory, and modeling from the northern Adriatic, J. Geo-phys. Res., 114, C01S06, doi:10.1029/2008JC004736, 2009a. Book, J. W., Perkins, H., and Wimbush, M.: North Adriatic tides:
observations, variational data assimilation modeling, and linear tide dynamics, Geofizika, 26, 115–143, 2009b.
Budillon, G., Grilli, F., Ortona, A., Russo, A., and Tramontin, M.: An assessment of surface dynamics observed offshore An-cona with HF radar, Marine Ecology PSZNI, 23, Supplement I, 21–37, 2002.
Buljan, M. and Zore-Armanda, M.: Oceanographical properties of the Adriatic Sea, Oceanogr. Mar. Biol., 14, 11–98, 1976. Ceroveˇcki, I., Orli´c, M., and Hendershott, M. C.: Adriatic seiche
decay and energy loss to the Mediterranean, Deep Sea Res.-Pt. I, 44, 2007–2029, 1997.
Chavanne, C., Janekovi´c, I., Flament, P., Poulain, P.-M., Kuzmi´c, M., and Gurgel, K.-W.: Tidal currents in the northwest-ern Adriatic: High Frequency radio observations and nu-merical model predictions, J. Geophys. Res., 112, C03S21, doi:10.1029/2006JC003523, 2007.
Comune di Venezia: Previsioni delle altezze di marea per il ba-cino San Marco e delle velocità di corrente per il Canal Porto di Lido – Laguna di Venezia, Valori astronomici 2013, available at: http://93.62.201.235/maree/DOCUMENTI/Previsioni_delle_ altezze_di_marea_astronomica_2013.pdf, p. 12, 2013.
Cushman-Roisin, B. and Naimie, C. E.: A 3D finite-element model of the Adriatic tides, J. Mar. Syst., 37, 279–297, 2002.
Cushman-Roisin, B., Malaˇciˇc, V., and Gaˇci´c, M.: Tide, Seiches and Low-frequency oscillations, in: Physical Oceanography of the Adriatic Sea: Past, Present and Future, edited by: Cushman-Roisin, B., Gaˇci´c, M., Poulain, P.-M., and Artegiani, A., Kluwer Academic Publishers, Dordrecht/Boston/London, 217– 240, 2001.
Ferentinos, G. and Kastanos, N.: Water circulation patterns in the Otranto Strait, eastern Mediterranean, Cont. Shelf Res., 8, 1025– 1041, 1988.
Foreman, M. G. G.: Manual for Tidal Currents Analysis and Predic-tion, Pacific Marine Science Report 78-6, Institute of Ocean Sci-ences, Patricia Bay, Sidney, B.C., 57 pp. (2004 revision), 1978. Gaˇci´c, M., Kovaˇcevi´c, V., Manca, B., Papageorgiou, E., Poulain,
P.-M., Scarazzato, P., and Vetrano, A.: Thermohaline properties and circulation in the Strait of Otranto, in: Dynamics of Mediter-ranean Straits and Channels, Bull. Inst. Oceanogr., no. spécial 17, CIESM Science Series no. 2, edited by: Briand, F., Monaco, 117–145, 1996.
Guarnieri, A., Pinardi, N., Oddo, P., Bortoluzzi, G., and Ra-vaioli, M.: Impact of tides in a baroclinic circulation model of the Adriatic Sea, J. Geophys. Res. Oceans, 118, 166–183, doi:10.1029/2012JC007921, 2013.
Hendershott, M. C. and Speranza, A.: Co-oscillating tides in long, narrow bays; the Taylor problem revisited, Deep-Sea Res., 18, 959–980, 1971.
Huthance, J. M.: On coastal trapped waves: analysis and numerical calculation by inverse iteration, J. Phys. Ocean., 8, 74–92, 1978. Janekovi´c, I. and Kuzmi´c, M.: Numerical simulation of the Adriatic Sea principal tidal constituents, Ann. Geophys., 23, 3207–3218, doi:10.5194/angeo-23-3207-2005, 2005.
Janekovi´c, I., Bobanovi´c, J., and Kuzmi´c, M.: The Adriatic Sea M2 and K1 tides by 3D model and data assimilation, Estuar. Coast. Shelf S., 57, 873–885, 2003.
Klai´c, Z. B., Pasari´c, Z., and Tudor, M.: On the interplay between sea-land breezes and Etesian winds over the Adriatic, J. Mar. Sys., 78, S101–S118, 2009.
Kovaˇcevi´c, V., Gaˇci´c, M., and Poulain, P.-M.: Eulerian current mea-surements in the Strait of Otranto and in the Southern Adriatic, J. Mar. Sys., 20, 255–278, 1999.
Kovaˇcevi´c, V., Gaˇci´c, M., Mancero Mosquera, I., Mazzoldi, A., and Marinetti, S.: HF Radar Observations in the Northern Adriatic: Surface Current Field in Front of the Venetian Lagoon, J. Mar. Sys., 51, 95–122, 2004.
Kunze, E.: Near-inertial wave propagation in geostrophic shear, J. Phys. Oceanogr., 15, 544–565, 1985.
Leder, N. and Orli´c, M.: Fundamental Adriatic seiche recorded by current meters, Ann. Geophys., 22, 1449–1464, doi:10.5194/angeo-22-1449-2004, 2004.
Lozano, C. and Candela, J.: The M2 tide in the Mediterranean Sea: dynamic analysis and data assimilation, Oceanol. Acta, 18, 419– 441, 1995.
Malaˇciˇc, V., Viezzoli, D., and Cushman-Roisin, B.: Tidal dynam-ics in the northern Adriatic Sea, J. Geophys. Res., 105, 26265– 26280, doi:10.1029/2000JC900123, 2000.
Manca, B. B., Kovaˇcevi´c, V., Gaˇci´c, M., and Viezzoli, D.: Dense water formation in the Southern Adriatic Sea and spreading into the Ionian Sea in the period 1997–1999, J. Mar. Sys., 33–34, 133–154, 2002.
Martin, P. J., Book, J. W., Burrage, D. M., Rowley, C. D., and Tudor, M.: Comparison of model-simulated and observed currents in the Central Adriatic during DART, J. Geophys. Res., 114, C01S05, doi:10.1029/2008JC004842, 2009.
Michelato, A. and Kovaˇcevi´c, V.: Some dynamic features of the flow through the Otranto Strait, Boll. Oceanol. Teor. Appl., IX, 39–51, 1991.
Mihanovi´c, H., Orli´c, M., and Pasari´c, Z.: Diurnal internal tides detected in the Adriatic, Ann. Geophys., 24, 2773–2780, doi:10.5194/angeo-24-2773-2006, 2006.
Mihanovi´c, H., Orli´c, M., and Pasari´c, Z.: Diurnal ther-mocline oscillations driven by tidal flow around an is-land in the Middle Adriatic, J. Mar. Sys., 78, S157–S168, doi:10.1016/j.jmarsys.2009.01.021, 2009.
Mosetti, F. and Manca, B.: Le maree dell’Adriatico: Calcoli di nuove costanti armoniche per alcuni porti, Studi in onore di Giuseppina Aliverti, Istituto Universitario Navale di Napoli, Ist. di Meteorologia e Oceanografia, 163–177, 1972.
Orli´c, M.: Anatomy of sea level variability – an example from the Adriatic, in: The Ocean Engineering Handbook, edited by: El-Hawary, F., CRC Press, Boca Raton (USA), 2001.
Orli´c, M., Beg Paklar, G., Dadi´c, V., Leder, N., Mihanovi´c, H., Pasari´c, M., and Pasari´c, Z.: Diurnal upwelling resonantly driven by sea breezes around an Adriatic island, J. Geophys. Res., 116, C09025, doi:10.1029/2011JC006955, 2011.
Pawlowicz, R., Beardsley, B., and Lentz, S.: Classical tidal har-monic analysis including error estimates in MATLAB using T_TIDE, Comput. Geosci., 28, 929–937, 2002.
Pereira, A. F., Beckmann, A., and Hellmer, H. H.: Tidal Mixing in the Southern Weddell Sea: Results from a Three-Dimensional Model, J. Phys. Oceanogr., 32, 2151–2170, 2002.
Polli, S.: La propagazione delle maree nell’Adriatico, Istituto Talas-sografico Sperimentale, Pubblicazione no. 370, Trieste, 11 pp., 1961.
Poulain, P.-M.: Tidal currents in the Adriatic as measured by surface drifters, J. Geophys. Res.-Oceans, 118, 1434–1444, doi:10.1002/jgrc.20147, 2013.
Taylor, L.: Tidal oscillations in gulfs and rectangular basins, Proc. London Math. Soc., 20, 93–204, 1921.
Thompson, R. E. and Crawford, W. R.: The generation of diurnal period shelf waves by tidal currents, J. Phys. Ocean., 12, 635– 643, 1982.
Torrence, C. and Compo, G. P.: A practical Guide to Wavelet anal-ysis, B. Am. Meteorol. Soc., 79, 61–78, 1998.
Torrence, C. and Webster, P. J.: Interdecadal changes in the ENSO-monsoon System, J. Climate, 12, 2679–2690, 1999.
Ursella, L. and Gaˇci´c, M.: Use of the Acoustic Doppler Current Profiler (ADCP) in the study of the circulation of the Adri-atic Sea, Ann. Geophys., 19, 1183–1193, doi:10.5194/angeo-19-1183-2001, 2001.
Ursella, L., Kovaˇcevi´c, V., and Gaˇci´c, M.: Footprints of mesoscale eddy passages in the Strait of Otranto (Adriatic Sea), J. Geophys. Res., 116, C04005, doi:10.1029/2010JC006633, 2011.
Ursella, L., Gaˇci´c, M., Kovaˇcevi´c, V., and Deponte, D.: Low-frequency flow in the bottom layer of the Strait of Otranto, Cont. Shelf Res., 44, 5–19, doi:10.1016/j.csr.2011.04.014, 2012. Vetrano, A., Gaˇci´c, M., and Kovaˇcevi´c, V.: Water fluxes through the
Strait of Otranto, in: EC Ecosystems research report No. 32, The Adriatic Sea, Proceedings of the workshop “Physical and biogeo-chemical processes in the Adriatic Sea”, Portonovo (Ancona), Italy, 23 to 27 April 1996, edited by: Hopkins, T. S., Artegiani, A., Cauwet, G., Degobbis, D., and Malej, A., 127–137, 1999. Vilibi´c, I., Šepi´c, J., Dadi´c, V., and Mihanovi´c, H.: Fortnightly
oscil-lations observed in the Adriatic Sea, Ocean Dynam., 60, 57–63, doi:10.1007/s10236-009-0241-2, 2010.
Wunsch, C.: Internal tides in the ocaen, Rev. Geophys. Space Phys., 13, 167–182, 1975.