© Author(s) 2017. This work is distributed under the Creative Commons Attribution 3.0 License.
Flow intake control using dry-weather forecast
Otto Icke1, Kim van Schagen1, Christian Huising2, Jasper Wuister1, Edward van Dijk1, and Arjan Budding2
1Business Unit Water, Royal HaskoningDHV, Amersfoort, 3800 BC, the Netherlands
2Policy Department, Water authority Vallei en Veluwe, Apeldoorn, 7320 AC, the Netherlands
Correspondence to:Otto Icke ([email protected])
Received: 23 January 2017 – Discussion started: 3 February 2017 Revised: 26 June 2017 – Accepted: 3 July 2017 – Published: 15 August 2017
Abstract. Level-based control of the influent flow causes peak discharges at a waste water treatment plant
(WWTP) after rainfall events. Furthermore, the capacity of the post-treatment is in general smaller than the maximum hydraulic capacity of the WWTP. This results in a significant bypass of the post-treatment during peak discharge. The optimisation of influent flow reduces peak discharge, and increases the treatment efficiency of the whole water cycle, which benefits the surface water quality. In this paper, it is shown that half of the bypasses of the post-treatment can be prevented by predictive control. A predictive controller for influent flow
is implemented using the Aquasuite®Advanced Monitoring and Control platform. Based on real-time measured
water levels in the sewerage and both rainfall and dry-weather flow (DWF) predictions, a discharge limitation is determined by a volume optimisation technique. For the analysed period (February–September 2016) results at WWTP Bennekom show that about 50 % of bypass volume can be prevented. Analysis of single rainfall events shows that the used approach is still conservative and that the bypass can be even further decreased by allowing discharge limitation during precipitation.
1 Introduction
The influent flow to most waste water treatment plants (WWTPs) is currently controlled by only the level in the sewerage. This level-based control of the influent flow causes peak discharges at a WWTP after rainfall events, even if there is enough storage available in the sewerage to discharge the precipitation in a more gradual way. As a result both hy-draulic and biological peak loads are considerable. This af-fects the performance of the WWTP. Furthermore, the capac-ity of the post-treatment is in general smaller than the maxi-mum hydraulic capacity of the WWTP. This results in a sig-nificant bypass of the post-treatment during peak discharge.
Therefore, reduction of peak discharge by optimising the influent flow control is expected to be effective. Predictive control with dry-weather forecast can be applied to limit the influent flow at the end of (or even during) rainfall events. Where level-based control is characterised by a re-active response, predictive control anticipates changing cir-cumstances. In this way the available storage of the sewerage
can be used without causing extra combined sewer overflow (CSO) or water on street (WOS). This increases the treat-ment efficiency of the whole water cycle, which benefits the surface water quality.
For WWTP Woudenberg preliminary study was carried out on using predictive control. It was shown that the amount of bypass can be reduced by approximately 65 % (van Dijk, 2013). The study used a conservative approach, in which the discharge is limitedafterthe rainfall event. It was suggested that the amount of bypass could be even more reduced in
case the discharge is limitedduringthe rainfall event.
00:00 03:00 06:00 09:00 12:00 15:00 18:00 21:00 00:00 Time (h)
0 200 400 600 800 1000
F
lo
w
(
m
3 h
-1) Discharge limitation
DWF prediction Storage prediction Precipitation prediction Critical level
0 5 10 15 20 25
P
re
ci
pi
ta
tio
n
(m
m
h
-1)
&
s
to
ra
ge
(
m
m
)
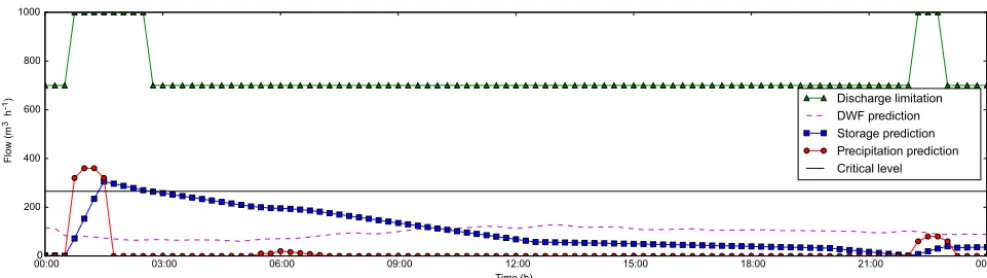
Figure 1.Outline of the predictive control for the influent flow of WWTP Bennekom (Icke et al., 2016).
2 Material and methods
A predictive controller for influent flow is implemented in
this pilot project using the Aquasuite®Advanced Monitoring
and Control platform (van der Kolk, 2016). The controller is used to limit the flow at pumping stations discharging from the sewerage to the WWTP. Rainfall and dry-weather flow (DWF) predictions are applied as the basis for the predictive control.
The rainfall prediction is obtained from the High Reso-lution Limited Area Model (HIRLAM) of the Royal Nether-lands Meteorological Institute (KNMI). The DWF prediction is obtained by a measurement data driven technique (Bakker et al., 2013a). Based on real-time measured water levels in the sewerage and both rainfall and DWF predictions, a dis-charge limitation is determined by a volume optimisation technique (Bakker et al., 2013b). This is shown in Fig. 1.
During a rainfall event, the discharge limitation is at maxi-mum capacity. After the rainfall event, when levels are below a defined critical level, the sewerage is emptied with a limited discharge. In Fig. 1 an example with a discharge limitation at 70 % of the maximum capacity is shown. Based on the time until the next rainfall event and the maximum time to empty the sewerage, the influent flow is optimised between the max-imum capacity and the capacity of the post-treatment.
2.1 Rainfall forecast
As travelling times of the sewerage can take up to 24 h (RI-ONED, 2008), precipitation predictions with similar periods are required. Optimal utilisation of the storage of the sewer-age is only possible with information of subsequent rainfall peaks. Therefore, at the beginning of this project, HIRLAM of the KNMI was selected as the numerical weather pre-diction (NWP) forecast system from which the precipitation data were obtained. This rainfall forecast has raster cell sizes of 11.0 by 7.0 km, a forecast horizon of 48 h and a refresh rate of circa 6 h. A single time series is obtained for each speci-fied area by transforming the information of the raster cells within the polygon by application of a geostatistical method.
2.2 Dry-weather flow prediction
An accurate prediction of the dry-weather flow is essential to determine the total predicted flow to the WWTP. The influent flow has, at WWTPs with mainly domestic waste water, a typical day pattern. Both (time-dependent) water demand of inhabitants and contribution of industrial discharges, as well as properties of the sewerage like travelling time, influence the exact characteristics of this pattern.
A data driven technique is applied to obtain this DWF pre-diction which is self-learning based on real-time flow mea-surements. Based on previously occurring patterns of each specific day of the week, a daily curve is automatically ob-tained, except for those with deviations due to peak flows caused by precipitation. Combination of the prediction of the total daily volume with this predicted curve determines a DWF prediction. For each specific catchment area, a dis-tinct DWF prediction is obtained. The DWF prediction has a 48 h forecast horizon, just like the rainfall forecast.
This particular technique is based on the fully adaptive forecasting model for short-term drinking water demand (Bakker et al., 2013a). It is so generic that it can be applied to waste water discharge with some small adjustments of the settings. Before this pilot project, the application of this tech-nique to waste water discharge had already successfully been implemented, yet with a rather different objective. DWF pre-diction is an accurate measure for the load of biological oxy-gen demand (BOD) prediction. Therefore, it can be applied within a predictive controller for aeration (de Koning et al., 2013).
2.3 Predictive control
pi-lot project, this technique is applied to reduce peak flow to the WWTP after rainfall using the available storage of the sewer. The outflow of the reservoir is kept limited within the constraints.
The predictive controller for influent flow control as imple-mented for this pilot project consists of the following com-ponents. Firstly, actual utilised storage of the sewerage is de-rived from real-time water level measurements and relation-ships between level and volume. These relationrelation-ships are ob-tained from storage curves derived from sewer models and are verified with measured values for level and discharge. Subsequently, the inflow to the sewerage is predicted. The sum of runoff, DWF and discharge predictions of connected upstream catchments determines the inflow prediction. The runoff is based on the connected paved area and the precipi-tation prediction. In the third step, the sewerage is modelled as a single reservoir for each catchment, which is optimally used within the imposed constraints. This results in the opti-mal outflow prediction.
Only if the actual level in the sewerage is lower than a crit-ical level and the predicted precipitation is below a threshold, is discharge limitation turned on. The discharge is limited to an optimal capacity meeting the imposed constraints. In case a subsequent significant rainfall event is forecasted at a mo-ment before the sewerage can be completely emptied at post-treatment capacity, discharge will be optimised. Depending on the local configuration, the discharge can either be grad-ually limited between maximum and post-treatment capacity or kept at maximum capacity for a calculated period after the rainfall event. In this way, the sewerage is emptied before the next rainfall event, and bypass of the post-treatment is min-imised.
2.4 Implementation
For the pilot project this control is implemented for the WWTPs Bennekom, Ede, Woudenberg and Harderwijk (Netherlands). These are conventional WWTPs with a treatment. The allocated hydraulic capacity of the post-treatment is for all these locations lower than the hydraulic capacity of the WWTP. The implementation is executed in close cooperation between water authority Vallei and Veluwe and the connected municipalities. The predictive controller is implemented for all four locations. This study analyses the implementation of WWTP Bennekom in detail.
Before implementation, influent flow at WWTP Ben-nekom took place at three different stages: 200, 500 and 1000 m3h−1. Only switching between fixed stages is possi-ble, since none of the screw pumps are provided with variable speed drives. However, above 700 m3h−1silting of the sand filters occurs. Therefore, an extra fixed stage of 700 m3h−1 was configured for this project. In case of suitable conditions discharge is limited from 1000 to 700 m3h−1by the predic-tive control.
2.5 Phasing and monitoring
The predictive control was first implemented in advisory mode to check the results in the real-time, full-scale situation. After this period the control is switched on if the results from the advisory period were satisfactory. The control is continu-ously monitored by the application of key performance indi-cators (KPIs) for both sewerage and post-treatment. Storage utilisation and travelling time were defined as the main KPIs for the sewerage. The efficiency of the predictive control it-self was defined as a major KPI for the post-treatment. The efficiency of the predictive control is determined as the ratio of the bypass of the post-treatment prevented and the amount of bypass for the situation without predictive control (Icke et al., 2016).
3 Results and discussion
In advisory mode the results prove that most of the rainfall events could have been discharged to the WWTP with a re-duced capacity and therefore the amount of bypass can be reduced without extra CSO. At the beginning of February 2016 the predictive control for WWTP Bennekom was ac-tivated. The predictive control has been continuously acti-vated, apart from the period between 10 and 12 February and 13 and 14 March due to maintenance activities. During the analysed period (February–September) several precipitation events which could cause bypass occurred.
3.1 Performance control total period
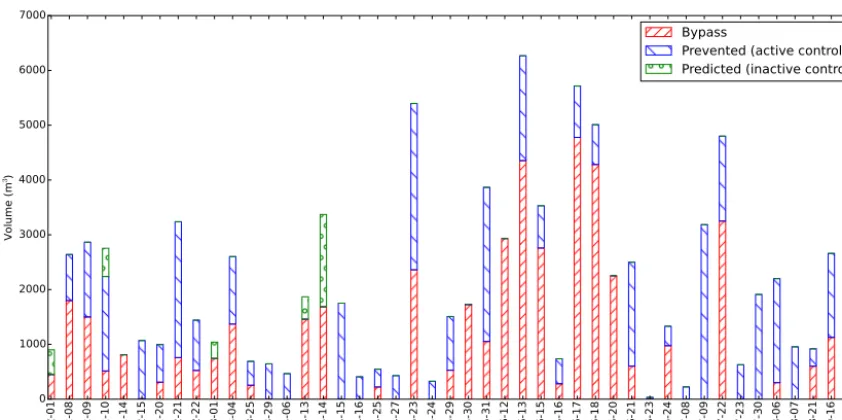
The performance of the predictive control at WWTP Ben-nekom for the analysed period is shown in Fig. 2. Both the amount of bypass that occurred and the amount that was pre-vented are presented for each day. For those days where the predictive control was (partially) deactivated due to mainte-nance activities, the prevented bypass was predicted.
For the analysed period (February–September 2016) the results at WWTP Bennekom show that 51 % of bypass vol-ume has been prevented with predictive control compared to the original situation with level-based control. The results also show that big differences occur between the months re-garding the effect of the predictive control. The analysed pe-riod covers two-thirds of the year, including the whole sum-mer period.
02 -01 02 -08 02 -09 02 -10 02 -14 02 -15 02 -20 02 -21 02 -22 03 -01 03 -04 03 -25 03 -29 04 -06 04 -13 04 -14 04 -15 04 -16 04 -25 04 -27 05 -23 05 -24 05 -29 05 -30 05 -31 06 -12 06 -13 06 -15 06 -16 06 -17 06 -18 06 -20 06 -21 06 -23 06 -24 07 -08 07 -09 07 -22 07 -23 07 -30 08 -06 08 -07 08 -21 09 -16 0 1000 2000 3000 4000 5000 6000 7000 Vo lum e ( m 3) Bypass
Prevented (active control) Predicted (inactive control)
Figure 2.Performance of the predictive control at WWTP Bennekom for the period February–September 2016.
Time (h) 0 200 400 600 800 1000 Discharge limitation DWF prediction Storage prediction Precipitation prediction Critical level Discharge actual Storage actual Precipitation actual 0 5 10 15 20 25
00:00 03:00 06:00 09:00 12:00 15:00 18:00 21:00 00:00
F lo w (m 3 h -1) P re ci pi ta tio n (m m h -1) & s to ra ge ( m m )
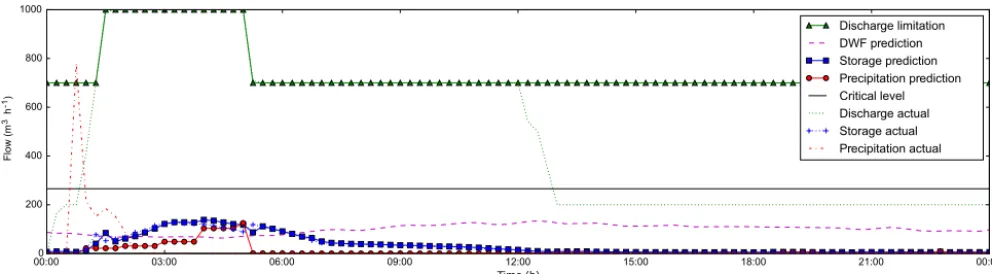
Figure 3.Example of bypass reduction with a conservative approach at WWTP Bennekom for the event of 4 March (Icke et al., 2016).
During the next 2 months (May and June) 33 % of the bypass was prevented by predictive control. Especially June was a month with severe thunderstorms. The precipitation during this (early) summer period can be characterised as difficult to predict and with large amounts within short time periods. The effects of subsequent rainfall events were large. Discharge limitation of the predictive control can only oc-cur below critical levels and without significant rainfall in the near future. Finally, during the last 3 months (July– September) 70 % of the bypass was prevented by predictive control.
3.2 Performance: single rainfall events
In this pilot project, a conservative approach is used in which the predictive control is limited after the rainfall event. In Fig. 3 bypass reductionaftera rainfall event of 4 March is il-lustrated. The efficiency of the predictive control for this sin-gle event accounts for 47 %. This is entirely due to the chosen
approach of applying discharge limitationafterthe rainfall
event, not a subsequent rainfall event. If the progressive
ap-proach had been applied, allowing discharge limitation
dur-ing the rainfall, bypass could be completely prevented for
this specific event. This holds for the majority of the events in the spring period February–April (Icke et al., 2016).
The progressive approach could also be of interest for
the summer period. In Fig. 4 bypass reductionaftera
Time (h) 0
200 400 600 800 1000
Discharge limitation DWF prediction Storage prediction Precipitation prediction Critical level Discharge actual Storage actual Precipitation actual
0 5 10 15 20 25
00:00 03:00 06:00 09:00 12:00 15:00 18:00 21:00 00:00
F
lo
w
(m
3h -1)
P
re
ci
pi
ta
tio
n
(m
m
h
-1)
&
s
to
ra
ge
(
m
m
)
Figure 4.Example of bypass reduction with a conservative approach at WWTP Bennekom for the event of 16 September.
3.3 Precipitation prediction
The results show that most rainfall events are adequately pre-dicted with respect to appearance and timing, and it is shown that this prediction can be used for control. However, further research can show whether the shape and volume of rainfall forecast might be improved by application of more advanced techniques, or a combination of techniques. Especially for the summer period, Hirlam Aladin Regional on Mesoscale Operational NWP in Euromed (HARMONIE) precipitation prediction performs better than HIRLAM (Hooijman, 2014). In addition, HARMONIE has raster cell sizes of 2.5 by 2.5 km (KNMI, 2010), which results in a more distinctive selection of cells for each catchment. Nowcasting extrapo-lates the initial condition, determined by detailed observed data, to a forecast with a horizon between 0 and 6 h. It of-fers more accurate information for the very short term, but it loses its value for the long term (Golding, 1998). Although the forecast horizon of nowcasting is too short in comparison to travelling times in the sewerage, it might be meaningful to combine it with HARMONIE to use the best of both worlds. NWP unpredicted events could be covered with nowcasting. Also, the usage of the spread of ensemble forecasts account-ing for uncertainty is considered. Discharge limitation could be disabled in case of unpredictable weather.
4 Conclusions
Flow intake based on predictive control using DWF and rainfall predictions offers reduced peak discharges on the WWTPs. This results in a better performance of the WWTP and particularly the utilisation of the post-treatment phase, which improves the surface water quality. For the analysed period (February–September 2016) results at WWTP Ben-nekom show that about 50 % of bypass volume of the post-treatment phase can be prevented with operational predic-tive control. Analysis of single rainfall events showed that the approach, in which the discharge is limited after the rain-fall event, is still conservative. The prevented amount can be
even further increased by allowing limited discharge during significant rainfall.
Data availability. The research data of this pilot project can be accessed and all data sets are available as time series in text files (comma separated values) in the Supplement. Further explanation can be obtained by contacting the corresponding author.
The Supplement related to this article is available online at https://doi.org/10.5194/dwes-10-69-2017-supplement.
Competing interests. The authors declare that they have no con-flict of interest.
Special issue statement. This article is part of the special issue “Computing and Control for the Water Industry, CCWI 2016”. It is a result of the 14th International CCWI Conference, Amsterdam, the Netherlands, 7–9 November 2016.
Acknowledgements. This pilot project was carried out in coop-eration with Dutch water authority Vallei and Veluwe (WSVV) and engineering corporation Royal HaskoningDHV (RHDHV). The authors would like to thank Ferry van de Peppel and Ronnie van Brummelen (WSVV) for their extensive contribution with local process automation and embedding in the daily process operation. Thanks go also to Klaas-Jan van Heeringen (Deltares) for his detailed review.
Edited by: Edo Abraham
References
Bakker, M., Vreeburg, J. H. G., van Schagen, K. M., and Rietveld, L. C.: A fully adaptive forecasting model for short-term drinking water demand, Environ. Modell. Softw., 48, 141–151, 2013a. Bakker, M., Vreeburg, J. H. G., Palmen, L. J., Sperber, V., Bakker,
G., and Rietveld, L. C.: Better water quality and higher energy efficiency by using model predictive flow control at water supply systems, J. Water Supply Res. T., 62, 1–13, 2013b.
de Koning, M., van Schagen, K. M., Agarwalla, B., Trolio R., and Domuard, M. (Eds.): Predictive control in wastewater treatment, OZ Water ’13 Conference, Perth, Australia, 2013.
Golding, B. W.: Nimrod: A system for generating automated very short range forecasts, Meteorol. Appl., 5, 1–16, 1998.
Hooijman, N.: Vergelijkende verificatie van neerslagverwachtingen van de modellen HARMONIE, HIRLAM en ECMWF (Com-parative verification of precipitation forecasts from the models HARMONIE, HIRLAM and ECMWF), Tech. rep., KNMI Inter-nal Report, IR-2014-09, 2014.
Icke, O., Huising, C., van Dijk, E. J. H., and Henckens, G. (Eds.): Pump regime optimisation by dry-weather forecasts, Proceeding of the 8th International Conference on Sewer Processes and Net-works, 2016.
KNMI: Voortzetting weermodel HIRLAM (Continuation weather model HIRLAM), https://knmi.nl/over-het-knmi/nieuws/ voortzetting-weermodel-hirlam, (last access: 5 May 2016), 2010.
RIONED: Functioneel ontwerp: inzameling en transport van af-valwater en (verontreinigd) hemelwater (Functional Design: col-lection and transport of wastewater and (contaminated) rainwa-ter). Leidraad Riolering (Guideline Drainage). Module B2100, http://www.riool.net/ (last access: 5 May 2016), 2008.
van der Kolk, J. H.: Aquasuite® for intelligent water solutions. Smart Water: Intelligent solutions for the entire water chain, http://aquasuite.net/, last access: 5 May 2016.