Drink. Water Eng. Sci., 6, 25–31, 2013 www.drink-water-eng-sci.net/6/25/2013/ doi:10.5194/dwes-6-25-2013
©Author(s) 2013. CC Attribution 3.0 License.
History
of
Geo- and Space
Sciences
Open
Access
Advances
in
Science & Research
Open Access Proceedings
Drinking Water
Engineering and ScienceOpen Access
Open
Access
Earth System
Science
Data
Drinking Water
Engineering and ScienceDiscussions
O
pen
Acc
es
s
Open
Access
Earth System
Science
Data
D
iscussions
Application of DVC-FISH method in tracking
Escherichia
coli
in drinking water distribution networks
L. Mezule, S. Larsson, and T. Juhna
Department of Water Engineering and Technology, Riga Technical University, Azenes 16/20-263, Riga, Latvia
Correspondence to: L. Mezule ([email protected])
Received: 1 September 2012 – Published in Drink. Water Eng. Sci. Discuss.: 26 September 2012 Revised: 24 December 2012 – Accepted: 13 March 2013 – Published: 2 April 2013
Abstract. Sporadic detection of live (viable) Escherichia coli in drinking water and biofilm with molecular
methods but not with standard plate counts has raised concerns about the reliability of this indicator in the surveillance of drinking water safety. The aim of this study was to determine spatial distribution of different viability forms of E. coli in a drinking water distribution system which complies with European Drinking Water Directive (98/83/EC). For two years coupons (two week old) and pre-concentrated (100 times with ul-trafilters) water samples were collected after treatment plants and from four sites in the distribution network at several distances. The samples were analyzed for total, viable (able to divide as DVC-FISH positive) and cul-tivable E. coli. The results showed that low numbers of E. coli enters the distribution sytem from the treatment plants and tend to accumulate in the biofilm of water distribution system. Almost all of the samples contained metabolically active E. coli in the range of 1 to 50 cells per litre or cm2which represented approximately 53 % of all E. coli detected. The amount of viable E. coli significantly increased into the network irrespective of the season.
The study has shown that DVC-FISH method in combination with water pre-concentration and biofilm sam-pling allows to better understand the behaviour of E. coli in water distribution networks, thus, it provides new evidences for water safety control.
1 Introduction
Over the last century, monitoring of Escherichia coli by us-ing standard plate count methods in water samples taken from several locations of water supply system (grab sam-pling) has allowed to increase the safety of public water sup-ply system and significantly reduce the mortality caused by waterborne outbreaks in the developed countries. However, this strategy has not been always successful in detecting out-breaks, including several major ones (Lee et al., 2002). This approach has not also been able to explain sporadic contami-nation cases of drinking water (Hunter, 1997). There are sev-eral reasons for this bias including the following ones: (i) due to different rates of transport in aquatic environment and re-sistance to disinfection, the presence of E. coli does not al-ways correlate with other pathogens (Ashbolt et al., 2001), (ii) some E. coli cells could be injured or stressed and
un-able to reproduce on growth media used for their detection (Scheusner et al., 1971) and (iii) the probability of detect-ing the contamination with grab sampldetect-ing is low due to the small size of samples and limited sampling locations in the networks (van Lieverloo et al., 2007). The significance of the latter two factors in the context of understanding the fate of E. coli is only marginally studied.
et al., 2010). In order to better understand the fate of E. coli, the application of molecular methods are needed which allow to detect microorganisms in different metabolic states includ-ing VBNC. Detection of bacteria which are able to elongate using, so called, direct viable count (DVC) (Kogure et al., 1979) in combination with fluorescence in situ hybridization (FISH) is one of the tools allowing to study VBNC bacteria. In previous studies, to increase the probability of detecting E. coli, the composition of the biofilm was analysed (Juhna et al., 2007) The results showed that ca. 0.1 % from total microbial population in the biofilm consist of E. coli even though no indicators of faecal contamination were found by routine sampling and analyses of water. In the present study the sampling of biofilm and large volumes of water (concen-trates) from the networks over the period of two years was performed and total, cultivable and potentially dividing (de-tected as DVC-FISH) cells were analysed to obtain compre-hensive data about the distribution of E. coli in water distri-bution networks. With this approach it was expected to detect even a low number of E. coli and, hence, better understand the fate of these faecal origin bacteria in the networks. The study was carried out in a large water distribution network (Riga, Latvia) meeting drinking water quality standards with respect to microbiology.
2 Materials and methods
2.1 Site location and sampling
The total length of Riga drinking water supply system is 1374 km with a demand of 1500 L s−1. The 76 % of all pipe length consists of cast and ductile iron, 19 % of steel and the rest of reinforced concrete and polyethylene (Rubulis et al., 2010). The left bank is supplied with two-stage treated sur-face water, whereas the right bank is supplied with ground-water treated by artificial groundground-water recharge through in-filtration. In both cases final chlorination is applied. Detailed parameters of the water can be found elsewhere (Tihomirova et al., 2010).
A total of 24 biofilm samples and 40 water samples were collected from eight sites at water treatment stations and four sites in Riga drinking water supply system (Latvia) (Fig. 1). Points were located at surface and groundwater treatment plants before and during treatment and just after final chlo-rination (S-RW, S-DW, G-RW, G-DW and G-DW’) and at four places in the network (S-NET1, S-NET2, NET1, G-NET2). Samples were collected over a period of two years and included all four seasons.
To collect the biofilm, a stainless steel biofilm collector containing five 3 mm diameter stainless steel coupons in-serted into 25 to 40 mm pipes was attached to the distribution system and kept for two weeks to allow the biofilm forma-tion. After two weeks the collectors were removed and im-mediately transported to the laboratory. Within two hours the biofilm was removed by ultrasonication for 2 min at 20µA
Figure 1.Riga drinking water distribution network with 9 biofilm and water sampling sites including water before (G-RW – raw lake water; S-RW – raw surface water) and after treatment (S-DW – sur-face water after final chlorination) and, G-DW (infiltrated ground-water after final chlorination) and in the network S-NET1, S-NET2, G-NET1 and G-NET2. Numbers 1 and 2 indicate the residence time after treatment – “1” having shorter residence time.
and 22 KHz. A total of 16–40 mL biofilm suspension in ster-ile distilled water was obtained and further analysed. All samples were analysed in double.
A large volume of water samples (more than 100 L) were concentrated to approximately 1 L using tangential ultrafil-tration method. Total concenultrafil-tration time varied from 12– 24 h. The apparatus used for concentration was similar to the one developed within TECHNEAU project. The estimated recovery rate for the concentration of drinking water was 81±33 % (Veenendaal and Brouwer-Hanzens, 2007). The obtained concentrate was collected into sterile glass bottles, transported to the laboratory and analysed within two hours. All samples were analysed in triple.
2.2 Total bacterial numbers (TBN)
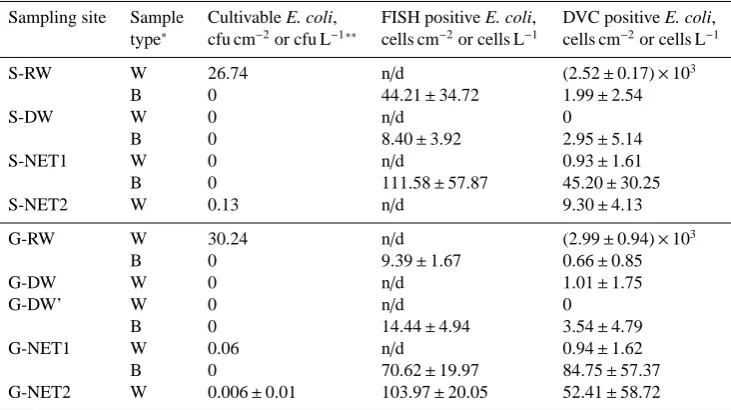
Table 1.Total cultivable, FISH positive and DVC positive (viable) Escherichia coli in the biofilm and water samples. Values are the average for four seasons with standard deviation specified as a maximum and minimum interval.
Sampling site Sample Cultivable E. coli, FISH positive E. coli, DVC positive E. coli,
type∗
cfu cm−2or cfu L−1∗∗
cells cm−2or cells L−1 cells cm−2or cells L−1
S-RW W 26.74 n/d (2.52±0.17)×103
B 0 44.21±34.72 1.99±2.54
S-DW W 0 n/d 0
B 0 8.40±3.92 2.95±5.14
S-NET1 W 0 n/d 0.93±1.61
B 0 111.58±57.87 45.20±30.25
S-NET2 W 0.13 n/d 9.30±4.13
G-RW W 30.24 n/d (2.99±0.94)×103
B 0 9.39±1.67 0.66±0.85
G-DW W 0 n/d 1.01±1.75
G-DW’ W 0 n/d 0
B 0 14.44±4.94 3.54±4.79
G-NET1 W 0.06 n/d 0.94±1.62
B 0 70.62±19.97 84.75±57.37
G-NET2 W 0.006±0.01 103.97±20.05 52.41±58.72
Values are the average for four seasons with standard deviation specified as a maximum and minimum interval.
∗W – water, B – biofilm
∗∗For biofilm samples the results are represented as cfu or cells per cm2, for water samples – cfu or cells per Liter of water.
N/D – not determined
2.3 ATP measurements
ATP was determined according to a modified method de-scribed by Vital et al. (2008). In brief, 500µL of pre-warmed sample were mixed with BacTiter-GloTM System (Promega, USA) and measured with luminometer. Results were ex-pressed as ng ATP per cm2of biofilm sample. For all samples total ATP and free ATP was measured and then cell ATP cal-culated. To obtain free ATP the sample was filtered through 0.1µm pore size syringe filters (Sartorious, Minisart®, Ger-many).
2.4 Culture based methods
To obtain heterotrophic plate counts (HPC) samples were se-rially diluted in sterile distilled water and then inoculated onto R2A agar plates by spread plate technique. All plates were incubated in dark at 22◦C for 7 days. Results were
ex-pressed as colony forming units (CFU) per cm2(biofilm) or ml (water) of sample. For cultivable E. coli samples were analysed by membrane filtration method in a certified ref-erence laboratory according to EN ISO 9308-1:2000 (ISO, 2001).
2.5 DVC-FISH
Cell viability-potential to divide, was determined by mod-ified DVC method by Kogure et al. (1979) and combined with FISH. The validity of the FISH method used for detec-tion of E. coli in this study has been proven earlier where it was compared with other molecular methods. In brief,
sam-ples were mixed with equal amount of Tryptone Soya broth (Oxoid Ltd., UK) and 10µg mL−1 nalidixic acid and incu-bated for 6 h at 30◦C. After the incubation, samples were
fixed with 3–4 % (v/v) formaldehyde for 20 min. Then the samples were filtered onto 25 mm diameter, 0.2µm pore-size filters (Anodisc; Whatman plc) washed with sterile distilled water, removed from filtration device and air-dried. Then, 20µL of PNA hybridization mix consisting of hybridization buffer (50 mM Tris-HCl, 10 % w/v 50 % dextran sulphate, 0.1 mM of NaCl, 30 % v/v formamide, 30 % v/v tetra-sodium pyrophosphate, 0.2 % w/v polyvinylpyrrolidone, 0.2 % w/v Ficoll 400, 5 mM Na2 EDTA, 0.1 % v/v Triton X-100) and 200 nM fluorescently labelled PNA probe, was applied to the filters and covered with cover glass. The PNA probe (TCA ATG AGC AAA GGT) (Perry-O’Keefe et al., 2001) was labelled with CY3 (Ex: 550, Em: 570) and flanked with solubility enhancers (Applied Biosystems, Foster City, CA, USA). The samples were incubated at 57◦C for 60 min in
Table 2.Total bacterial numbers (TBN) and heterotrophic plate counts (HPC) in the biofilm samples.
Sampling site TBN, cells cm−2×10⁶ HPC, cfu cm−2×10⁴ % HPC S-DW 5.64±7.62 4.04±5.33 0.72 S-NET 1 3.17±3.88 8.40±11.89 2.65 S-NET 2 17.13±24.90 41.51±21.62 2.42 G-DW 1.12±0.48 0.78±1.44 0.7 G-NET 1 7.71±10.35 3.14±2.71 0.41 G-NET 2 28.97±18.14 178.50±49.82 6.16
Values are the average for all biofilm samples tested during four seasons with standard deviation specified as a maximum and minimum interval.
3 Results and discussion
Previous studies have shown that E. coli is harboured in drinking water biofilm in a nonculturable form (Juhna et al., 2007). In this study we sampled both water and biofilm at several distances away from water treatment plants to under-stand if the number these bacteria is changing with increase of water residence time. Water supply system (Riga, Latvia) which meets European Drinking Water Directive (98/83/EC) with respect to microbial parameters was selected for study. Analyses of raw water samples (river and groundwater) with standard methods (based on sample cultivation on growth media) showed that water sources contained less than four cultivable E. coli per 100 mL of sample (Table 1), which is an indication of relatively clean surface water. In contrast, DVC-FISH analyses showed that viable E. coli cell concen-tration was about 10 times higher. This is in agreement with previous studies about raw waters (Garcia-Armisen and Ser-vais, 2004) which showed that only a fraction of alive E. coli are detected with traditional methods in raw water sources used for drinking water production.
Analyses of drinking water after treatment and in the distribution network showed that none of water samples exceeded the standard value of zero cultivable E. coli in 100 mL. The applied sample concentration method allowed to decrease the detection limit when compared to traditional sampling methodology. About 30 % of water samples con-tained 0.02 to 1.2 cells in 10 L. All positive samples were obtained further in the networks (S-NET2, NET1 and G-NET2) rather than directly after water treatment. Hence, cul-tivable E. coli cells were present in drinking water, however, the concentration was very low to be detected with traditional sampling and analytical methodology. The analyses of wa-ter samples showed that the lowest amount of FISH positive cells was obtained from water samples (G-DW and S-DW) directly after the treatment plants (Table 1) and this number tended to increase further in the network. The same trend was observed also for viable E. coli (DVC-FISH positive) cells, where their concentration increased from few cells to more than 50 cells per litre as water proceeded into the networks.
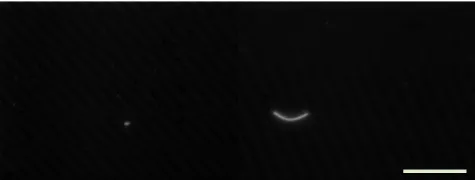
The analyses of biofilm samples showed that at the treat-ment plant (S-DW) as much as 44 E. coli cells per cm2were
Figure 2.G-DW biofilm sample obtained in winter season with FISH positive E. coli (left) and DVC-FISH positive E. coli (right)
Bar 10µm.
present. This particular measurement could be biased by high background fluorescence intensity from humic substances present in the water (Tihomirova et al., 2010). However, the interference from autofluorescent background was overcome by analysing the viable cells with DVC-FISH as in this case the bacterial cells appeared very bright and visible due to their increased size (Fig. 2). The amount of viable E. coli in the biofilm at the treatment plant was 1.99 cells cm−2(S-DW) and 0.66 cells cm−2 (G-DW) indicating that faecal bacteria sporadically can pass though the treatment plant and are har-boured within the biofilm. A significant increase (p<0.03) in DVC-FISH counts was observed when treated (both sur-face and ground) water was compared to (NET) sites in the networks. In total the results of FISH analyses showed that each cm2 of two week old biofilm contain a minimum of 5 E. coli cells (Table 1) and all 24 biofilm and 25 water sam-ples were positive for E. coli. From all FISH positive E. coli in the biofilm, on average 53 % of cells showed the ability to divide.
Along with cell distribution trends, the influence on sea-sonality was analysed and showed that there is no signifi-cant difference (p>0.05) in sampling time for DVC-FISH. Again, irrespective of the season, the highest amount of DVC positive E. coli was observed for points further in the net-work. For total E. coli counts significantly different results were obtained in 2 sites – S-DW (p<0.02) and S-NET1 (p<0.05) where in winter and spring months, respectively, higher counts were obtained, indicating that warmer outside temperatures are not linked to the occurrence of E. coli in the network, especially when the water temperature in the sys-tem is around 13◦C throughout the year.
The highest amount of E. coli was found in the samples collected further away from both water treatment plants (Ta-ble 1). There was no correlation between cultiva(Ta-ble and vi-able E. coli numbers in drinking water, unlike observed for raw water samples (Garcia-Armisen and Servais, 2004). Sim-ilarly the biofilm in locations further away in the network contained more E. coli cells with a higher percentage of DVC positive ones. The high numbers of E. coli could be due to their resistance to chlorine, low chlorine levels at all in the network or low protozoan grazing (Sibille et al., 1998). Their release from the biofilm by detachment (Parsek and Singh, 2003) can have a serious effect on human health, especially if VBNC forms of bacteria, including E. coli O157:H7 are present (Liu et al., 2009). Moreover, lately discussions about the existence of naturalized E. coli, although no pathogenic-ity was proven, raise concerns about secondary contamina-tion of water supply systems due to pathogenic bacteria re-growth (Jjemba et al., 2010).
The particular water supply system is known to support bacterial growth due to the high level of labile organic carbon in drinking water (Tihomirova et al., 2010). Thus, biofilm formation was also studied. The analysis of coupon samples inserted in Riga drinking water distribution network showed that extensive biofilm formation occurred on surfaces just at the outlet from the treatment plant, reaching the concentra-tion of more than 106 bacterial cells per cm2 of the biofilm (Table 2).
The amount of total bacteria, heterotrophic plate counts and E. coli in the biofilm tended to increase with the wa-ter residence time in the network. A positive correlation (R2>0.95) between the total bacterial numbers and het-erotrophic plate counts in the biofilm was obtained. For groundwater supply the percent of cultivable bacteria in the biofilm increased from <1 % just after treatment to more than 6 % at G-NET2 site (Table 2), indicating on the forma-tion of more favourable condiforma-tions for microbial coloniza-tion and growth. Similar increase in the distribucoloniza-tion network was also observed for water samples, where a correlation of R2=0.8869 was obtained between HPC and TBN in five wa-ter samples from one sampling site. But, similarly as in pre-vious studies, no correlation between total bacterial counts or HPC in biofilm and water was observed (Flemming, 2002). In water samples from both treatment plants the bacterial numbers tended to increase with the water residence time in the network. This has been observed previously (Juhna et al., 2007) and could be connected to decrease of disinfectant in the network in addition to increase of bacterial resistance and survival capacity (Gilbert and Brown, 1995; LeCheval-lier and Kwok-Keung, 2004; Saby et al., 2005). Thus, more favourable conditions for biofilm formation and maturing are created.
The results of ATP showed a high variation between the samples (from 1.1 till 2518 ng ATP mL−1) and between the different seasons of samples from one location (7.35 till 2518 ng ATP mL−1). The correlation between ATP and HPC
or TBC was weak, which is similar to previous observa-tions (Delahaye et al., 2003). Comparison of DVC positive E. coli with total bacterial counts showed a linear correlation (R2=0.9637) in the biofilm, thus, indicating on the role of biofilm community on pathogen accumulation. Most of the studies that have examined the presence of E. coli in biofilms have used culture-based assays (Castonguay et al., 2006; Hu et al., 2005) which have limitations, including the duration of incubation, antagonistic organism interference, lack of speci-ficity, and poor detection of slow-growing or non-dividing microorganisms (Rompre et al., 2002). Plate count methods also result in some inaccuracy since the cells can be clumped together and intertwined with other biofilm components. It must be emphasized that methods using microbial growth will not detect non-dividing cells at all. Therefore, the num-ber of E. coli in the drinking water distribution network could be, and likely is, underestimated. The presence of E. coli was inadequately indicated by the traditional culture-based meth-ods in the present study, a finding in agreement with previous studies showing that cultivation-independent detection meth-ods detect at least 10 times more cells (Bjergbaek and Roslev, 2005).
This study has shown that analyses with culture based methods does necessary describe transport of E. coli in drink-ing water distribution system. We have shown that low num-ber of these bacteria can pass though the treatment plant into the networks and accumulate on the surfaces of the pipes in a biofilm. Since no major outbreaks were detected in the wa-ter supply system studied, the link between a low number of E. coli and infections from drinking water cannot be ruled out. However, the findings raise questions about the margin of safety provided by conventional drinking water microbial quality control methods. Further studies should be directed to address this issue.
4 Conclusions
Acknowledgements. This work has been undertaken as a part of the research project “Technology enabled universal access to safe water – TECHNEAU” (Nr. 018320) which is supported by the European Union within the 6th Framework Programme. There hereby follows a disclaimer stating that the authors are solely responsible for the work. It does not represent the opinion of the Community and the Community is not responsible for any use that might be made of data appearing herein.
Edited by: I. Worm
References
Asakura, H., Ishiwa, A., Arakawa, E., Makino, S., Okada, Y., Ya-mamoto, S., and Igimi, S.: Gene expression profile of Vibrio
cholerae in the cold stress-induced viable but non-culturable
state, Environ. Microbiol., 9, 869–879, 2007.
Ashbolt, N. J., Grabow, W. O. K., and Snozzi, M.: World health organization (WHO). Water quality: Guidelines, standards and health, in: Indicators of microbial water quality, edited by: Fewtrell, L. and Bartram, J., IWA Publishing, London, 2001. Bjergbaek, L. A. and Roslev, P.: Formation of nonculturable
Es-cherichia coli in drinking water, J. Appl. Microbiol., 99, 1090–
1098, 2005.
Bogosian, G., Morris, P. J. L., and O‘Neil, J. P.: A mixed culture recovery method indicates that enteric bacteria do not enter the viable but nonculturable state, Appl. Environ. Microbiol., 64, 1736–1742, 1998.
Camper, A., McFeters, G., Characklis, W., and Jones, W.: Growth kinetics of coliform bacteria under conditions relevant to drink-ing water distribution systems, Appl. Environ. Microbiol., 57, 2233–2239, 1991.
Castonguay, M. H., van der Schaaf, S., Koester, W., Krooneman, J., van der Meer, W., Harmsen, H., and Landini, P.: Biofilm forma-tion by Escherichia coli is stimulated by synergistic interacforma-tions and co-adhesion mechanisms with adherence-proficient bacteria, Res. Microbiol., 157, 471–478, 2006.
Delahaye, E., Welte, B., Levi, Y., Leblon, G., and Montiel, A.: An ATP-based method for monitoring the microbiological drinking water quality in a distribution network, Water Res., 37, 3689– 3696, 2003.
Fass, S., Dincher, M. L., Rasoner, D. J., Gatel, D., and Block, J.-C.: Fate of Escherichia coli experimentally injected in a drink-ing water distribution pilot system, Water Res., 30, 2215–2221, 1996.
Flemming, H. C.: Biofouling in water systems – cases, causes and countermeasures, Appl. Microbiol. Biot., 59, 629–640, 2002. Garcia-Armisen, T. and Servais, P.: Enumeration of viable E. coli
in rivers and wastewaters by fluorescent in situ hybridization, J. Microbiol. Meth., 58, 269–279, 2004.
Gilbert, P. and Brown, M.: Phenotypic plasticity and mechanisms of protection of bacterial biofilms from antimicrobial agents, in: Microbial biofilms, edited by: Lappin-Scott, H. E. C., and Coster-ton, J. W., Cambridge University Press, 118–132, 1995. Hu, J., Yu, B., Feng, Y., Tan, X., Ong, S., Ng, W., and Hoe, W.:
Investigation into biofilms in a local drinking water distribution system, in: Biofilms, Cambridge University Press, Cambridge, 19–25, 2005.
Hunter, P. R.: Waterborne disease: Epidemiology and ecology, John Wiley and Sons, West Sussex, 1997.
ISO 9308-1:2000: Water quality – detection and enumeration of
Es-cherichia coli and coliform bacteria – Part 1: Membrane filtration
method, International Organisation for Standartization, 2001. Jjemba, P. K., Weinrich, L. A, Cheng, W., Giraldo, E., and
LeChevallier, M. W.: Regrowth of potential opportunistic pathogens and algae in reclaimed-water distribution systems, Appl. Environ. Microbiol., 76, 4169–4178, 2010.
Juhna, T., Birzniece, D., Larsson, S., Zulenkovs, D., Sharipo, A., Azevedo, N. F., M´enard-Szczebara, F., Castagnet, S., F´eliers, C., and Keevil, C. W.: Detection of Escherichia coli in biofilms from pipe samples and coupons in drinking water distribution networks, Appl. Environ. Microbiol., 73, 7456–7464, 2007. Kogure, K., Simidu, U., and Taga, N.: A tentative direct microscopic
method for counting living marine bacteria, Can. J. Microbiol., 25, 415–420, 1979.
LeChevallier, M. W. and Kwok-Keung, A.: Water treatment and
pathogen control: Process efficiency in achieving safe drinking
water, IWA Publishing on behalf of the World Health Organiza-tion, London, 2004.
Lee, S. H., Levy, D. A., Craun, G. F., Beach, M. J., and Calderon, R. L.: Surveillance for waterborne-disease outbreaks – United States, 1999–2000, MMWR Surveill Summ, 51, 1–47, 2002. Li, J., McLellan, S., and Ogawa, S.: Accumulation and fate of green
fluorescent labeled Escherichia coli in laboratory-scale drinking water biofilters, Water Res., 40, 3023–3028, 2006.
Liu, Y., Wang, C., Tyrrell, G., Hrudey, S. E., and Li, X. F.: Induction of Escherichia coli O157:H7 into the viable but non-culturable state by chloraminated water and river water, and subsequent re-suscitation, Environ. Microbiol. Rep., 2, 155–161, 2009. Liu, Y., Wang, C., Tyrrell, G., and Li, X. F.: Production of
Shiga-like toxins in viable but nonculturable Escherichia coli O157:H7, Water Res., 44, 711–718, 2010.
Mezule, L.: Significance of nonculturable Escherichia coli in drink-ing water: experimental and pilot studies in large drinkdrink-ing water systems, Lambert Academic Publishing, 2012.
Na, S. H., Miyanaga, K., Unno, H., and Tanji, Y.: The survival re-sponse of Escherichia coli K12 in a natural environment, Appl. Microbiol. Biot., 72, 386–392, 2006.
Oliver, J. D.: Recent findings on the viable but nonculturable state in pathogenic bacteria, FEMS Microbiol. Rev., 34, 415–425, 2010. Parsek, M. and Singh, P.: Bacterial biofilms: An emerging link to disease pathogenesis, Annu. Rev. Microbiol., 57, 677–701, 2003. Perry-O’Keefe, H., Stender, H., Broomer, A., Oliveira, K., Coull, J., and Hyldig-Nielsen, J.: Filter-based PNA in situ hybridization for rapid detection, identification and enumeration of specific micro-organisms, J. Appl. Microbiol., 90, 180–189, 2001.
Rompre, A., Servais, P., Baudart, J., de-Roubin, M., and Laurent, P.: Detection and enumeration of coliforms in drinking water: Current methods and emerging approaches, J. Microbiol. Meth., 49, 31–54, 2002.
Rubulis J., Dejus S., and Meksa, R.: Online measurement usage for predicting water age from tracer tests to validate a hydraulic model, 12th Annual Water Distribution Systems Analysis Con-ference, Arizona, Tucson (USA), 2010.
Scheusner, D. L., Busta, F. F., and Speck, M. L.: Inhibition of in-jured Escherichia coli by several selective agents, Appl. Micro-biol., 21, 46–49, 1971.
Sibille, I., Sime-Ngando, T., Mathieu, L., and Block, J. C.: Proto-zoan bacterivory and Escherichia coli survival in drinking wa-ter distribution systems, Appl. Environ. Microbiol., 64, 197–202, 1998.
Tihomirova, K., Rubulis, J., and Juhna, T.: Changes of nom frac-tions during conventional drinking water treatment process in Riga, Latvia, Wa. Sci. Technol., 10, 157–163, 2010.
van Lieverloo, J. H., Mesman, G. A., Bakker, G. L., Baggelaar, P. K., Hamed, A., and Medema, G.: Probability of detecting and quantifying faecal contaminations of drinking water by periodi-cally sampling for E. coli: A simulation model study, Water Res., 41, 4299–4308, 2007.
Veenendaal, H. R. and Brouwer-Hanzens, A. J.: A method for the concentration of microbes in large volumes of water, in: D 3.2.4, TECHNEAU, 1–30, 2007.
Vital, M., Hammes, F., and Egli, T.: Escherichia coli O157 can grow in natural freshwater at low carbon concentrations, Environ. Mi-crobiol., 10, 2387–2396, 2008.
Williams, M. M. and Braun-Howland, E. B.: Growth of Escherichia
coli in model distribution system biofilms exposed to